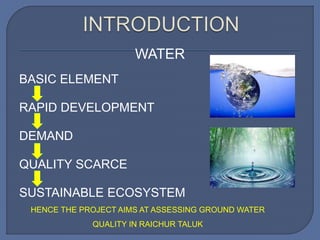
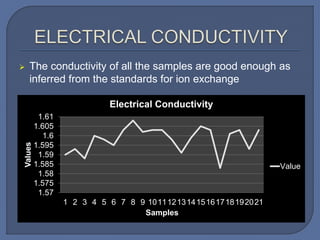
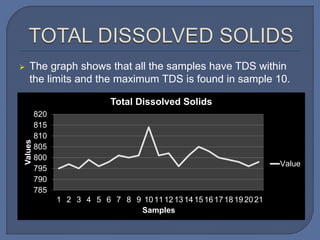
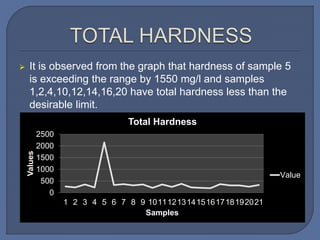
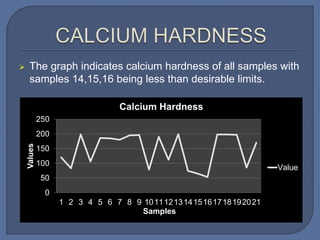
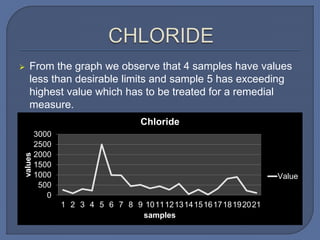
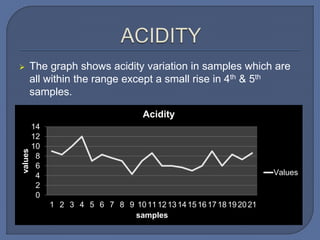
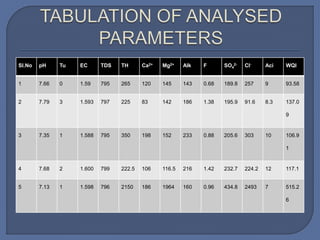
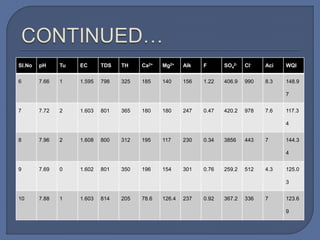
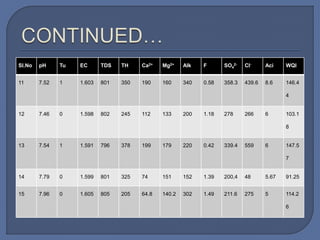
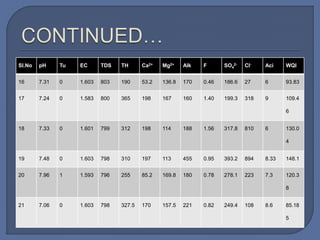
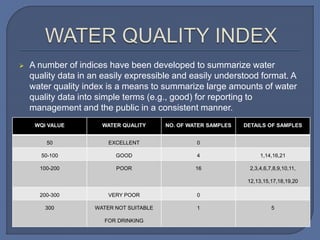
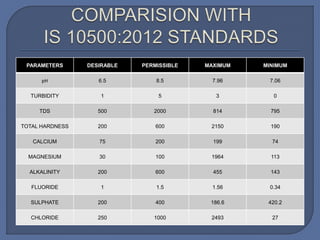
The document is a project report presentation on assessing groundwater quality in Raichur Taluk, Karnataka, India. It includes sections on introduction, literature review, study area and data collection, water quality assessment parameters, and conclusions. 21 sampling locations in and around Raichur Taluk were tested for various water quality parameters including pH, turbidity, electrical conductivity, total dissolved solids, total hardness, calcium hardness, magnesium hardness, alkalinity, fluoride, sulphate, chloride, and acidity. The results found that most parameters were within acceptable limits according to drinking water standards, however some locations had higher levels of parameters like fluoride, sulphate and chloride.
Water Quality Assessment Powerpoint Presentation SlidesSlideTeam
Introducing Water Quality Assessment Powerpoint Presentation Slides. Our readily available water monitoring system PowerPoint slide designs provide an overview of market size, growth rate, and capital expenditure. Demonstrate the division of the wastewater treatment market by editing our content-ready water quality check PPT slide deck. You can easily present the key statistics that play a vital role in analyzing the water industry by using this water treatment PPT slideshow. It is easy to present the key trends that will influence the water industry in the future such as increasing regulation, failing infrastructure, greater conservation, and efficiency, etc. Showcase the leading factors that will affect the performance of the water technology market by using content-ready water quality assurance PowerPoint visuals. You can edit water quality testing PPT themes to present the sources of water pollution. Highlight the natural processes and human processes that affect water quality. Provide an overview of the optimization of deterioration in water quality. You also can present the chemicals and biological pollutants that deteriorate the water quality. Showcase the water quality monitoring types and their objectives by downloading our visually attention-grabbing water quality monitoring PPT slides. https://bit.ly/3lzljrF
Water quality depends on various physical, chemical, and biological parameters. Key parameters for assessing water quality for human consumption include pH, dissolved oxygen, biochemical oxygen demand, temperature, conductivity, total dissolved solids, and turbidity. Monitoring these parameters provides information about water contamination levels and suitability for drinking and environmental uses.
This document discusses water quality standards and parameters for drinking water. It outlines the physical, chemical, and bacteriological contamination sources that can affect water. The key water quality parameters discussed include turbidity, pH, hardness, alkalinity, iron, chloride, nitrate, fluoride, arsenic, and heavy metals. BIS drinking water standards for various parameters are provided. The importance of residual chlorine is also mentioned. Overall, the document provides an overview of water quality issues and the standards used to define safe drinking water.
Quality of water :
It includes all the physical, chemical and biological parameters along with test to be used for defining water quality and water schemes for city
The document discusses various types of drinking water and their characteristics, as well as WHO and Pakistan water quality standards. It provides details on parameters for bottled water quality limits and methods for water quality analysis. Several studies on water sources and quality in Gilgit-Baltistan are summarized. Spring water is described as naturally filtered and free from contamination, while bottled water may be affected by plastic toxicity, UV radiation during processing, and chemicals added through reverse osmosis.
Handout prepared to the "Introduction to water and waste water management|.
Brief introduction about water and wastewater monitoring.
Contact: adnansirage@gmail.com
This presentation describes, how the water can be analyzed using the basic parameters like DO, COD, BOD, Alkalinity and so on. The physical, chemical, and biological parameters were discussed here.
WATER ANALYSIS /Water quality testing p.k.kPUSHPA KHOLA
This document discusses water quality testing parameters and methods. It notes that water contains contaminants and periodic testing is needed to ensure safety. Key physical, chemical, and biological characteristics are examined, including odor, temperature, pH, total solids, dissolved solids, suspended solids, alkalinity, hardness, calcium, chloride, fluoride, phosphate, sulfate, nitrate, oil and grease, and dissolved oxygen. Methods like titration, spectrophotometry, and incubation are described. Indian drinking water standards provide guidelines for parameters like TDS, pH, and hardness. Equipment used in analysis includes spectrophotometers, pH/TDS meters, COD digesters, and TSS filter assemblies. Regular water testing
Nearly all water in the world contains contaminants, even in the absence of nearby pollution-causing activities
Many dissolved minerals, carbon compounds, and microbes find their way into drinking water as it comes in contact with air and soil
When pollutant and contaminant levels in drinking water are high, they may affect household routines and be detrimental to human health
The only way to ensure that your water supply is safe is to have a periodic laboratory water quality analysis done on your drinking water. Hach India is the leading provider of high end water quality analysis equipment in india
This document discusses Darcy's law, which describes the flow of water through porous media such as sand and rock. It outlines Henry Darcy's experiments in 1856 that validated the proportional relationship between flow rate and hydraulic gradient. The document then describes the experimental setup used to test Darcy's law, involving flowing water through a sand-packed cylinder and measuring pressure and flow. It also discusses factors that determine the validity of Darcy's law such as permeability, transmissivity, and Reynolds number. In conclusion, it summarizes the key properties of groundwater flow as described by Darcy's law.
Final Year Thesis Presentation EXPERIMENTAL EVALUATION OF “WATER QUALITY” ACH...Latif Hyder Wadho
The document summarizes an experimental evaluation of water quality achieved through rapid sand filters (RSFs) at a 0.3 MGD water treatment plant in Sukkur, Pakistan. Laboratory tests were conducted on water samples from the inlet and outlet to analyze physical and chemical parameters. Test results showed that most parameters like turbidity, pH, chlorides, nitrates, and hardness met World Health Organization and Pakistan standards at the outlet, indicating the RSFs purified the water effectively. The conclusion was that the treated water supplied was safe for drinking. Future recommendations included more frequent water quality checks and analyzing additional chemical parameters.
This document discusses the quality of water from surface and underground sources. It provides details on various physical, chemical and biological parameters used to analyze water quality. These include turbidity, pH, hardness, dissolved solids, chlorides, nitrogen, phosphorus and the presence of metals, bacteria or algae. The purpose of water analysis and treatment is described as ensuring water safety and removing impurities for drinking. Common treatment methods and components of water treatment plants are also mentioned.
In this presentation, application of some parameters of water wwater analysis (i.e., Acidity, Sulfate, Volatile Acid,Nitrogen,greases and oils) , procedure to measure that parameter, environmental significance of that parameter and importance of that parameter in waste water analysis.
Monitoring natural waters provides important information about environmental health and human impacts. There are four main methods: visual surveys assess appearance and conditions; biological inventories examine macroinvertebrate diversity and pollution tolerance; water quality tests measure factors like pH, temperature, dissolved oxygen, and contaminants; and flow rate can be monitored. Together these methods generate data for understanding watersheds and informing management decisions.
This document provides information on different types of dams including their definitions, structures, advantages, disadvantages and classifications. It discusses common dam types such as gravity dams, arch dams, buttress dams, embankment dams and their design considerations. Examples of major dams from around the world are also highlighted such as the Three Gorges Dam, Hoover Dam and dams in Thailand. Causes of dam failures are briefly mentioned.
Water quality is one of the most important factors in a healthy ecosystem. Clean water supports a diversity of plants and animals.
The quality of the water you consume or use in municipal or industrial processes must meet specific parameters to ensure that drinking water remains free from contaminants that could cause health issues.
Water quality measurements include physical, chemical, and biological parameters.
Flood Mapping via HEC-RAS Model and ArcGISLengthong KIM
This research was taken place along the lower Mekong river reach part in Cambodia. The purpose of the study is to evaluate the HEC-RAS performance whether it eligible for Cambodia flood studies or not.
Stream Gauging: Necessity; Selection of gauging sites; Methods of discharge measurement; Area-Velocity method; Venturi flume; Chemical method; weir method; Measurement of velocity; Floats Surface float, Sub–surface float or Double float, Twin float, Velocity rod or Rod float; Pitot tube; Current meter; Working of current meter; rating of current meter; Measurement of area of flow; Measurement of width - Pivot point method; Measurement of depth Sounding rod, Echo- sounder.
Darcy's law describes the flow of fluid through a porous medium. It states that the flow rate is proportional to the permeability of the medium and the pressure drop over a distance, divided by the fluid viscosity and length. Darcy's law provides a simple relationship between the discharge rate, permeability, pressure drop, fluid properties, and distance. It is commonly used in hydrology and fluid dynamics to model flow through porous materials like aquifers and soil.
wholesomeness, Requirements for Domestic Use. Impurities in Water. Objects & purpose of Water Analysis.Collection of Samples. Classification of Analysis of Water: Physical,
Chemical & Biological Examination of Water.
Water chemistry, quality of drinking water and irrigation water.Aminul Haque
This document summarizes key properties and chemistry of water. It discusses water's unique ability to absorb large amounts of heat both when melting and evaporating due to hydrogen bonding. This allows ice and evaporation to effectively cool objects and environments. The document also outlines water's role as a solvent, how it readily dissolves ionic compounds and polar molecules. Acids and bases are explained, with acids defined as substances that release hydrogen ions in water. Buffers ability to resist pH change in biological systems and importance of maintaining blood pH is summarized. Finally water's cohesive and adhesive properties allow it to move through plants and exert surface tension is briefly touched on.
Mallikarjun A.H submitted a seminar on subsurface investigation of groundwater to Ms. Smitha T.L at Kuvempu University's Department of P.G Studies and Research in Applied Geology. The seminar covered various subsurface methods for groundwater exploration, including test drilling techniques like geological logging, drilling time logging, and water level measurements. It also discussed borehole geophysical logging methods such as resistivity logging, spontaneous potential logging, and radiation logging techniques like natural gamma, gamma-gamma, and neutron logging. The seminar provided details on each technique's application and limitations.
COMPARATIVE ANALYSIS OF WATER QUALITY IN TAMIRABARANI RIVER ENCROACHED BY WAT...Jenson Samraj
This dissertation explains the analysis of water quality in which the Eichhornia crassipes lives further from many different samples the water was analyzed by my friend Mr. Esakki Raja
This presentation deals with the recent advancement in the field of ground water sampling and analysis technique and water born survey as well as Indian scenario to interpret.
Water quality refers to the chemical, physical, and biological characteristics of water. It is determined by measuring various parameters and comparing them to standards for different intended uses like drinking water, recreation, agriculture, and ecosystem health. Assessing water quality involves understanding natural and human factors that can influence contaminant levels. Monitoring programs and technologies help evaluate water quality over time and inform policies to protect water resources and public health.
The document discusses water quality parameters for assessing groundwater and surface water sources. It provides information on various physical, chemical, and biological parameters including pH, hardness, TDS, chloride, fluoride, nitrate, and fecal coliforms. It explains acceptable limits for these parameters according to BIS standards and potential health effects of contamination. The document also discusses how factors like geology, land use, and anthropogenic activities influence water quality in different areas.
This document discusses stratification in lakes. It describes how lakes are vertically divided into three layers - the epilimnion on top which is mixed by wind, the metalimnion in the middle where temperature drops rapidly, and the hypolimnion on the bottom which remains cool and unaffected by wind. It also explains how the stability of this stratification depends on the energy required to uniformly mix the layers, and discusses differences between eutrophic and oligotrophic lakes in terms of biomass, diversity, and water quality.
The document discusses different types of lakes categorized based on their nutrient levels and source. There are three main types: oligotrophic lakes which have very low nutrient levels and clear water; mesotrophic lakes which have moderate nutrient levels; and eutrophic lakes which have high nutrient levels and murky water. Other lake types include tectonic, volcanic, glacier, salty, artificial, oxbow, and meromictic lakes which have specific geological or environmental characteristics.
This document presents the results of a study analyzing water quality and levels of arsenic contamination in groundwater samples from Mailsi and Sargana, Punjab, Pakistan. Key findings include:
1) Groundwater was found to be contaminated with heavy metals including arsenic, with mean arsenic concentrations of 166.4 ug/L in Sargana and 130.7 ug/L in Mailsi, exceeding WHO standards.
2) Statistical analyses found correlations between arsenic and other parameters like sulfate and bicarbonate. Multivariate analyses grouped parameters and identified factors influencing groundwater composition.
3) Health risk assessments found that average daily arsenic doses from drinking this water posed risks like a maximum HQ of
Powai Lake is an artificial lake located in Mumbai that was constructed in 1891 as a measure against water famine. It has experienced problems with decreased area due to development, water quality deterioration from untreated sewage and garbage, and heavy siltation that has reduced its depth. Proposed solutions to address these issues include installing septic sewage pumping systems, patrolling to prevent damage and littering, education programs to raise awareness, bioremediation to remove pollutants, landscaping, desilting to increase water quantity, restricting construction in catchment areas, and promoting environmental ethics.
This document provides an overview of major lake types and how lakes can serve as archives of environmental change. It discusses volcanic, tectonic, and glacial lakes as the primary lake origins. It then explains how lakes record climate and environmental changes through responses in their physical, biological, and chemical properties over time, as seen in sediments, biota, and isotopic signatures. Specific examples demonstrate how paleoclimate reconstructions can be developed by analyzing changes in lake sediments, pollen, diatoms, ostracodes, chironomids, and other biological indicators.
Lakes are inland bodies of fresh water formed in depressions on the land surface. They are found all over the world but are most common in high latitude and mountainous regions. Lakes form through processes such as glacial erosion and deposition, shifts in the Earth's crust, volcanic activity, and landslides. Lakes stratify into layers based on water temperature and density. In temperate lakes, seasonal changes cause the layers to mix, replenishing oxygen levels. Lakes support a variety of plant and animal life adapted to different depths and oxygen conditions. Human activities can negatively impact lakes through pollution, development, and other disturbances.
The presentation proposes redeveloping Upvan Lake in Thane by adding various recreational activities and amenities to better utilize the space. This includes developing a new parking area, improving existing food stalls and pathways, adding an open-air restaurant, party lawn, cactus garden, exhibition space, swimming pool, tennis courts, skate park, and children's play area. The goal is to transform Upvan Lake into an elite leisure and social destination called "Lake Upvan - A Renew" that would boost the local property values and brand the area. Case studies of successful waterfront developments in other cities are presented to support the proposal.
This document presents information about artificial groundwater recharge by Ankit Saini. It discusses the need for artificial recharge due to increasing water demand and declining groundwater levels. It describes various methods of artificial recharge including surface methods like flooding, basin tanks and sub-surface methods like recharge wells, shafts and dug wells. The document emphasizes that artificial recharge helps augment groundwater storage but sustained management is also needed.
prashant new civil project for last yearAnantJadhav23
The document is a presentation on the geochemical investigation of groundwater in the Krishna River basin. It discusses the importance of groundwater, sources of contamination, and the geochemistry of groundwater. Water samples were collected from 31 wells in the study area and analyzed for parameters like pH, alkalinity, hardness, chlorides, and heavy metals. The results were found to exceed permissible limits for some parameters. The graphical representation showed variation in chemical composition of groundwater across the study area.
This document summarizes a study on the hydrogeochemistry of groundwater in the Kaveripakkam Block of Vellore District, Tamil Nadu, India. 12 groundwater samples were collected and analyzed for physicochemical parameters and ions to understand the suitability of the groundwater for consumption, agriculture, and other household uses. The results indicate that the groundwater generally has a CaHCO3 facies with high salinity in some areas. Most samples were found suitable for irrigation and drinking according to WHO and other standards, though a few exceeded limits for parameters like EC, TDS, calcium, and sodium. The hydrogeochemistry of the region is mainly influenced by weathering processes.
This document provides an introduction to desalination. It discusses water scarcity issues driven by growing freshwater use and depletion of resources. It explains that seawater is saline due to minerals dissolved from soil and rocks being deposited in oceans over millions of years. The document then describes different desalination technologies including membrane processes like reverse osmosis and thermal processes like multi-stage flash. It also discusses future options for desalination technology that could improve efficiency and reduce costs.
This document summarizes a study of arsenic contamination in groundwater in the Vallanadu region of Tamil Nadu, India. Thirty-six groundwater samples were collected and analyzed for arsenic and other parameters. Arsenic concentrations ranged from 0.003 to 0.017 mg/L, with slightly higher levels found near the Thambraparani River and along geological lineaments. The main sources of arsenic were identified as pesticides used in agriculture and waste from automobiles discharged into the river. Though most samples met standards, concentrations above 0.01 mg/L were found in some locations. The study recommends reducing arsenic-containing pesticides and installing filters to address contamination issues.
The study assessed the impact of diamond mining on water quality in the Save and Odzi Rivers in Zimbabwe. Water quality was tested at 10 sites, including reference sites upstream of mining. Results showed high levels of turbidity, total solids, pH, fluoride, heavy metals like iron, chromium and nickel, and bacterial contamination downstream of mines. This pollution poses health and environmental risks and has likely impacted livelihoods by reducing access to potable water and fishing. The water quality declined significantly after mining discharges, classified as "bad" compared to the medium quality at reference sites. Mines need to improve waste management to address the ongoing pollution problems.
Hydrochemical Characteristics and Shallow Groundwater Quality in Kirkuk Urban...Agriculture Journal IJOEAR
Abstract— The assessment of hydrochemical characteristics and shallow groundwater quality was carried out in Kirkuk urban area, Iraq. Twenty two water samples were collected systematically at 20 locations for each of high and low water seasons in April and September (2014) and analysed for physical and chemical parameters. Hydrochmical data suggest that contamination of ground water is caused by infiltration of surface water polluted by domestic seepage pits and leakage from local agricultural area. Depending on hydrochemical facies, the type of water that predominates in the urban area is Ca-Mg-SO4 type during both wet and dry seasons. The study found that Kirkuk shallow groundwater is unsuitable for drinking water and industries purposes but some of water samples are suitable for construction and irrigation purposes.
This article discusses a study on the spatial analysis of dissolved silica in groundwater in Villupuram district, Tamil Nadu, India. 120 groundwater samples were collected and analyzed for major ions and physicochemical parameters. Results showed silica concentrations ranged widely between formations. Thermodynamic, statistical, and GIS techniques were used to understand the reasons for these differences. Piper plots showed water types were mostly Ca-Mg-Cl and Na-Cl, indicating mixed water. Stability diagrams showed samples were stable with kaolinite and tended toward montmorillonite, indicating rock-water interaction and mineral dissolution over time.
Welcome to International Journal of Engineering Research and Development (IJERD)IJERD Editor
This document analyzes water quality of the Mohand Rao river in Doon Valley by measuring levels of calcium (Ca2+) and magnesium (Mg2+) ions at different sampling stations along the river from 2004-2006. The study found that calcium levels were highest during the monsoon season at the first sampling station. Magnesium levels were also higher during monsoon season compared to summer and winter. Overall, both calcium and magnesium ion levels increased from 2004 to 2006 according to water quality analysis results. The water quality index was calculated to determine the status of water quality.
Research Inventy : International Journal of Engineering and Science is published by the group of young academic and industrial researchers with 12 Issues per year. It is an online as well as print version open access journal that provides rapid publication (monthly) of articles in all areas of the subject such as: civil, mechanical, chemical, electronic and computer engineering as well as production and information technology. The Journal welcomes the submission of manuscripts that meet the general criteria of significance and scientific excellence. Papers will be published by rapid process within 20 days after acceptance and peer review process takes only 7 days. All articles published in Research Inventy will be peer-reviewed.
10 a study of heavy metal pollution of ghaggar river ravi pareekBIOLOGICAL FORUM
1. The study analyzed heavy metal pollution in the Ghaggar River throughout its 466 km stretch in India. Water samples from 16 sites were tested for concentrations of metals including Fe, Hg, As, Pb, Cu, Zn, Cd, Ni, and Cr.
2. The results showed that Fe had the highest concentration among the metals tested, followed by Zn, Ni, Cu, Cd, Cr, Pb, Hg, and As, which was absent from all samples. Some metal concentrations exceeded national drinking water guidelines.
3. Sources of heavy metal pollution included domestic, industrial, and municipal wastewaters discharged into the river along its course. High metal levels could pose health risks to humans and aquatic
1) The document discusses the hydrology of Manipur and Nagaland states in northeast India, including their geology, groundwater availability and quality, and challenges.
2) In Manipur, groundwater is found under thin clay layers underlain by tertiary rock and supplied by confined and unconfined aquifers. In Nagaland, groundwater comes from semi-confined and unconfined aquifers in alluvial deposits and tertiary rock.
3) Key challenges faced include water scarcity due to variable rainfall, overexploitation of groundwater lowering water tables, and lack of irrigation infrastructure limiting food sustainability. Mitigation strategies proposed are adopting efficient water management techniques and artificial groundwater recharging
irrigation water quality (Pragya tiwari).pptxPragyaTiwari69
This document discusses criteria for evaluating water quality for irrigation purposes, including salinity, sodium hazard, residual sodium carbonates, and ion toxicity. It outlines four classes of water salinity based on electrical conductivity measurements, from low to very high salinity. Sodium hazard is expressed as sodium adsorption ratio (SAR), with values below 8 considered safe. Residual sodium carbonates (RSC) are also evaluated to assess additional sodium hazard. Specific ions like boron, chloride, and sodium can cause toxicity issues in certain concentrations. Proper analysis of irrigation water chemistry is needed to evaluate suitability for agriculture.
Assessment of impact of climatic change on groundwater quality around igbokod...Alexander Decker
This document summarizes a study that assessed the impact of coastal saltwater on groundwater quality in Igbokoda, Nigeria. Hydrochemical analysis of 39 groundwater samples found higher concentrations of sodium and chloride ions compared to other ions, indicating influence from saltwater intrusion. While most ion concentrations met drinking water standards, iron and manganese exceeded guidelines in some samples. Ratios of ions like magnesium to calcium and chloride to bicarbonate suggested transformation of fresh groundwater to brackish water in parts of the aquifer due to saltwater mixing. The dominant groundwater type was characterized as sodium-chloride, reflecting saltwater influence, along with some calcium-bicarbonate freshwater sources.
International Journal of Engineering and Science Invention (IJESI) is an international journal intended for professionals and researchers in all fields of computer science and electronics. IJESI publishes research articles and reviews within the whole field Engineering Science and Technology, new teaching methods, assessment, validation and the impact of new technologies and it will continue to provide information on the latest trends and developments in this ever-expanding subject. The publications of papers are selected through double peer reviewed to ensure originality, relevance, and readability. The articles published in our journal can be accessed online.
Ground Water Quality Assessment using Geo Spatial Technology in Part of Lower...IRJET Journal
This document summarizes a study that assessed groundwater quality in the lower Vaigai river basin in Madurai District, Tamil Nadu, India using geospatial technology. Water samples were collected from 10 locations and tested for parameters like pH, nitrate, sulfate, chloride, and total dissolved solids. Maps showing the spatial distribution of water quality in 2003 and 2015 were generated. It was found that the maximum nitrate level was 4800 mg/l in 2006, and that some areas had increasingly high levels of salts and nitrates over time due to factors like fertilizer use and wastewater. The study identified some areas as potable and others as moderate or non-potable. It concluded that water quality is
International Journal of Engineering Research and Applications (IJERA) is an open access online peer reviewed international journal that publishes research and review articles in the fields of Computer Science, Neural Networks, Electrical Engineering, Software Engineering, Information Technology, Mechanical Engineering, Chemical Engineering, Plastic Engineering, Food Technology, Textile Engineering, Nano Technology & science, Power Electronics, Electronics & Communication Engineering, Computational mathematics, Image processing, Civil Engineering, Structural Engineering, Environmental Engineering, VLSI Testing & Low Power VLSI Design etc.
Hard water regimes during pre monsoonal period in rajnagar block, odisha, ind...eSAT Journals
Abstract
From the hydrochemical analysis of 53 representative groundwater samples along coastal Kendrapara district, Odisha, the current research establishes widespread occurrences of moderately hard to hard groundwater within the subsurface water bearing horizons. There exists a distinct belt of moderately hard ground water in the Rajnagar block of the district whereas soft water occurrence is practically absent in the study area. The analysis also points to no specific interrelationship between the hardness of groundwater to that of the physical parameters including pH and electrical conductance.
Keywords: Aquifer, Total Hardness, SRTM, GIS
This document discusses various aspects of water resources including:
1) Water is found in three main forms - saltwater in oceans, freshwater in lakes/rivers/groundwater, and frozen water.
2) The water cycle describes the continuous movement of water between these forms through evaporation, condensation, precipitation and other processes.
3) Water resources are essential for agriculture, industry, and human/environmental needs but are increasingly threatened by pollution, overuse, and climate change. Integrated management plans are needed to ensure sustainable access.
Electric vehicle and photovoltaic advanced roles in enhancing the financial p...IJECEIAES
Climate change's impact on the planet forced the United Nations and governments to promote green energies and electric transportation. The deployments of photovoltaic (PV) and electric vehicle (EV) systems gained stronger momentum due to their numerous advantages over fossil fuel types. The advantages go beyond sustainability to reach financial support and stability. The work in this paper introduces the hybrid system between PV and EV to support industrial and commercial plants. This paper covers the theoretical framework of the proposed hybrid system including the required equation to complete the cost analysis when PV and EV are present. In addition, the proposed design diagram which sets the priorities and requirements of the system is presented. The proposed approach allows setup to advance their power stability, especially during power outages. The presented information supports researchers and plant owners to complete the necessary analysis while promoting the deployment of clean energy. The result of a case study that represents a dairy milk farmer supports the theoretical works and highlights its advanced benefits to existing plants. The short return on investment of the proposed approach supports the paper's novelty approach for the sustainable electrical system. In addition, the proposed system allows for an isolated power setup without the need for a transmission line which enhances the safety of the electrical network
Optimizing Gradle Builds - Gradle DPE Tour Berlin 2024Sinan KOZAK
Sinan from the Delivery Hero mobile infrastructure engineering team shares a deep dive into performance acceleration with Gradle build cache optimizations. Sinan shares their journey into solving complex build-cache problems that affect Gradle builds. By understanding the challenges and solutions found in our journey, we aim to demonstrate the possibilities for faster builds. The case study reveals how overlapping outputs and cache misconfigurations led to significant increases in build times, especially as the project scaled up with numerous modules using Paparazzi tests. The journey from diagnosing to defeating cache issues offers invaluable lessons on maintaining cache integrity without sacrificing functionality.
artificial intelligence and data science contents.pptxGauravCar
What is artificial intelligence? Artificial intelligence is the ability of a computer or computer-controlled robot to perform tasks that are commonly associated with the intellectual processes characteristic of humans, such as the ability to reason.
› ...
Artificial intelligence (AI) | Definitio
International Conference on NLP, Artificial Intelligence, Machine Learning an...gerogepatton
International Conference on NLP, Artificial Intelligence, Machine Learning and Applications (NLAIM 2024) offers a premier global platform for exchanging insights and findings in the theory, methodology, and applications of NLP, Artificial Intelligence, Machine Learning, and their applications. The conference seeks substantial contributions across all key domains of NLP, Artificial Intelligence, Machine Learning, and their practical applications, aiming to foster both theoretical advancements and real-world implementations. With a focus on facilitating collaboration between researchers and practitioners from academia and industry, the conference serves as a nexus for sharing the latest developments in the field.
Batteries -Introduction – Types of Batteries – discharging and charging of battery - characteristics of battery –battery rating- various tests on battery- – Primary battery: silver button cell- Secondary battery :Ni-Cd battery-modern battery: lithium ion battery-maintenance of batteries-choices of batteries for electric vehicle applications.
Fuel Cells: Introduction- importance and classification of fuel cells - description, principle, components, applications of fuel cells: H2-O2 fuel cell, alkaline fuel cell, molten carbonate fuel cell and direct methanol fuel cells.
Redefining brain tumor segmentation: a cutting-edge convolutional neural netw...IJECEIAES
Medical image analysis has witnessed significant advancements with deep learning techniques. In the domain of brain tumor segmentation, the ability to
precisely delineate tumor boundaries from magnetic resonance imaging (MRI)
scans holds profound implications for diagnosis. This study presents an ensemble convolutional neural network (CNN) with transfer learning, integrating
the state-of-the-art Deeplabv3+ architecture with the ResNet18 backbone. The
model is rigorously trained and evaluated, exhibiting remarkable performance
metrics, including an impressive global accuracy of 99.286%, a high-class accuracy of 82.191%, a mean intersection over union (IoU) of 79.900%, a weighted
IoU of 98.620%, and a Boundary F1 (BF) score of 83.303%. Notably, a detailed comparative analysis with existing methods showcases the superiority of
our proposed model. These findings underscore the model’s competence in precise brain tumor localization, underscoring its potential to revolutionize medical
image analysis and enhance healthcare outcomes. This research paves the way
for future exploration and optimization of advanced CNN models in medical
imaging, emphasizing addressing false positives and resource efficiency.
The Python for beginners. This is an advance computer language.
Gwqar ppt
1. A PROJECT REPORT PRESENTATION BY:
ALPHONSA MONICA (3NA11CV002)
LALHRUAITLUANGI SAILO (3NA11CV012)
LALTHAFAMKIMI (3NA11CV013)
TABITHA G (3NA11CV030)
Under the guidance of:
Prof. ASHISH P DESAI
NAVODAYA INSTITUTE OF TECHNOLOGY (NIT),
RAICHUR
2. 1. INTRODUCTION
2. LITERATURE REVIEW
3. STUDY AREA AND DATA COLLECTION
4. ASSESSMENT OF WATER QUALITY
5. CONCLUSION AND SCOPE OF STUDY
6. REFERENCES
4. Groundwater is the water that is found underneath
the Earth's surface at profundities where all the
pore (open) spaces in the soil, sediments, or rock
are completely stacked with water.
Groundwater of any structure whether from a
shallow well or a significant well is refilled
(energized) by precipitation.
Groundwater is a piece of the hydrologic cycle,
beginning when a piece of the precipitation that
falls on the Earth's surface sinks (infiltrates)
through the soil and enters (seeps) diving to wind
up groundwater.
Groundwater will at long last come back to the
surface, discharging to streams, springs, lakes, or
the oceans, to complete the hydrologic cycle.
5.
6. The formation
below the earth’s
surface is divided
into two zones by
an irregular surface
called the water
table.
At all points in the
water table the
pressure is
atmospheric.
7. Provides guideline regarding design and
construction of ground water structure.
Water availability in the ground creates a
sense of ownership amongst land holders.
Availability shows there is no shortage of
water to aid the demand of irrigation.
Generates a vast scope for development
of different activities----agriculture,
industries etc.
8. Water quality index (WQI) is valuable and unique rating
to depict the overall water quality status in a single term
that is helpful for the selection of appropriate treatment
technique to meet the concerned issues. (Shweta Tyagi
and Bhavtosh Sharma, Water Quality Index at
Uttarakhand)
Apart from the municipal supply the population also
depends upon the ground water reservoirs. Groundwater
quality of southern India is strongly dependent on
bedrock geology and climate but may also be impacted
in parts by pollution, particularly from agricultural and
industrial sources.(RAMKRISHNA, Water Quality Index
at Vishakapatnam)
9. Raichur district is
situated in north-eastern
part of Karnataka state.
It falls in the Northern
Maidan region, between
15º 33’- 16º 34’ North
latitudes and 76º 14’-
77º 36’ East longitudes.
It lies between the two
major rivers namely the
Krishna and the
Tungabhadra. The
district is bounded on
the north by Gulbarga,
on the east by the
Mahbubnagar district of
Telangana state.
10. Raichur district forms part of Krishna catchment in
northern part, while southern part forms the Lower
Tungabhardra catchment area. The two important
rivers in the district are the Krishna and the
Tungabhadra, which form the northern and
southern boundary of the district respectively and
are perennial in nature. River Bheema is an
important tributary of the river Krishna. The
drainage pattern is highly dendritic in nature. The
drainage pattern in the area has been altered due
to the irrigation practices in the area.
11.
12. Raichur district is located in the northern Maidan
Region of Karnataka State, which is drought prone and
falls in the arid tract.
The climate of the district can be termed as mild to
severe, with mild winters and hot summers.
December is the coldest month with mean daily
minimum of 17.7º C, while May is the hottest month
with mean daily maximum temperature of 39.8º C.
The day temperature in May often touches 45.0ºC.
The normal annual rainfall of the district is 621mm.
The annual number of the rainy days is about 49 days.
14. Geomorphologically, Raichur district can be
broadly classified into three major zones such
as,
(a)The Northern rugged plateau
(b)The Southern lower plains with
inselbergs and isolated hillocks
(c) Valley fills
The soils of the district can be classified
broadly into the following four types namely:
Mixed red and black soils, Medium black
soils, Deep black soils and Red sandy soils.
16. HYDROGEN ION
CONCENTRATION
TURBIDITY
Hydrogen ion concentration
is the measure of the acidity
of a solution of water. The
pH scale commonly ranges
from 0 to 14. Water with a
pH below 7.0 is considered
acidic while water with pH
greater than 7.0 is
considered basic or alkaline.
Turbidity is the technical term
referring to the cloudiness of a
solution and it is a qualitative
characteristic which is imparted
by solid particles obstructing
the transmittance of light
through a water sample.
Turbidity often indicates the
presence of dispersed and
suspended solids like clay,
organic matter, silt, algae and
other microorganisms.
17. ELECTRICAL
CONDUCTIVITY
TOTAL DISSOLVED SOLIDS
Conductivity is a numerical
expression of an aqueous
solution's capacity to carry
an electric current. This
ability depends on the
presence of ions, their total
concentration, mobility,
valence and relative
concentrations and on the
temperature of the liquid.
The TDS includes all
dissociated and undissociated
substances, except
suspended sediments,
colloids or dissolved gases.
The bulk of TDS includes
bicarbonates, sulphates and
chlorides of calcium,
magnesium, sodium and
silica.. The area where the
water has low TDS may be
considered as possible area
of recharge.
18. TOTAL HARDNESS CALCIUM HARDNESS
The principal natural sources of
hardness in water are
sedimentary rocks, seepage and
runoff from soils. In general, hard
waters originate in areas with
thick topsoil and limestone
formations. Groundwater is
generally harder than surface
water. Total hardness is normally
expressed as the total
concentration of Ca2+ and Mg2+ in
mg/l, equivalent CaCO3. Calcium
(Ca2+) and magnesium (Mg2+)
are the important parameters for
total hardness.
This ion is easily precipitated and
in particular react with soap to
make it difficult to remove scum.
Calcium is an essential element
required for good health and its
daily requirement varies from
0.7-2.0 gm. Insufficient amount
of calcium may induce adverse
physiological effects. On the
contrary excess amount of
calcium in body results in
formation of urinary bladder
stone and irritation in urinary
passage.
19. MAGNESIUM HARDNESS ALKALINITY
Magnesium is essential as an
activator of many enzyme
systems
Olivine, augite, biotite,
hornblende, serpentine and talc
are some major magnesium-
bearing minerals.
The high concentration of
magnesium ion may cause
laxative effect, while deficiency
may cause structural and
functional changes.
Alkalinity is the sum total of
components in the water that
tend to elevate the pH to the
alkaline side of neutrality
Commonly occurring materials
in water that increase alkalinity
are carbonates, bicarbonates,
phosphates and hydroxides.
Limestone bedrock and thick
deposits of glacial till are good
sources of carbonate buffering.
Ground water within such
areas are usually well-buffered.
20. FLUORIDE SULPHATE
The concentration of fluoride in
groundwater is principally
governed by climate, the
composition of the host rock and
hydrogeology. Fluorite is the
principal bearer of fluoride and is
found in granite, gneiss, and
pegmatite.
IS code provisions of 2012 set a
range of 1-1.5 mg/l and crossing
this results in various health
hazards like mottling of teeth,
skeletal fluorisis.
The main source of sulphate in
the groundwater is presence of
gypsum as a part of evaporates
sequence present in
quaternary sediments as well
as in underlying basement
rocks.
The concentration of sulphate
is likely to react with human
organs if the value exceeds the
maximum allowable limit of 400
mg/l and causes a laxative
effect on human system with
the excess magnesium in
groundwater.
21. CHLORIDE ACIDITY
Chloride-bearing rock
minerals such as
chlorapatite, which are very
minor constituents of
igneous and metamorphic
rocks, and liquid inclusions
When the excess chloride
concentration is present with
excess sodium
concentration it may cause
congestive heart failure
Acidity is a measure of the
capacity water to neutralize
bases. Acidity is the sum of all
titrable acid present in the
water sample.
Strong mineral acids and weak
mineral acids such as carbonic
acid, acetic acid present in the
water sample contributes to
acidity of water. Usually
dissolved carbon-dioxide is the
major acidic component
present in the unpolluted
surface water.
22.
23. SL.NO AREA NAME LATITUDE LONGITUDE
1 S.B.H COLONY 16°11'18.49"N 77°20'55.33"E
2 ARALIBENCHI VILLAGE 16°9'7.24"N 77°19'28.47"E
3 STATION AREA 16°11'20.83"N 77°20'32.3"E
4 NIJALINGAPPA COLONY 16°12'8.72"N 77°20’27.46”E
5 RAMPUR VILLAGE 16°11'35.92"N 77°19'47.75"E
6 ASKIHAL VILLAGE 16°12'22.58"N 77°19'28.35"E
7 DADDY COLONY 16°12'40.2"N 77°20'30.62"E
8 YERMARAS CAMP 16°15'7.47"N 77°21'56.08"E
9 GHALIB NAGAR 16°12'14.07"N 77°20'47.52"E
10 AZAD NAGAR 16°11'47.89"N 77°20'40.65"E
11 ZAHEERABAD 16°11'50.15"N 77°21'30.87"E
27. HYDROGEN ION CONCENTRATION:
It is clearly observed from the graph that the pH of all the samples
are well within the limits of 6.5-8.5 as prescribed by Indian
standards.
6.5
7
7.5
8
8.5
1 2 3 4 5 6 7 8 9 101112131415161718192021
Values
Samples
pH
Value
28. This graph shows that 10 samples have a turbidity of
zero value when compared to standard range of 1-5.
0
0.5
1
1.5
2
2.5
3
3.5
1 2 3 4 5 6 7 8 9 10 11 12 13 14 15 16 17 18 19 20 21
Values
Samples
Turbidity
Value
29. The conductivity of all the samples are good enough as
inferred from the standards for ion exchange
1.57
1.575
1.58
1.585
1.59
1.595
1.6
1.605
1.61
1 2 3 4 5 6 7 8 9 101112131415161718192021
Values
Samples
Electrical Conductivity
Value
30. The graph shows that all the samples have TDS within
the limits and the maximum TDS is found in sample 10.
785
790
795
800
805
810
815
820
1 2 3 4 5 6 7 8 9 101112131415161718192021
Values
Samples
Total Dissolved Solids
Value
31. It is observed from the graph that hardness of sample 5
is exceeding the range by 1550 mg/l and samples
1,2,4,10,12,14,16,20 have total hardness less than the
desirable limit.
0
500
1000
1500
2000
2500
1 2 3 4 5 6 7 8 9 101112131415161718192021
Values
Samples
Total Hardness
Value
32. The graph indicates calcium hardness of all samples with
samples 14,15,16 being less than desirable limits.
0
50
100
150
200
250
1 2 3 4 5 6 7 8 9 101112131415161718192021
Values
Samples
Calcium Hardness
Value
33. We infer from the graph all the values exceed the limits
for which remedial measures need to be taken and the
maximum level of magnesium is observed in sample 5.
0
500
1000
1500
2000
2500
1 2 3 4 5 6 7 8 9 101112131415161718192021
Values
Samples
Magnesium Hardness
Value
34. We see from the graph that all the samples are well
within limits of standards with maximum alkalinity for
sample 19.
0
100
200
300
400
500
1 2 3 4 5 6 7 8 9 101112131415161718192021
values
samples
Alkalinity
Value
35. The graph shows variation of fluoride in samples where
we see 13 samples according to 2012 IS standards of
desirable 1 is less than it and sample 19 just exceeds the
permissible limit by 0.0056mg/l
0
0.5
1
1.5
2
1 2 3 4 5 6 7 8 9 101112131415161718192021
Values
Samples
Fluoride
Value
36. The graph indicates sulphates variation and 4 samples
are less than desirable value and 3 more than
permissible value.
0
100
200
300
400
500
1 2 3 4 5 6 7 8 9 101112131415161718192021
Values
Samples
Sulphate
Value
37. From the graph we observe that 4 samples have values
less than desirable limits and sample 5 has exceeding
highest value which has to be treated for a remedial
measure.
0
500
1000
1500
2000
2500
3000
1 2 3 4 5 6 7 8 9 101112131415161718192021
values
samples
Chloride
Value
38. The graph shows acidity variation in samples which are
all within the range except a small rise in 4th & 5th
samples.
0
2
4
6
8
10
12
14
1 2 3 4 5 6 7 8 9 101112131415161718192021
values
samples
Acidity
Values
43. A number of indices have been developed to summarize water
quality data in an easily expressible and easily understood format. A
water quality index is a means to summarize large amounts of water
quality data into simple terms (e.g., good) for reporting to
management and the public in a consistent manner.
WQI VALUE WATER QUALITY NO. OF WATER SAMPLES DETAILS OF SAMPLES
50 EXCELLENT 0
50-100 GOOD 4 1,14,16,21
100-200 POOR 16 2,3,4,6,7,8,9,10,11,
12,13,15,17,18,19,20
200-300 VERY POOR 0
300 WATER NOT SUITABLE
FOR DRINKING
1 5
45. From the overall survey of Raichur taluk its clear that it
is an arid area and majorly prone to scarcity of water in
the summer seasons and hence proper quality
maintenance of ground water is a necessity.
As observed from the quality analysis of various
sample points it’s clear that sample 5 the location of
which is Rampur village is completely not suitable for
drinking purpose and measures need to be taken to
avail the masses with the knowledge of the quality of it
and find remedial measures either.
The analysis even shows high amount of magnesium
in each samples as a precautionary use the hardness
removal of magnesium ions has to be implemented.
As far as our knowledge is concerned the entire
analysis is done based on the standard norms and
comparison is done based on the IS STANDARDS.
46. A provision for helping residents of
Rampur village is considerable as per
analysis is done. Major parameters
analysis in this area can be redone and
then provided with full awareness of it with
remedial measures.
A further analysis of left out areas and
villages can be done within Raichur taluk
and can be reported to KSPCB Raichur.
47. [1] P. J. Puri, M. K. N. Yenkie, S. P. Sangal, N. V. Gandhare, G.
B. Sarote and D. B. Dhanorkar - "Surface water (Lakes)
quality assessment in Nagpur city (India) based on Water
quality index (WQI)", Vol.4, No.1, 43-48 (2011).
[2] B. N. Tandel, Dr. J. Macwan and C. K. Soni - "Assessment of
Water Quality Index of Small Lake in South Gujarat Region,
India."
[3] S. Chandra, A. Singh and P. K. Tomar - "Assessment of Water
Quality Values in Porur Lake Chennai, Hussain Sagar
Hyderabad and Vihar Lake Mumbai, India", Chem Sci Trans.,
1(3), 508-515, 2012.
[4] Wu-Seng Lung, A. M. Asce - "Lake Acidification Model:
Practical tool", J. Environ. Eng.113:900-915, 1987.
[5] T. M. Heidtke, A. M. Asce and W. C. Sonzogni - "Water
Quality Management for the Great Lakes", J. Water Resour.
Plann. Manage. 112:48-63, 1986.
[6] Google resources, Google Earth Maps.