Downloaded 34 times
![Calculation of RSC and SAR value
SAR = Na+/{(Ca2++Mg2+)/2}0.5 [Na+, Ca2+, Mg2+ ion conc. in meq/l ]
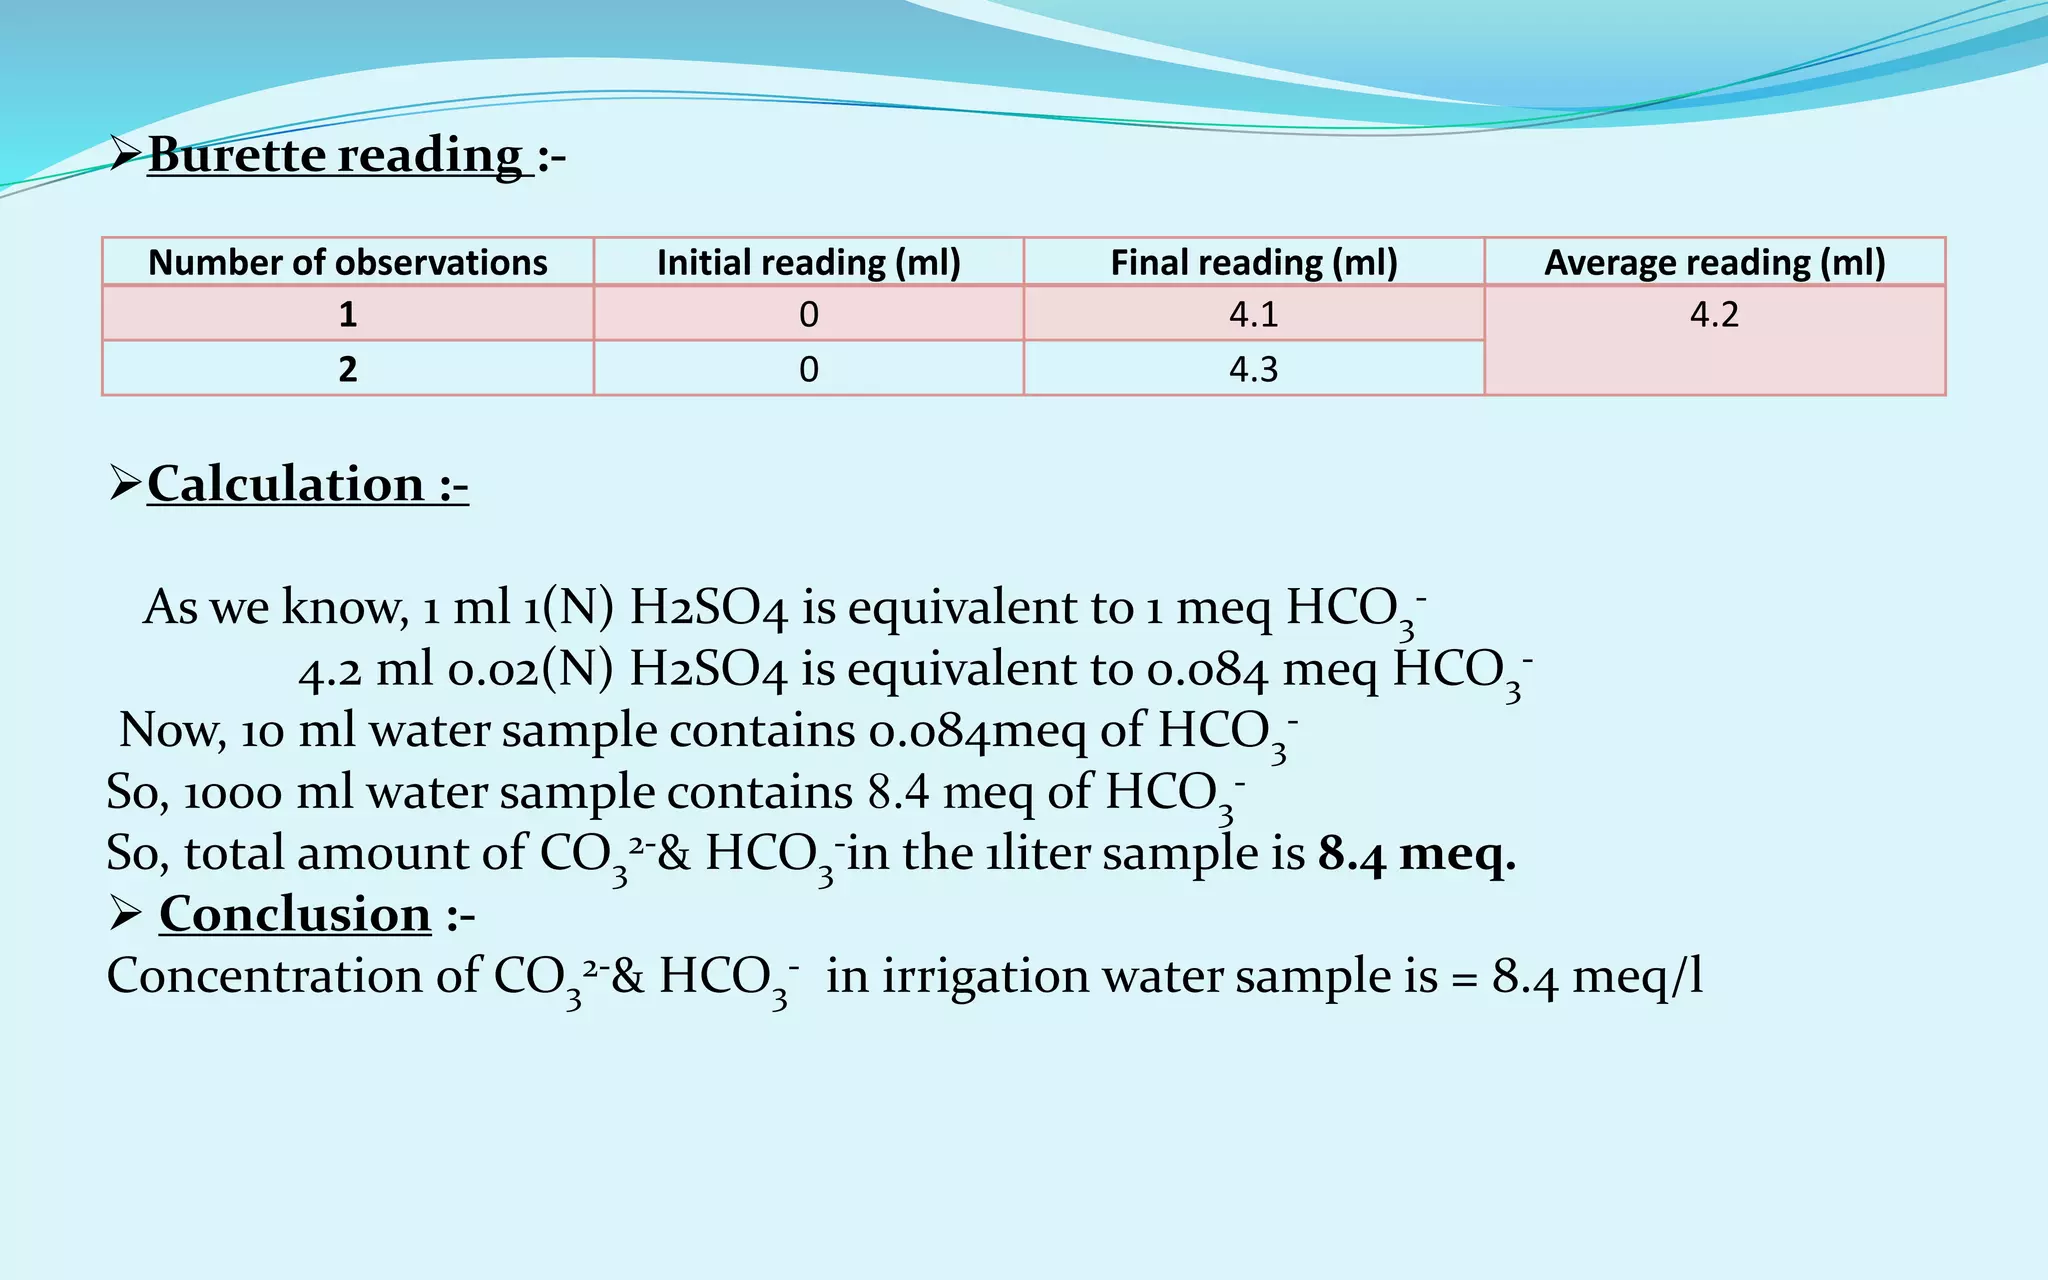
RSC (me/l) = (CO3
2-+HCO3
-) – (Ca2++Mg2+) [Ionic conc. Of CO3
2-,HCO3
-,Ca2+, Mg2+ in meq/l]
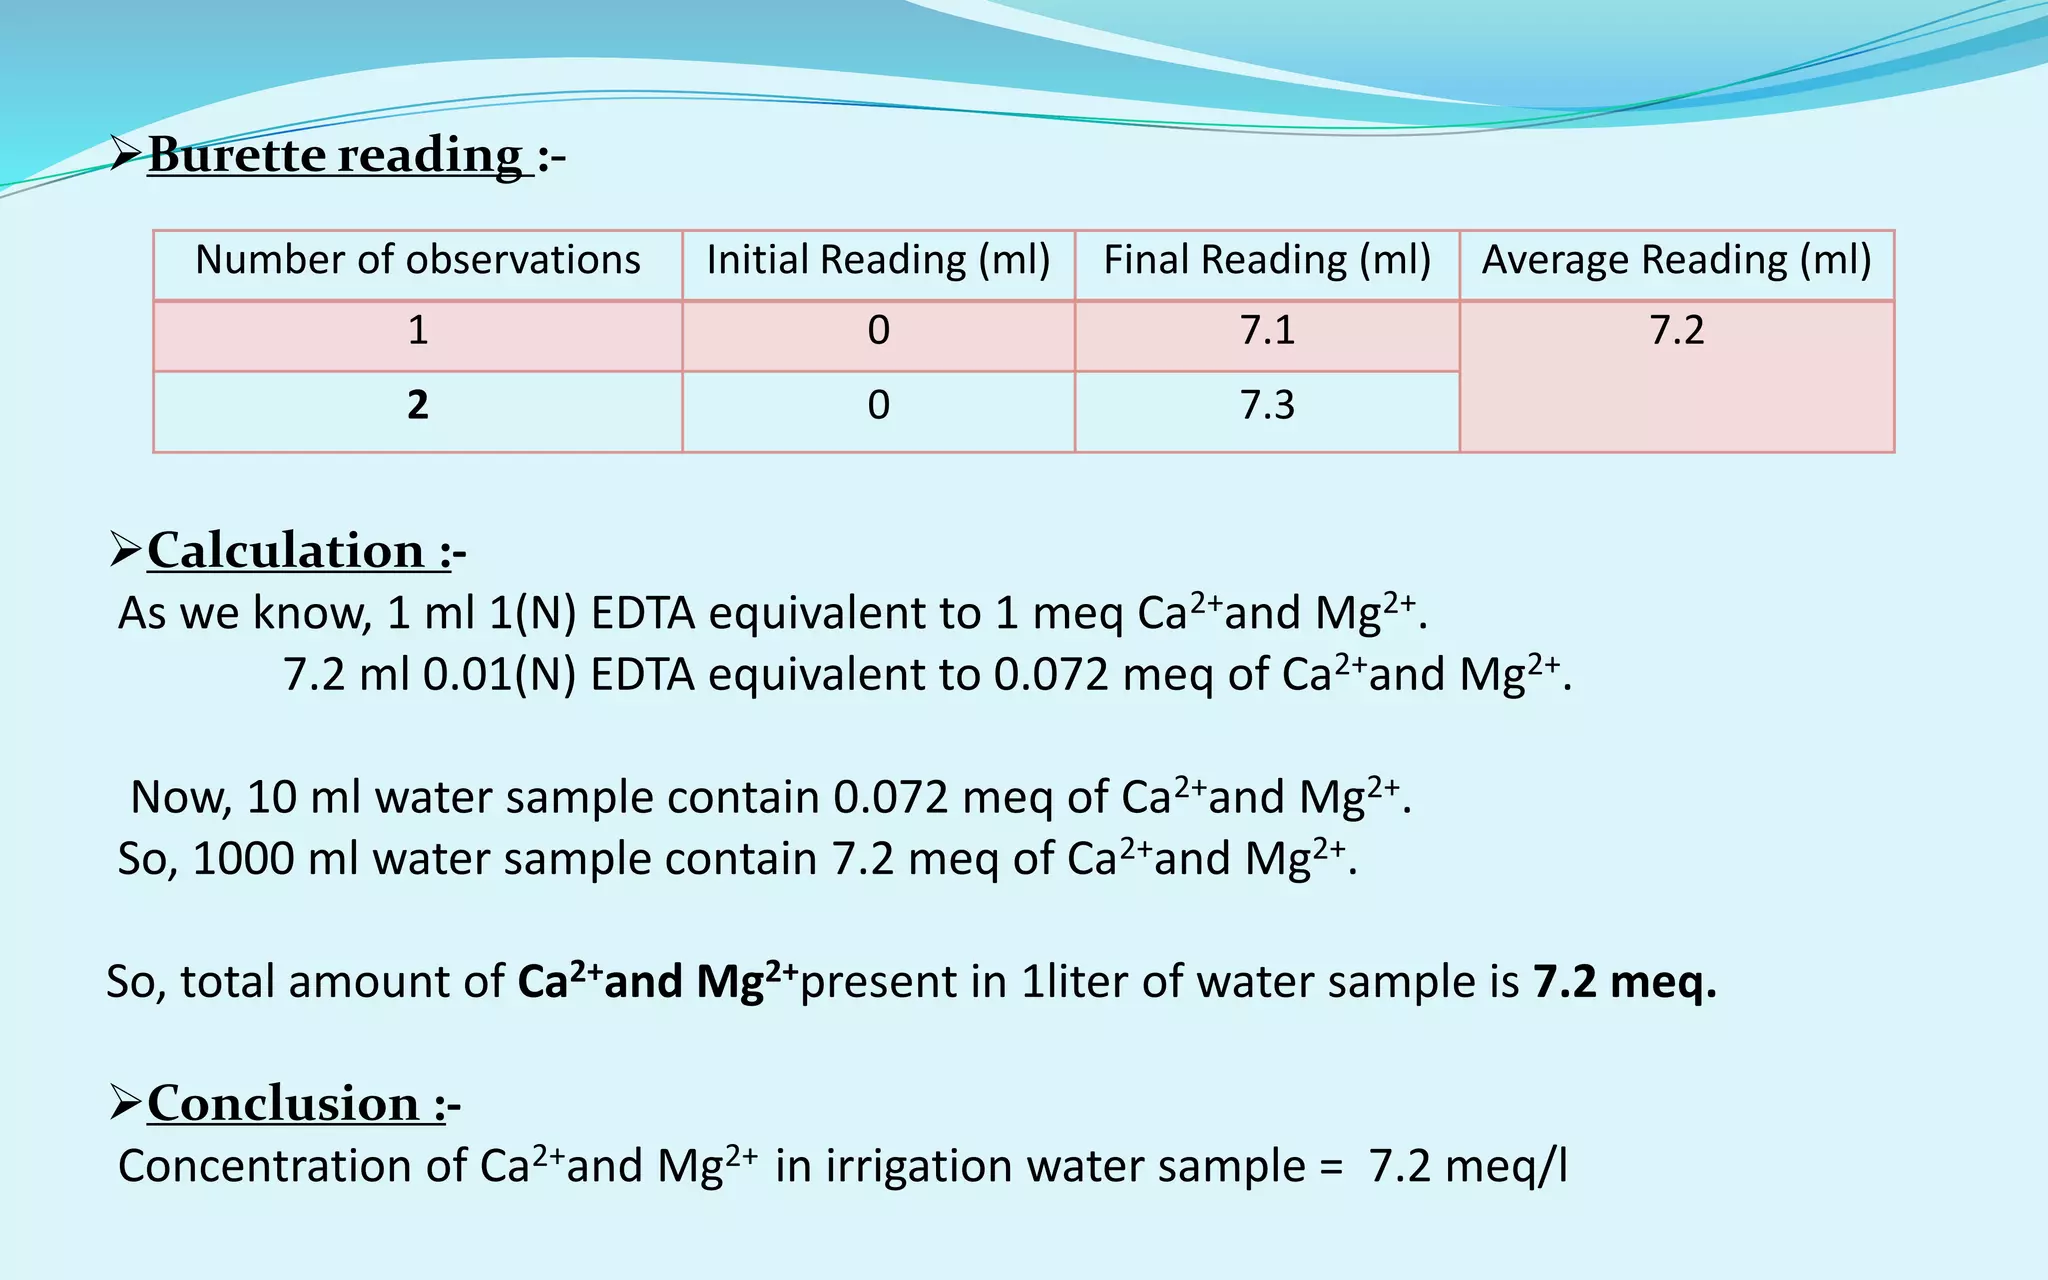
Calculation of RSC :-
As we know, RSC (me/l)= (CO3
2-+HCO3
-) – (Ca2++Mg2+)
= (8.4-7.2) = 1.2 meq/l
So, RSC (meq/l) = 1.2 meq/l
Calculation of SAR :-
As we know, SAR = Na+/{(Ca2++Mg2+)/2}0.5 [Na+, Ca2+, Mg2+ ion conc. in meq/l ]
So, SAR = 0.5/(7.2/2)0.5 = 0.264
As the SAR value is 0.264 (<10), so the water is safe for irrigation purpose.
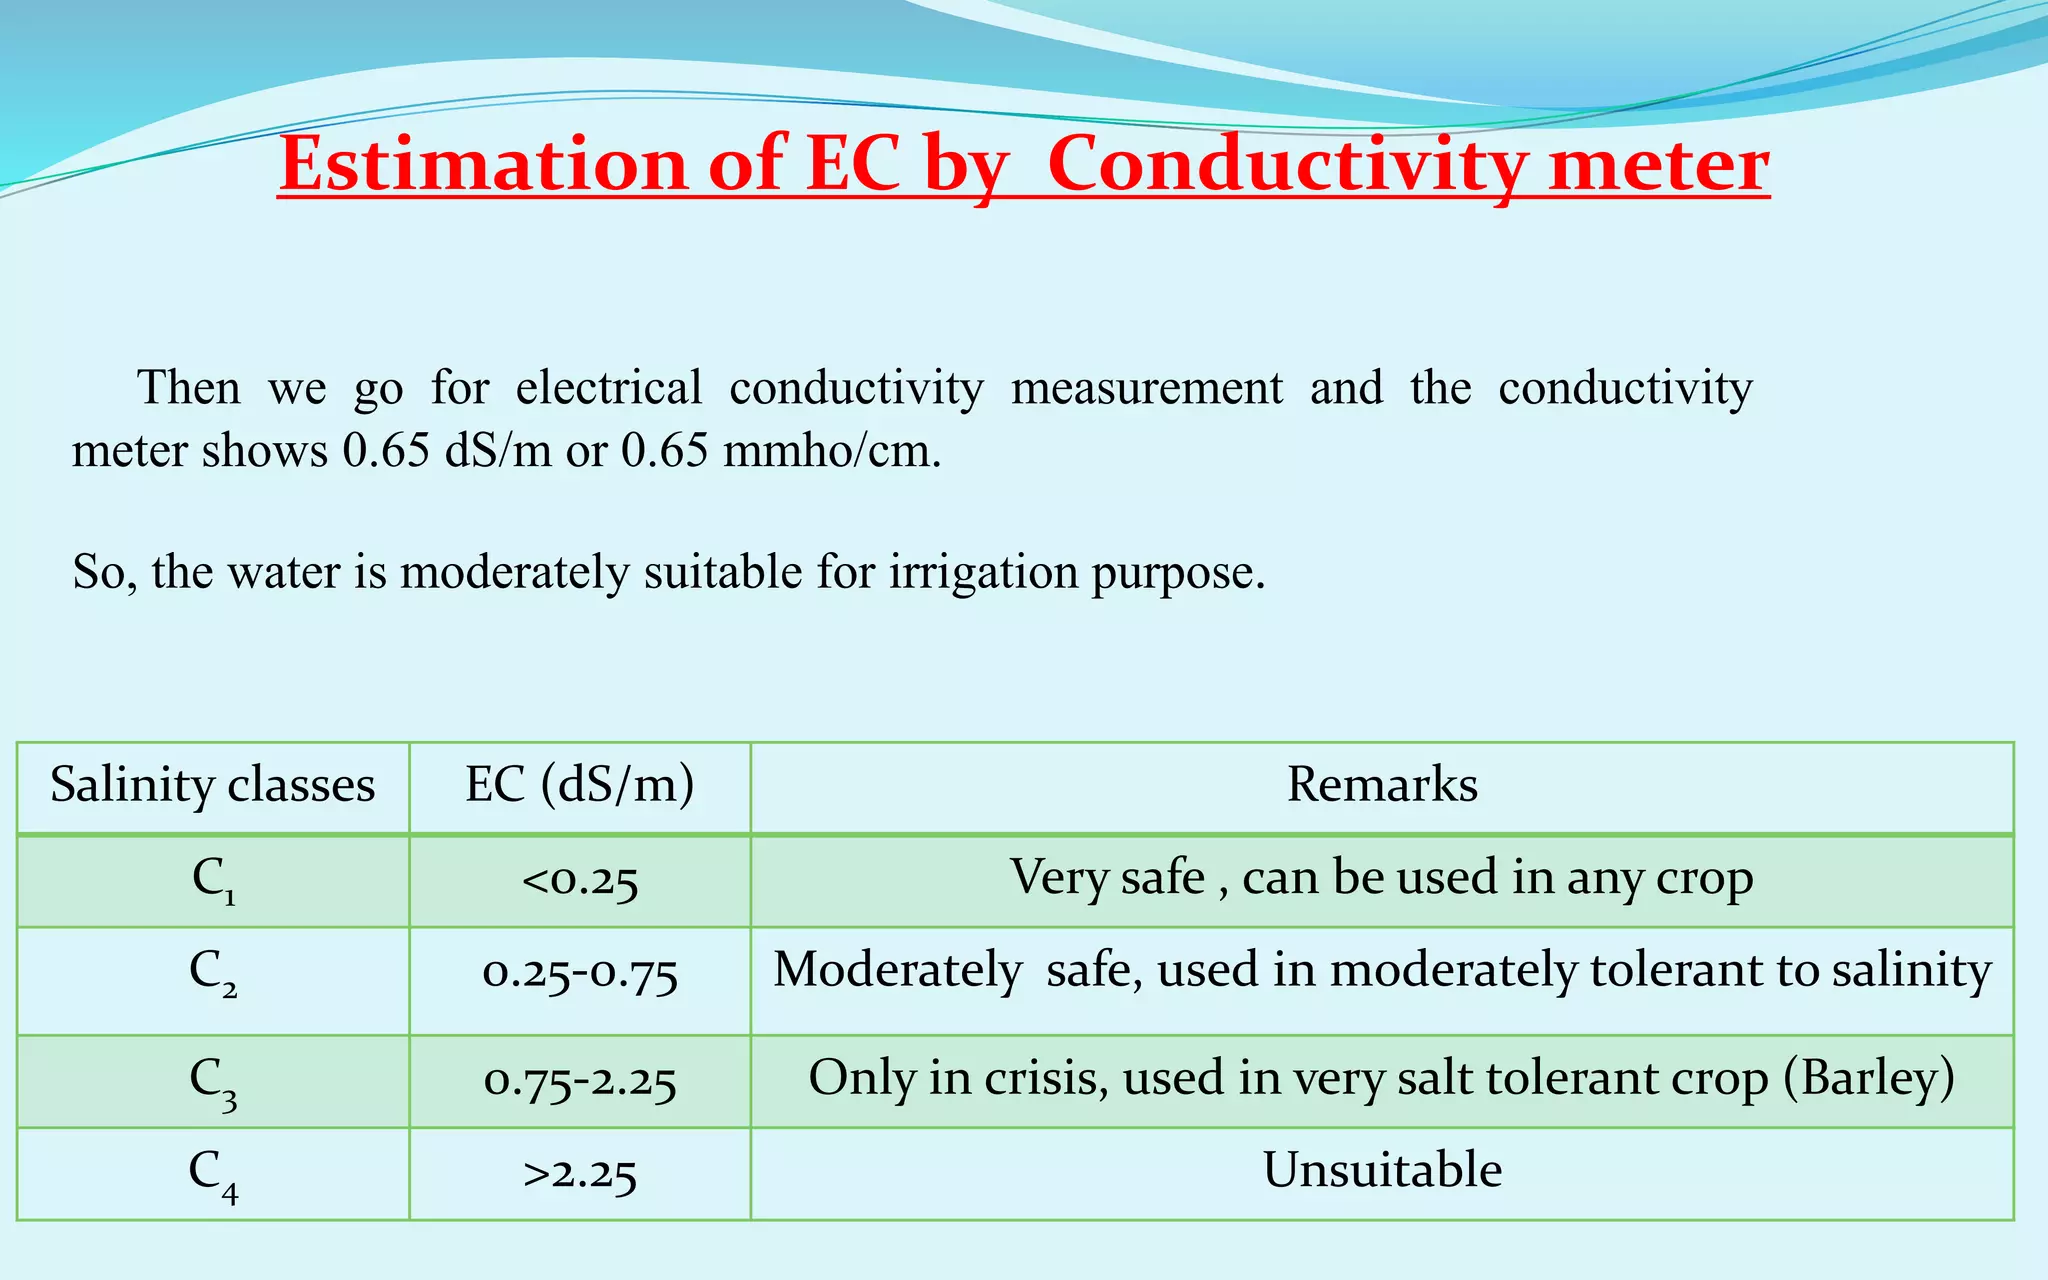
RSC value (me/l) Water quality
<1.25 Water can be used safely
1.25-2.50 Water can be used with
certain management
>2.50 Unsuitable for irrigation
purpose
SAR value Water quality
<10 Safe
10-18 Tolerant to sodicity
18-26 Risky(only in crisis)
>26 Unsafe](https://image.slidesharecdn.com/soilwateranalysisppt-0103-190708053538/75/Soil-Water-Analysis-ppt-01-03-29-2048.jpg)
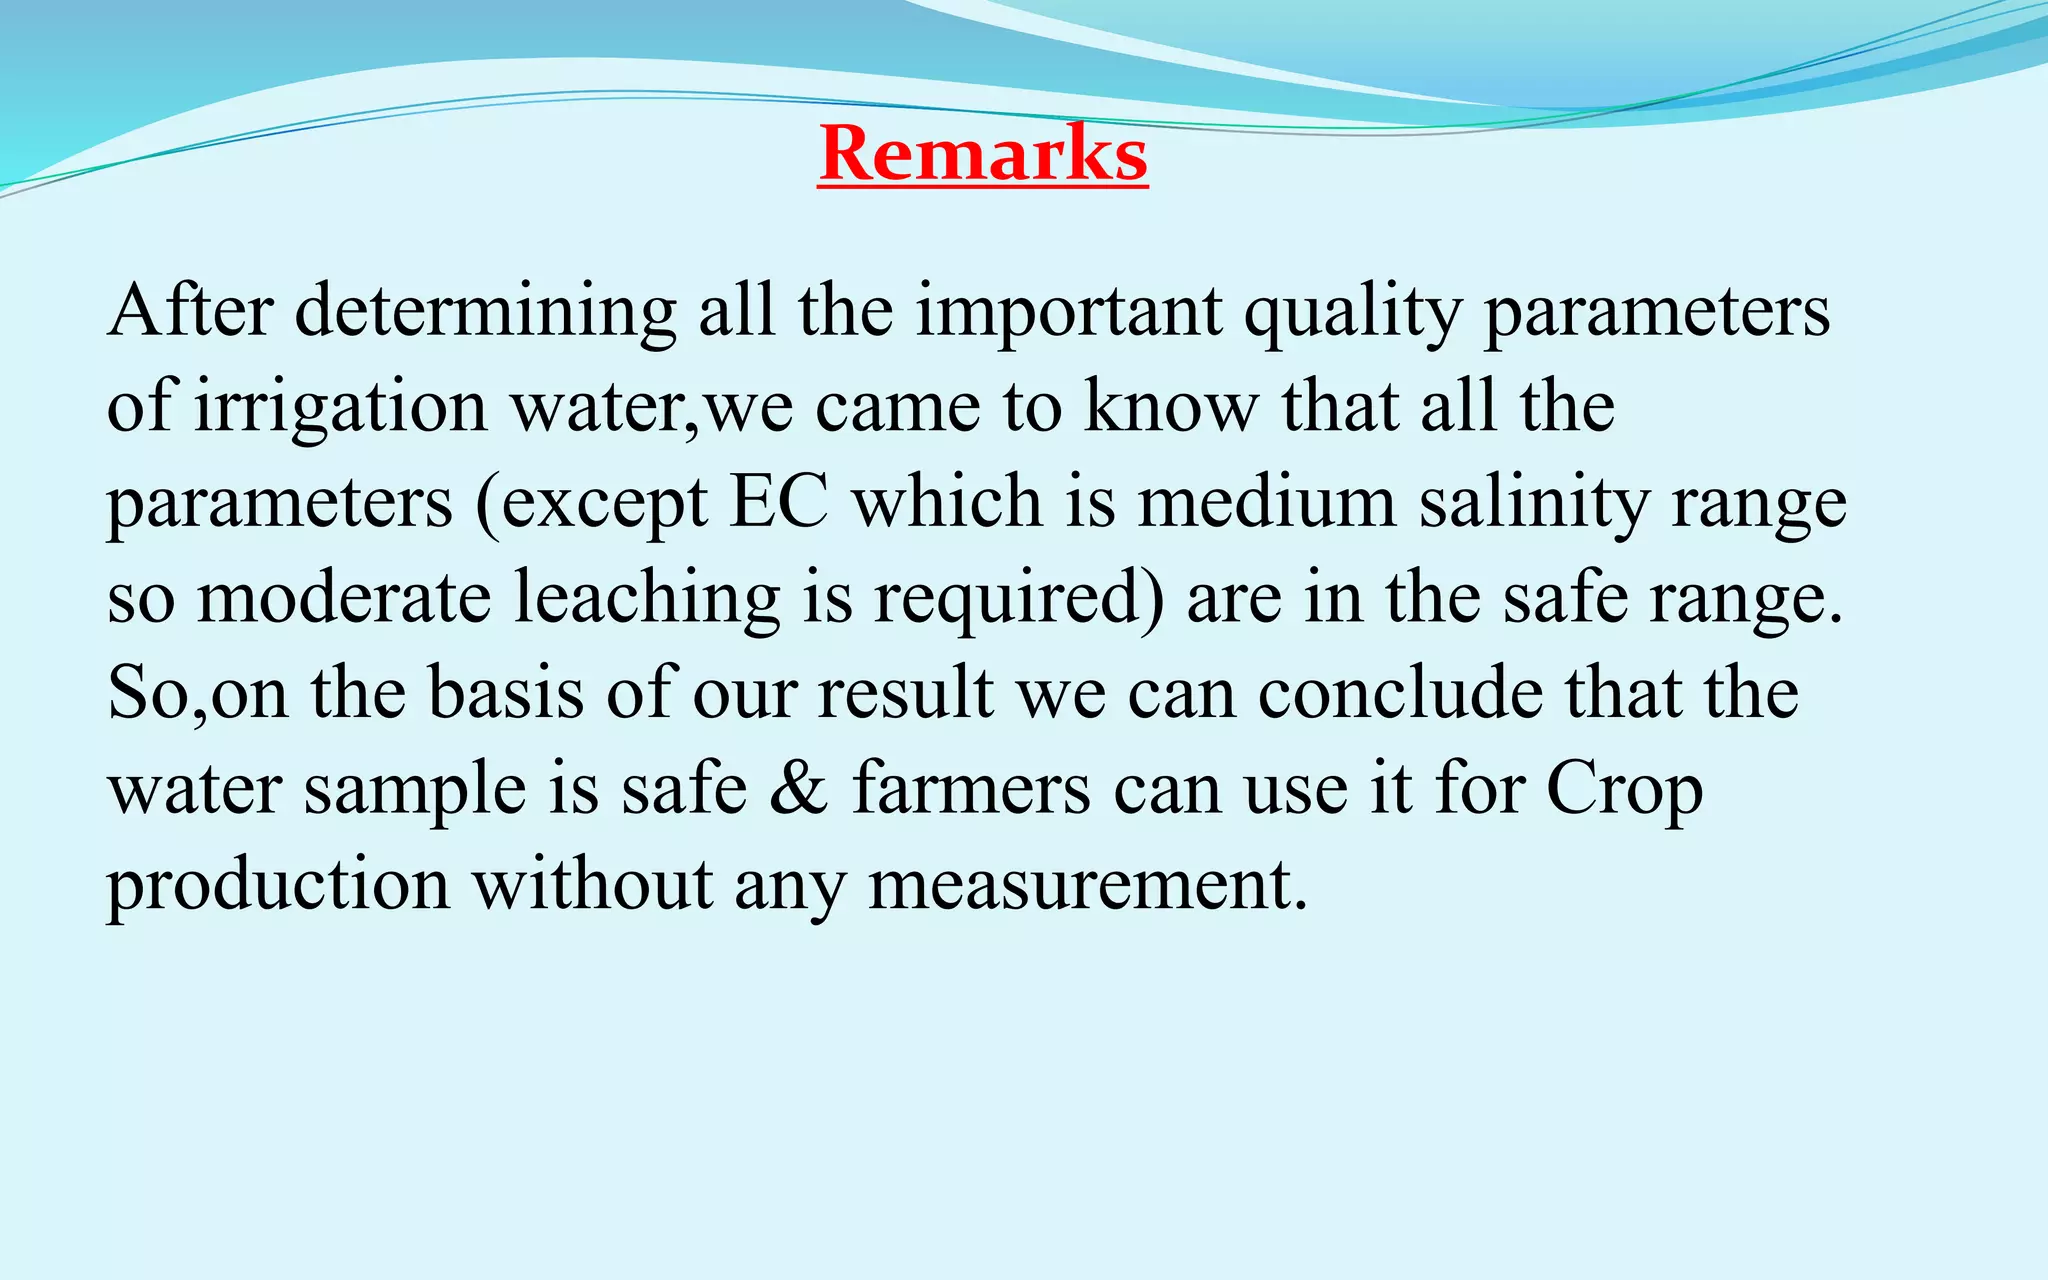

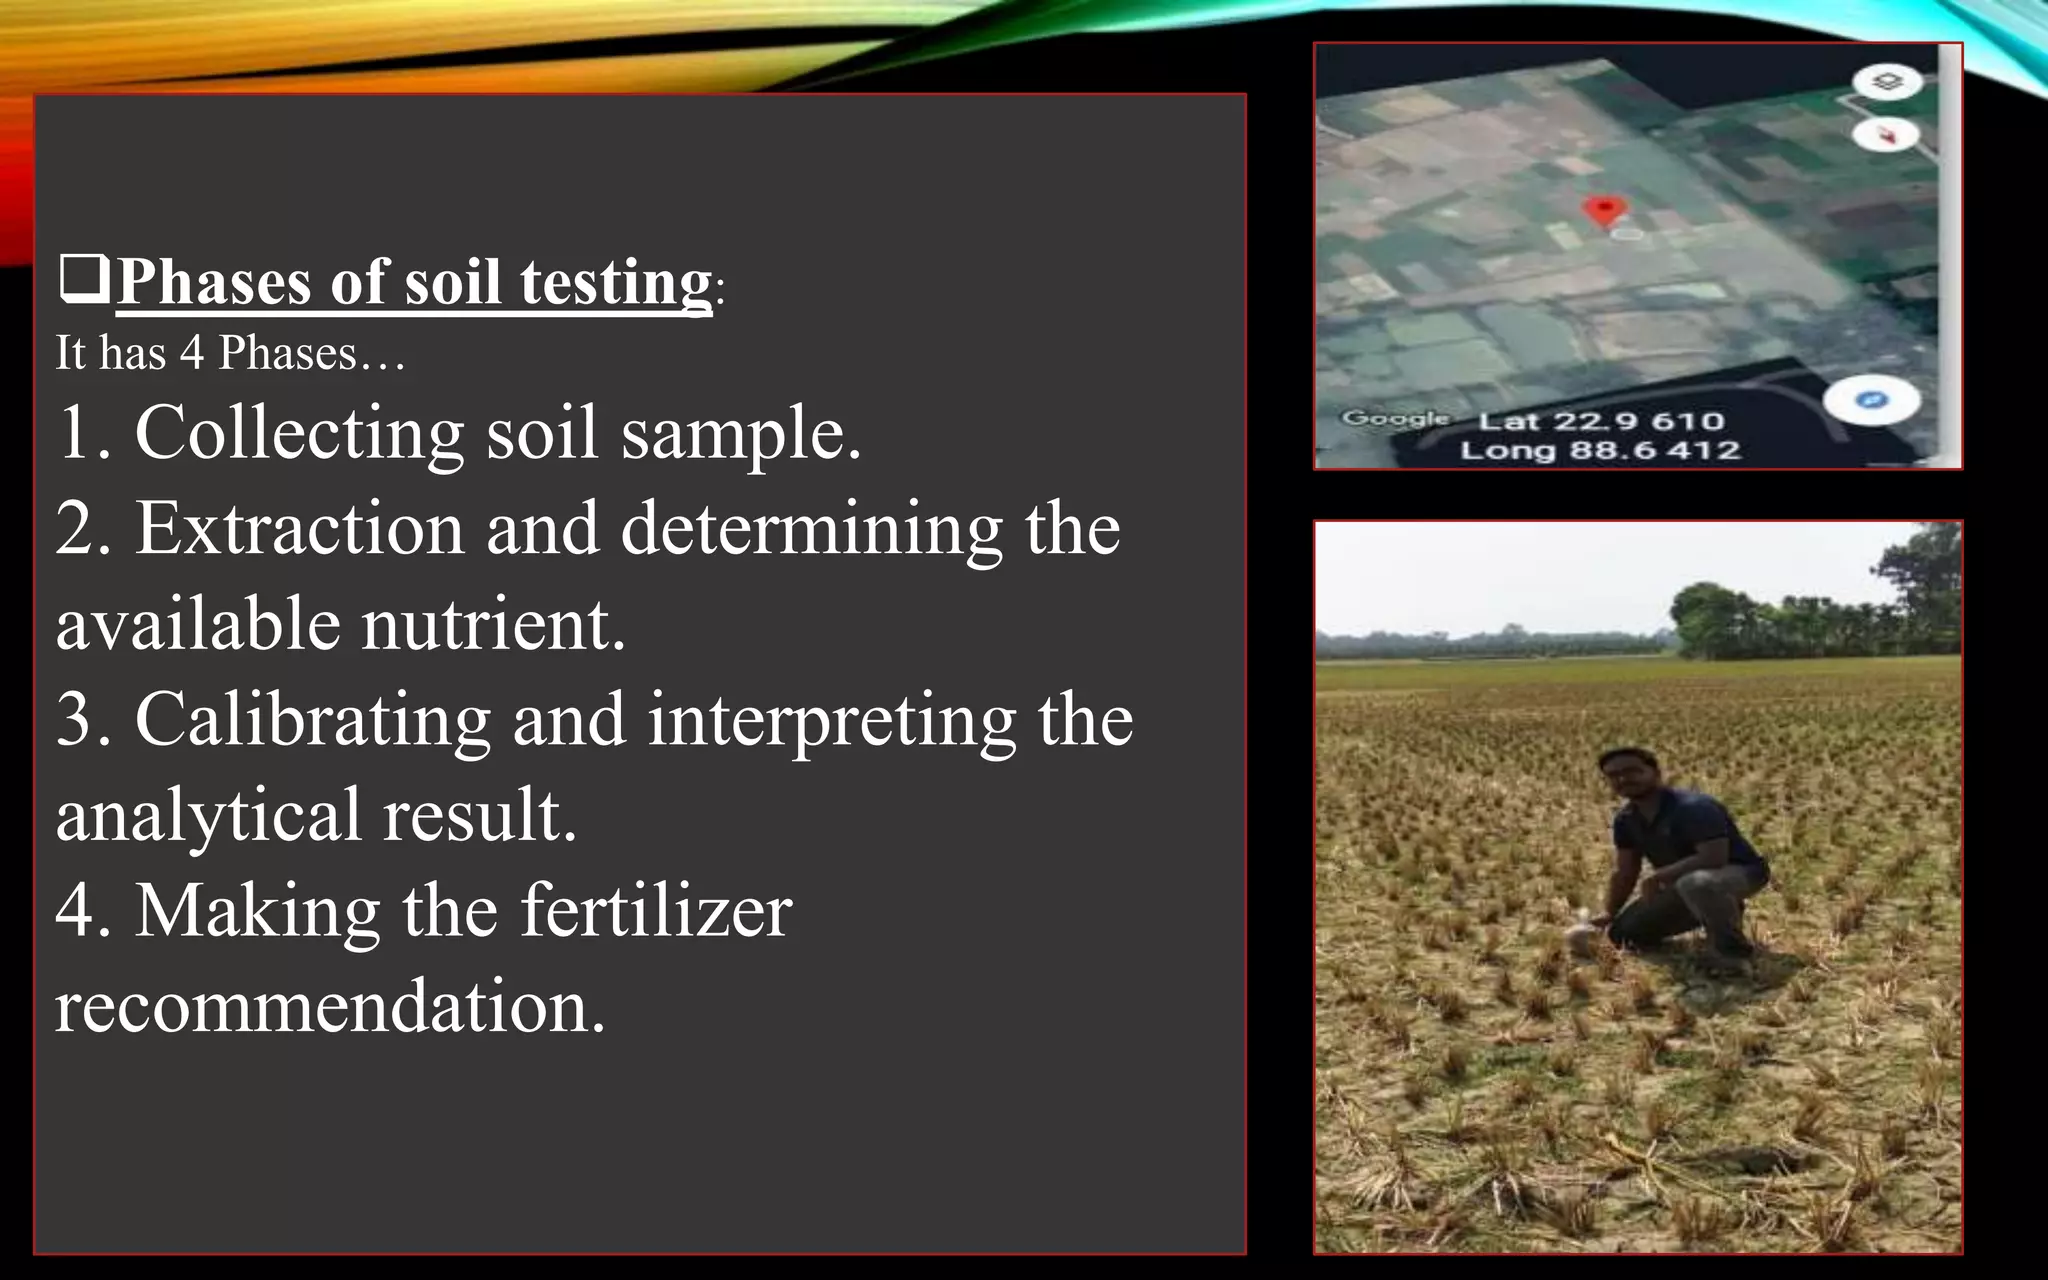
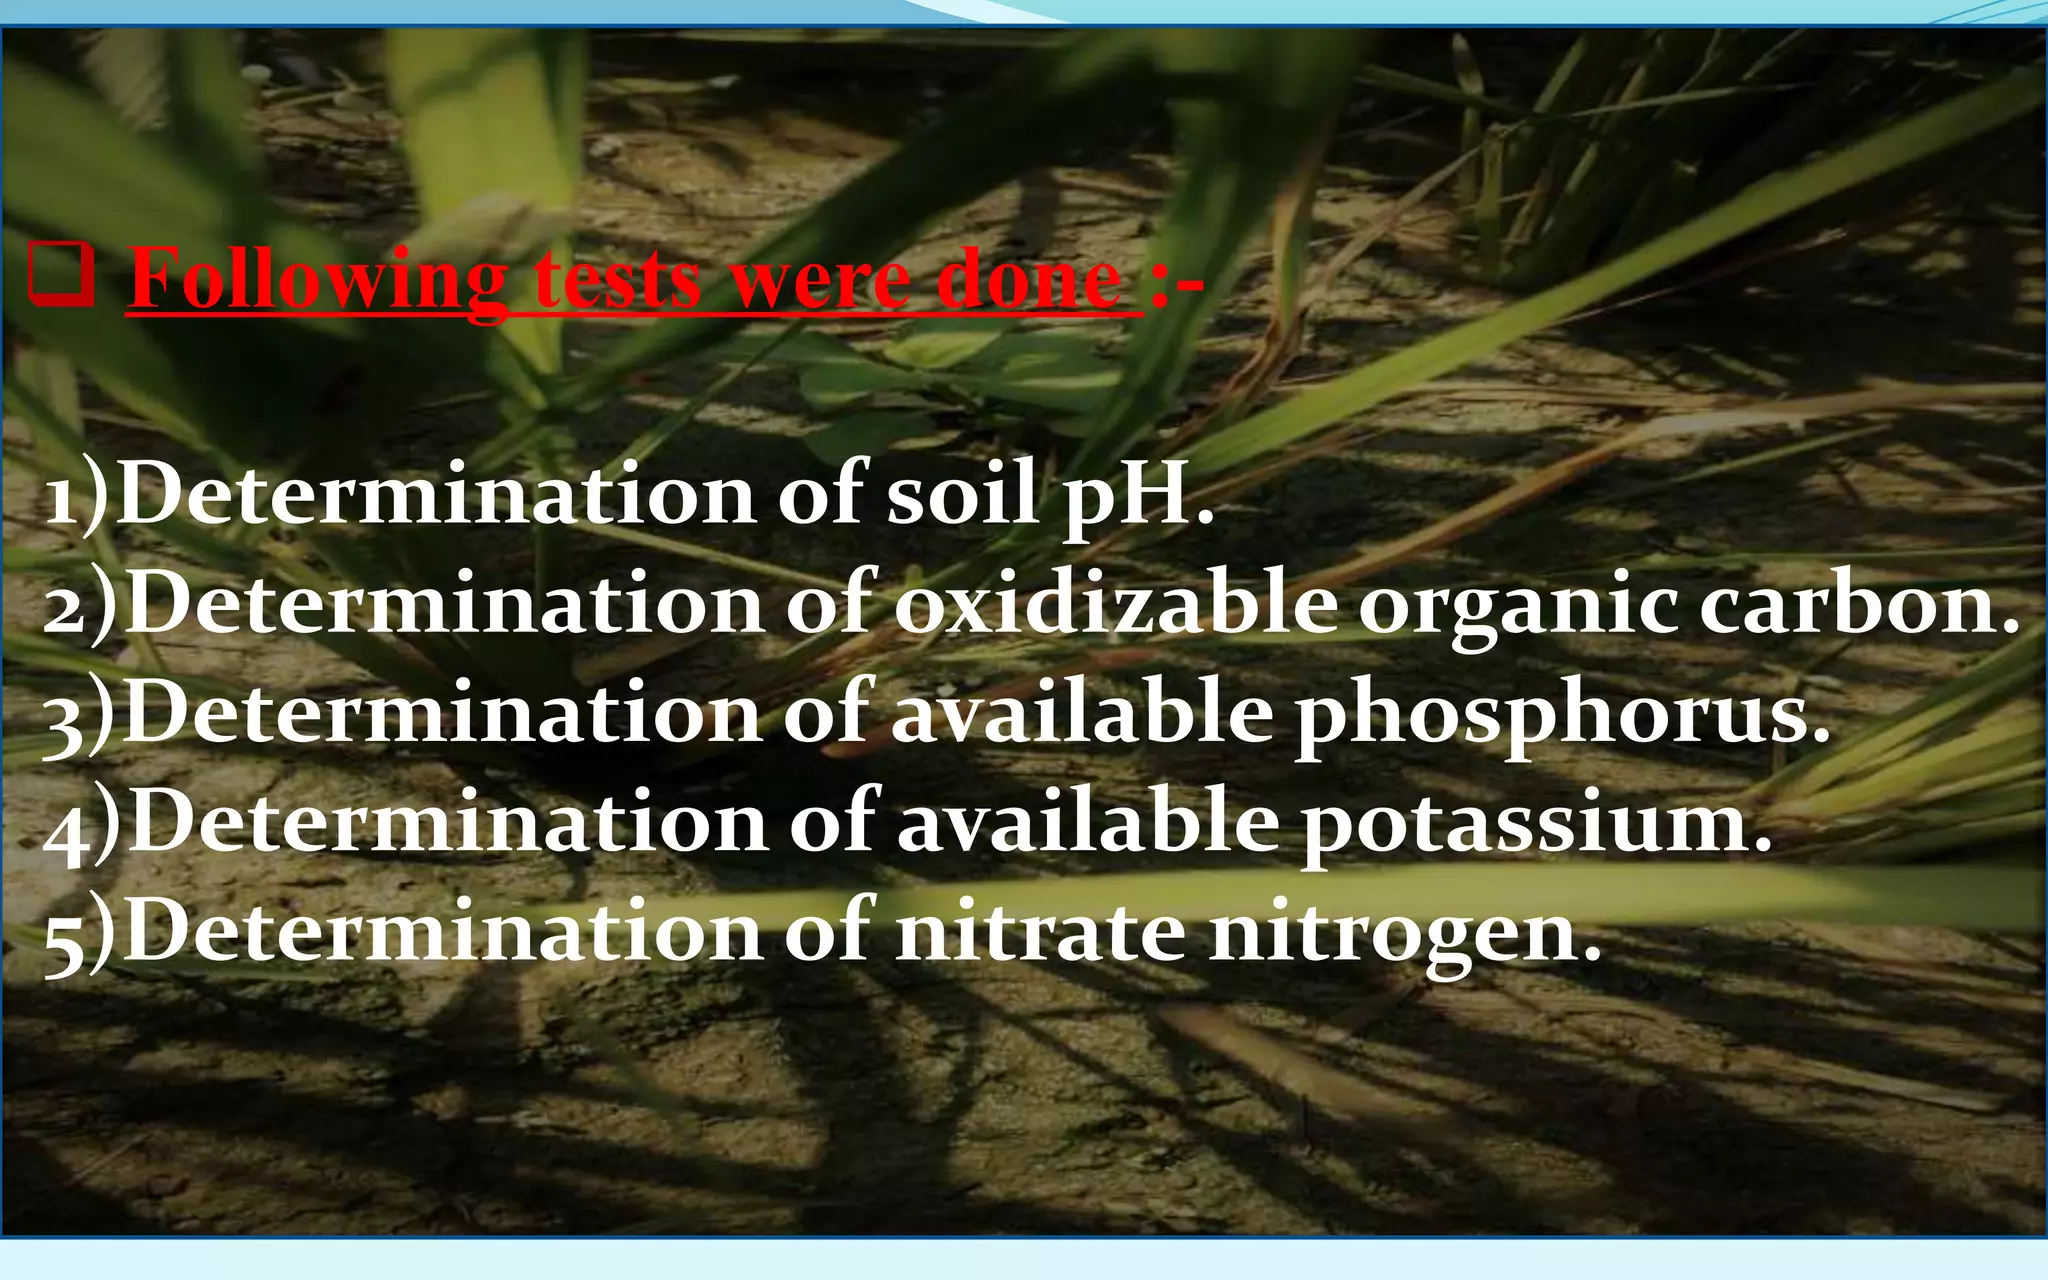
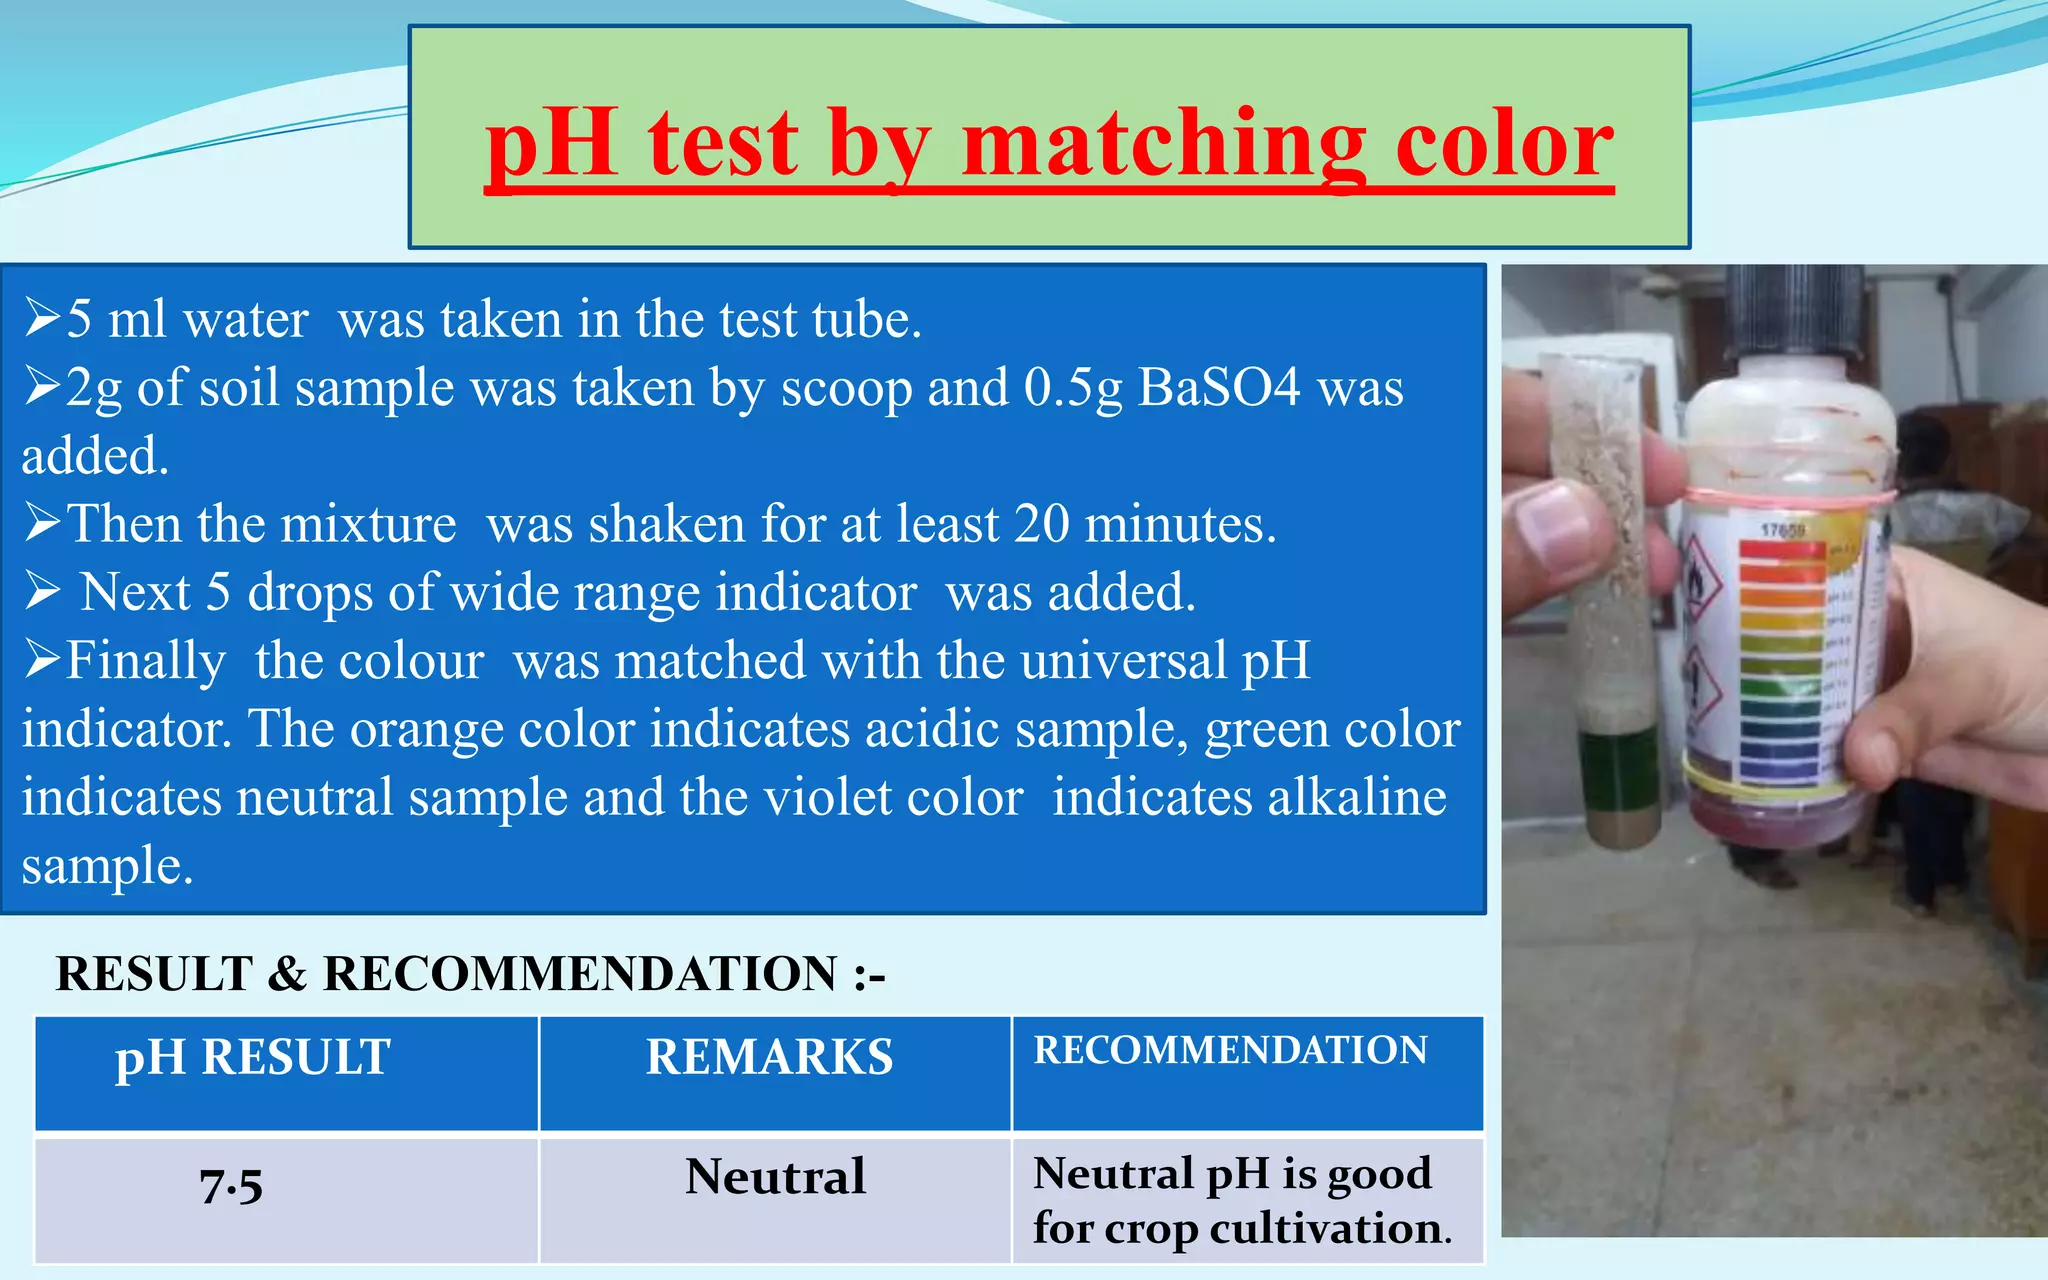
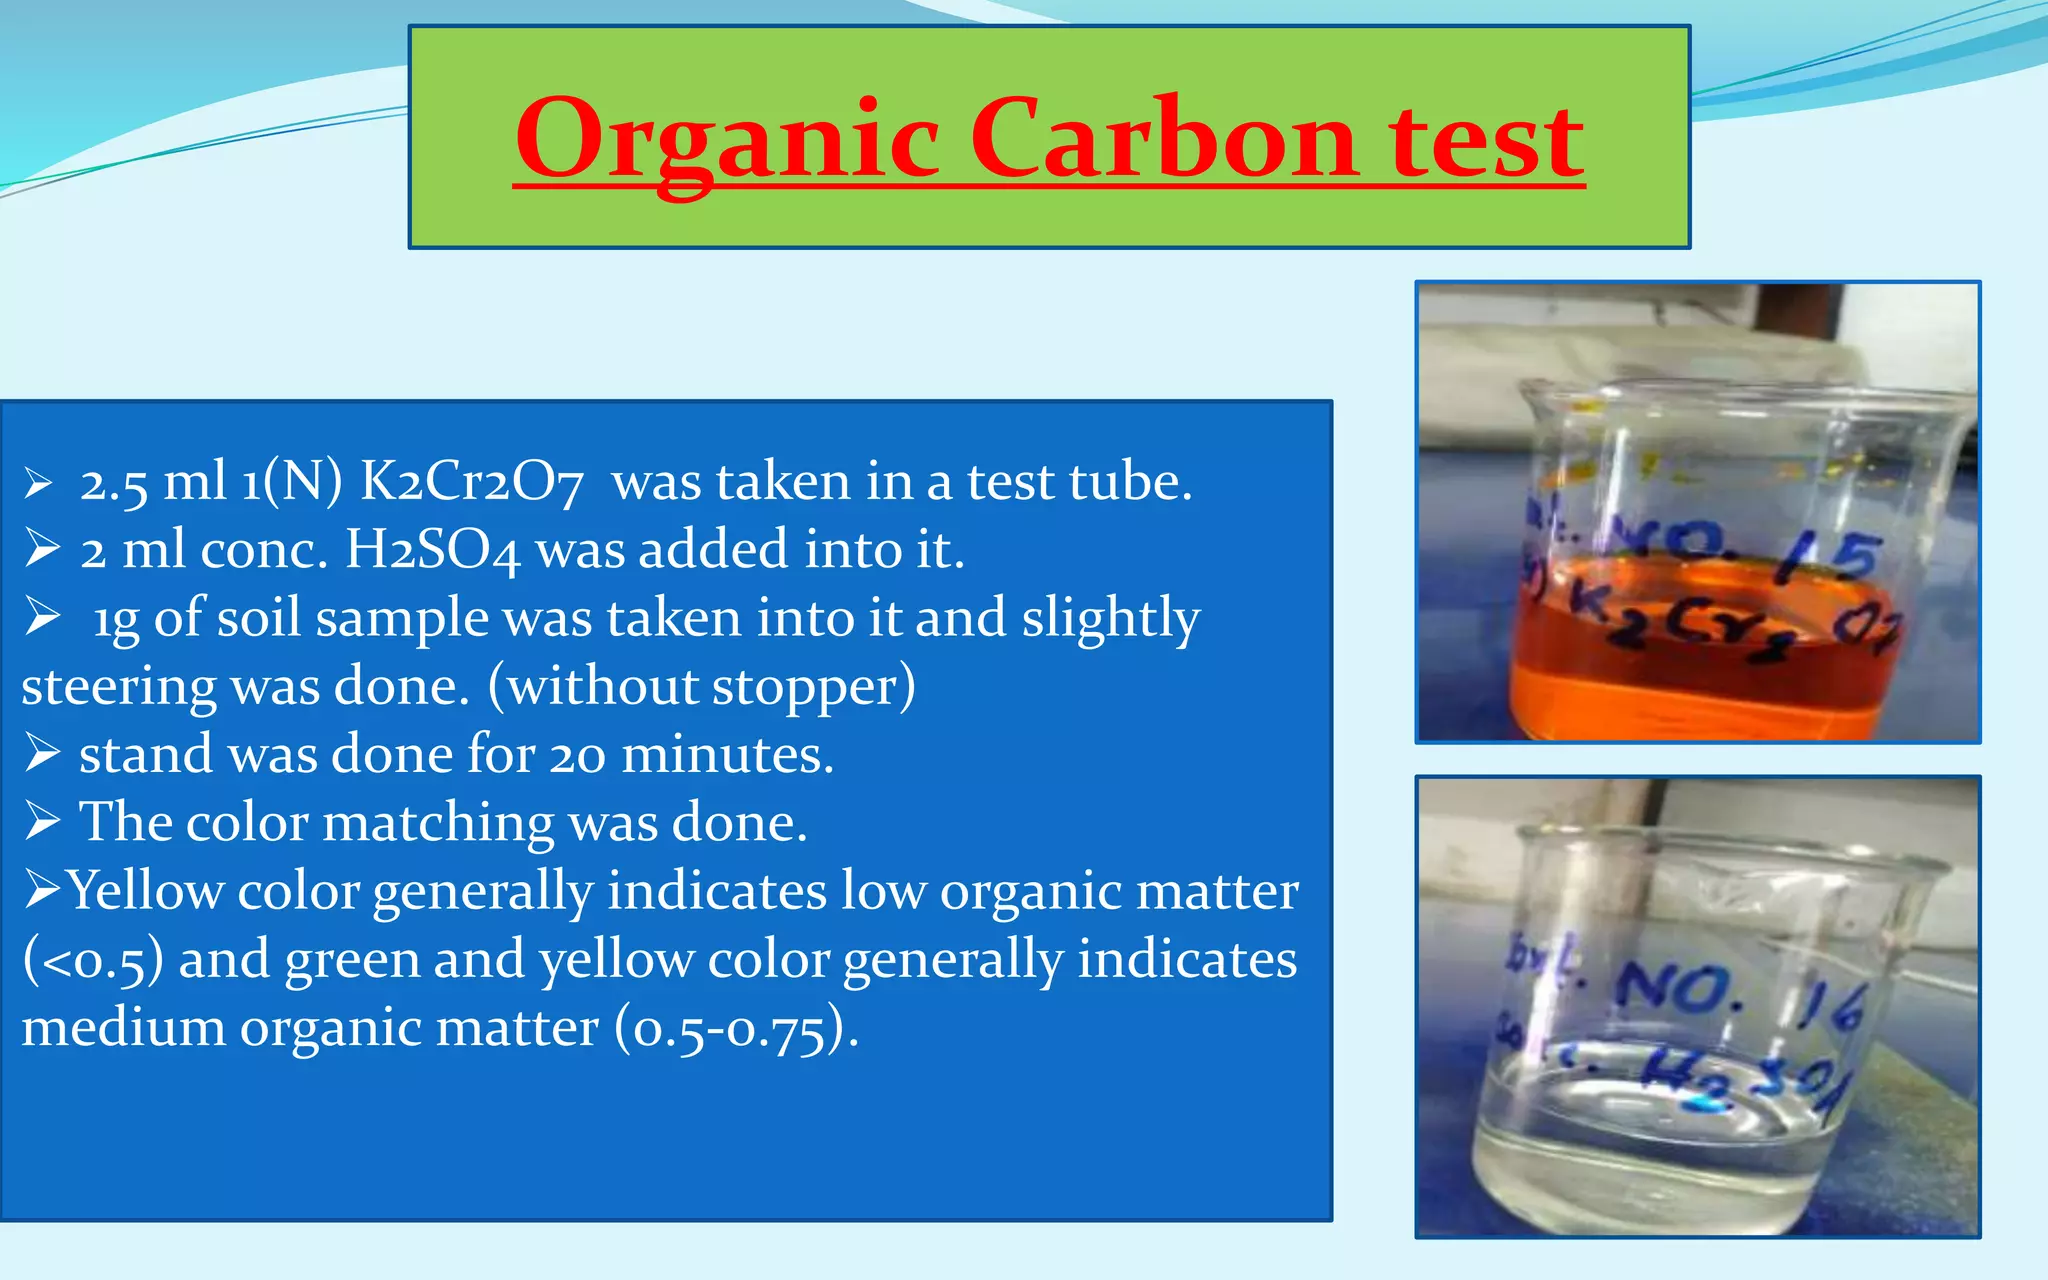
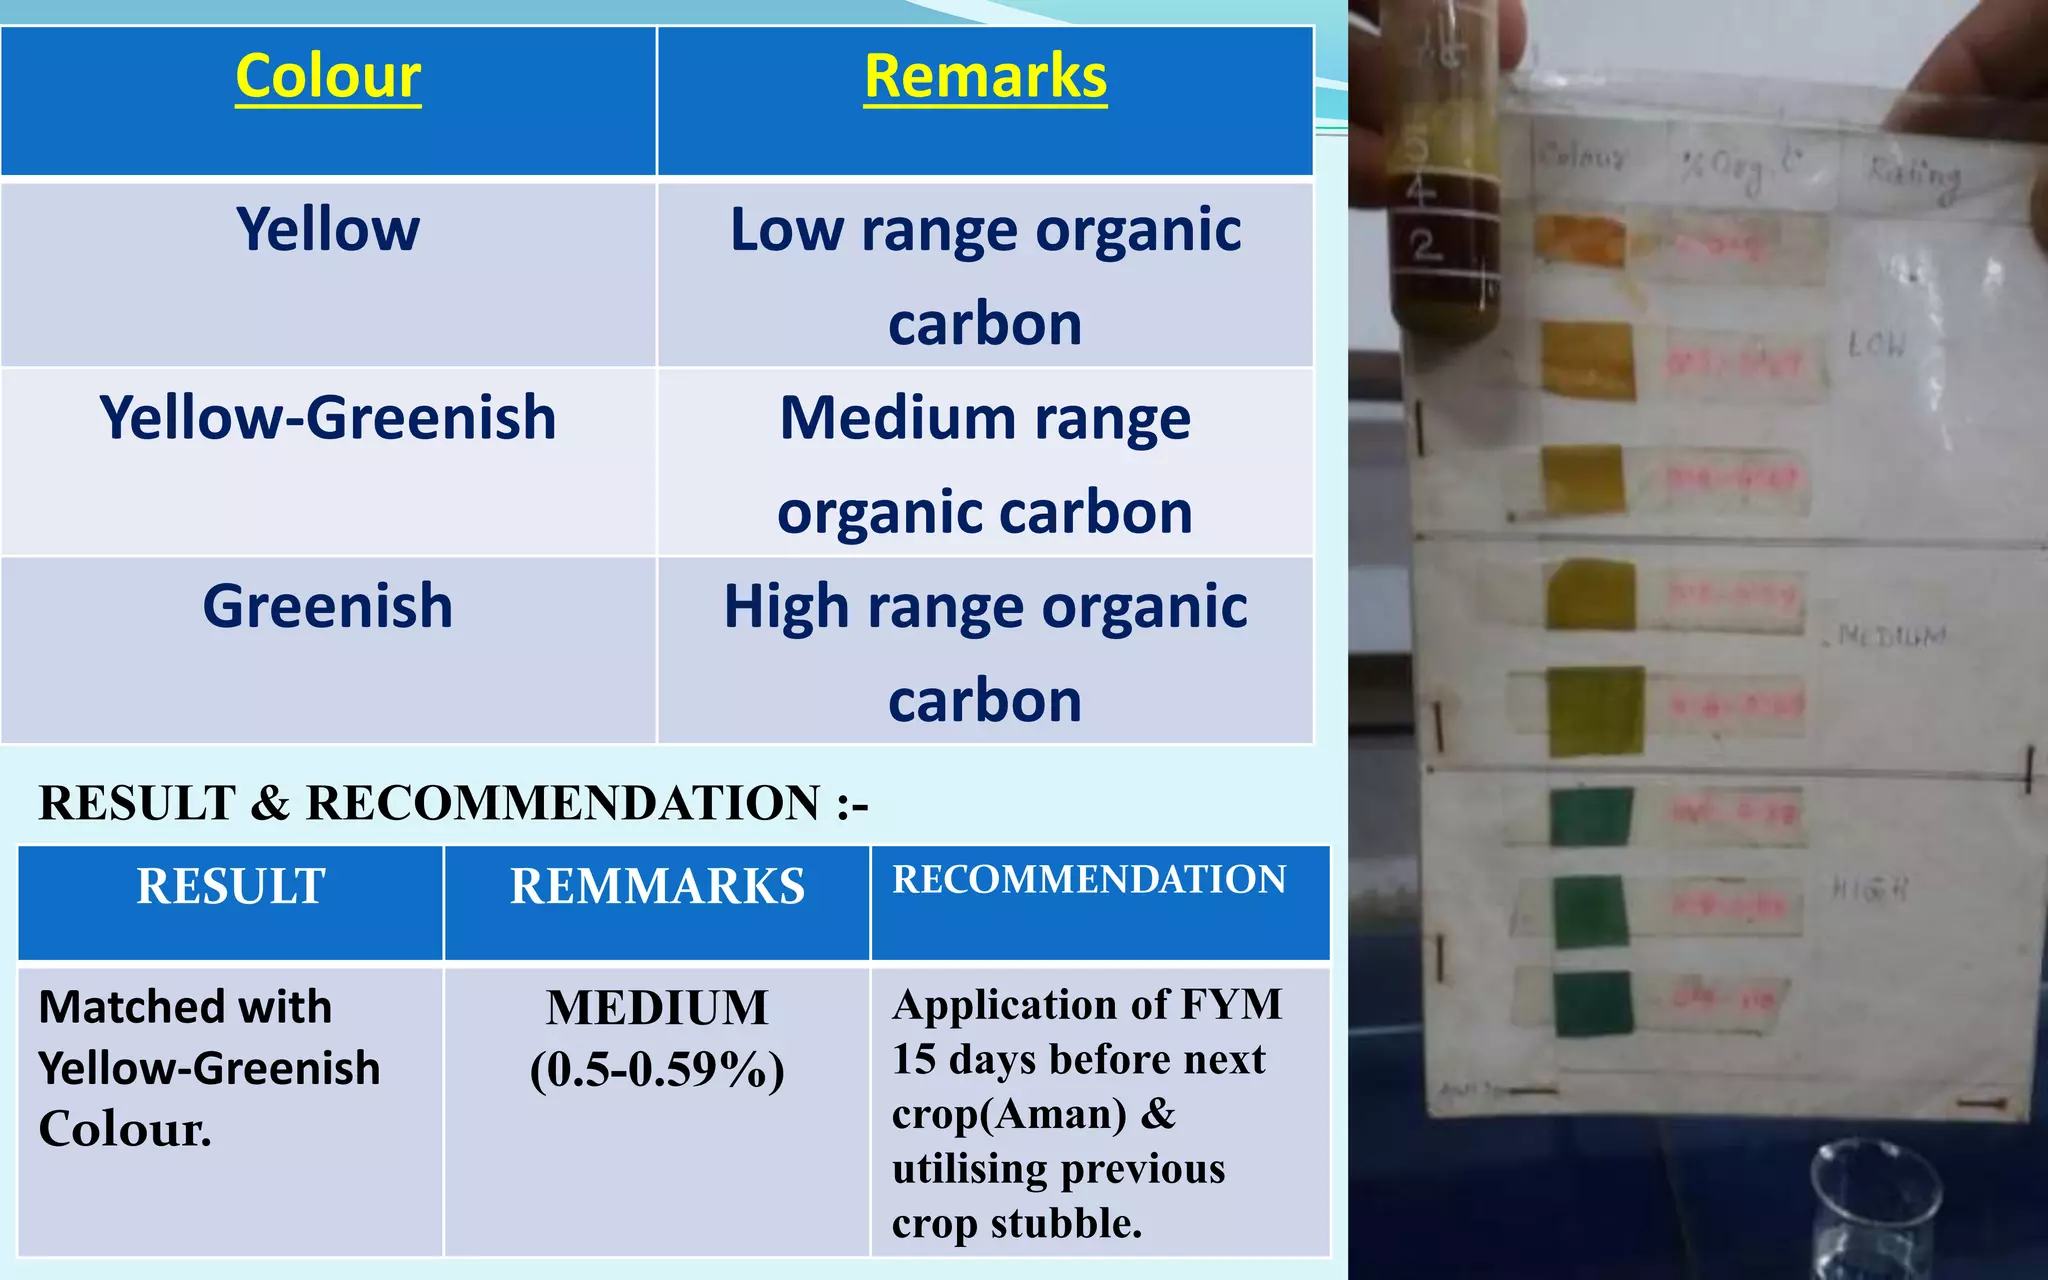
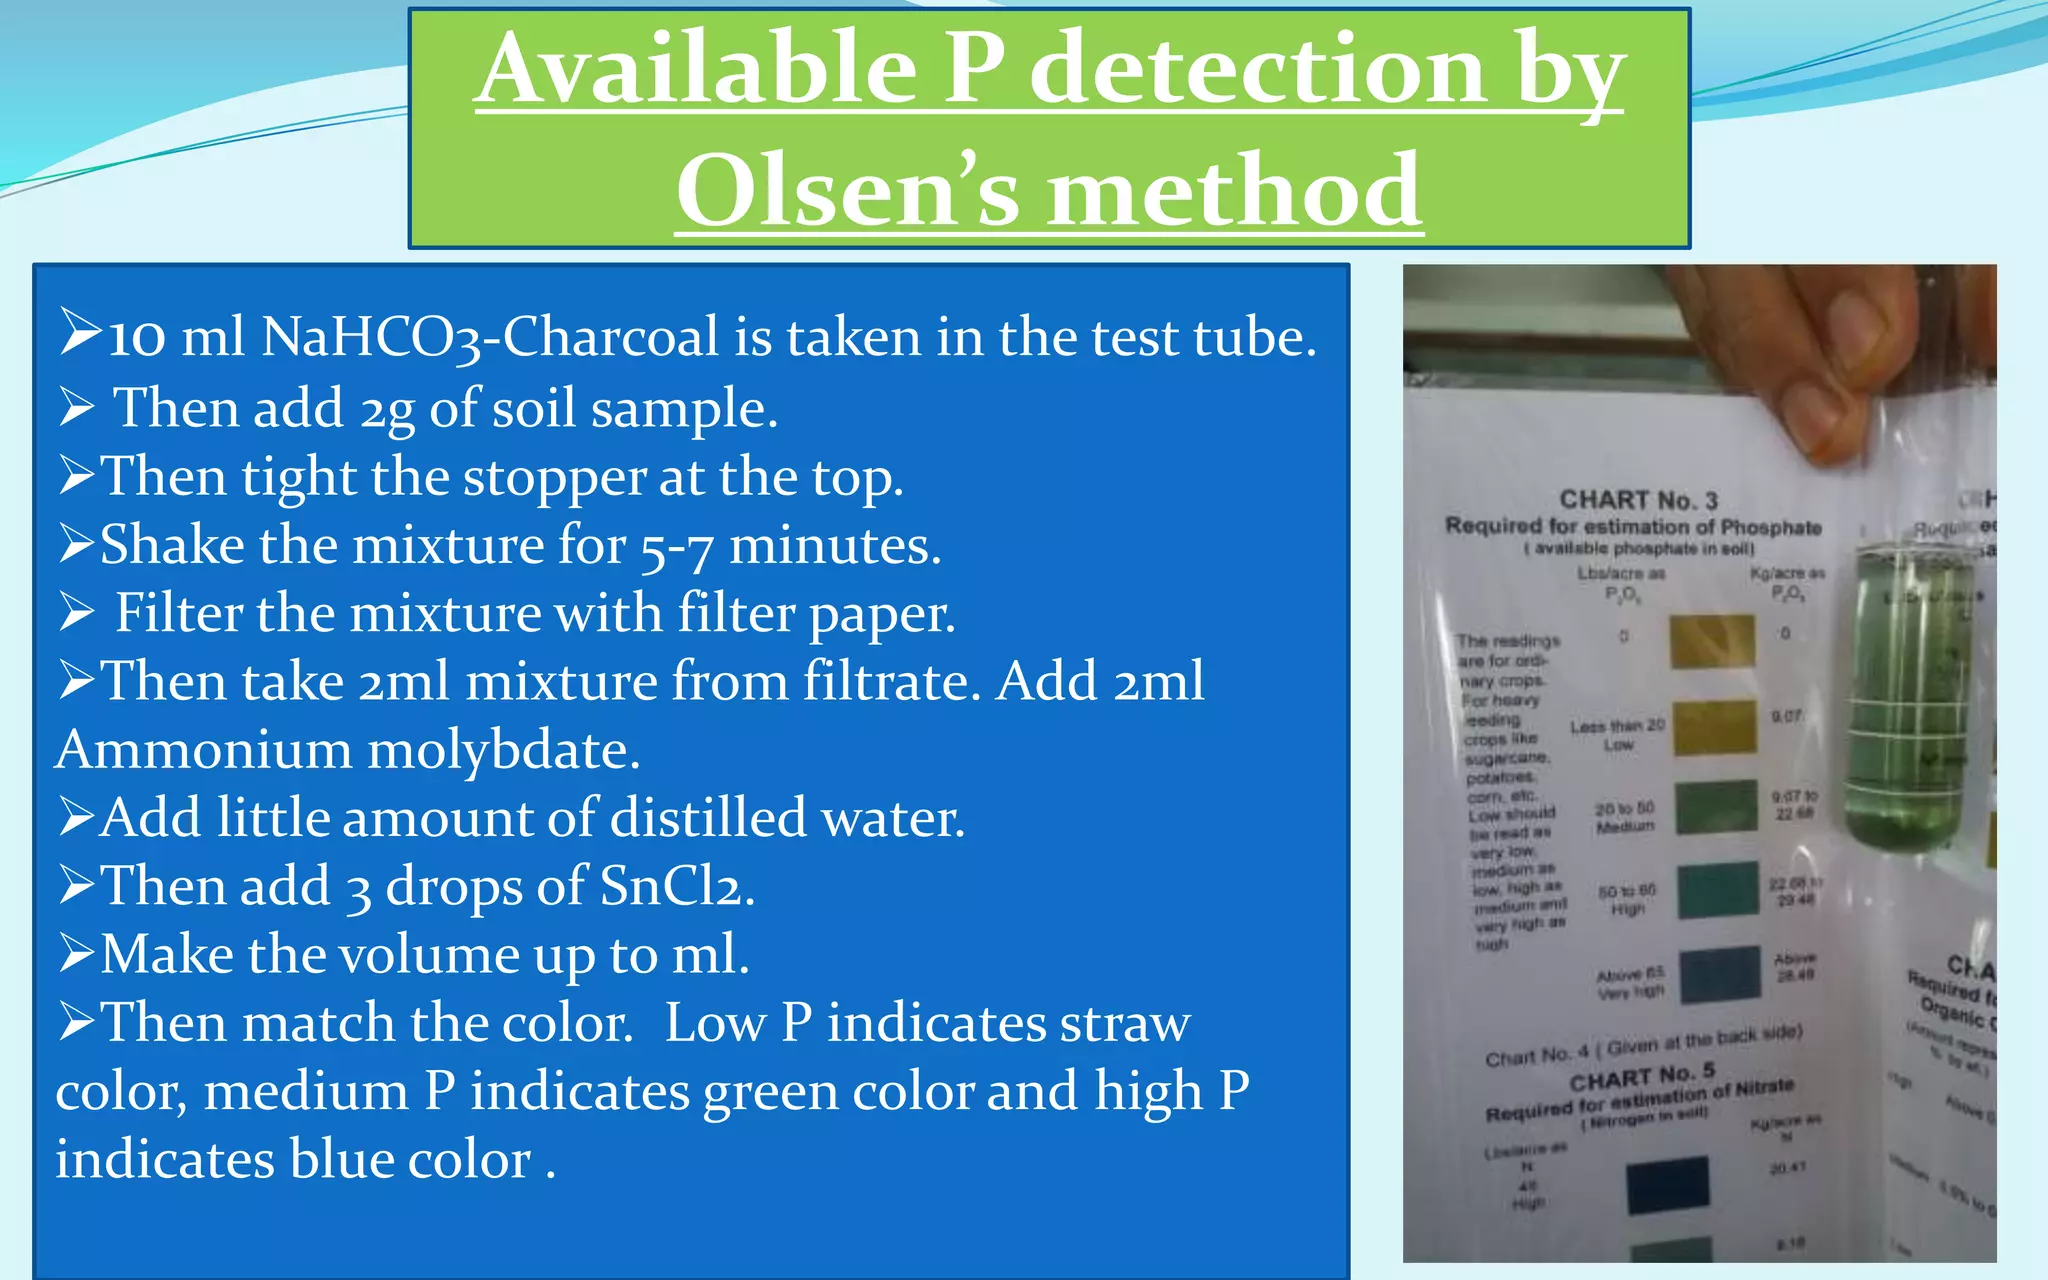
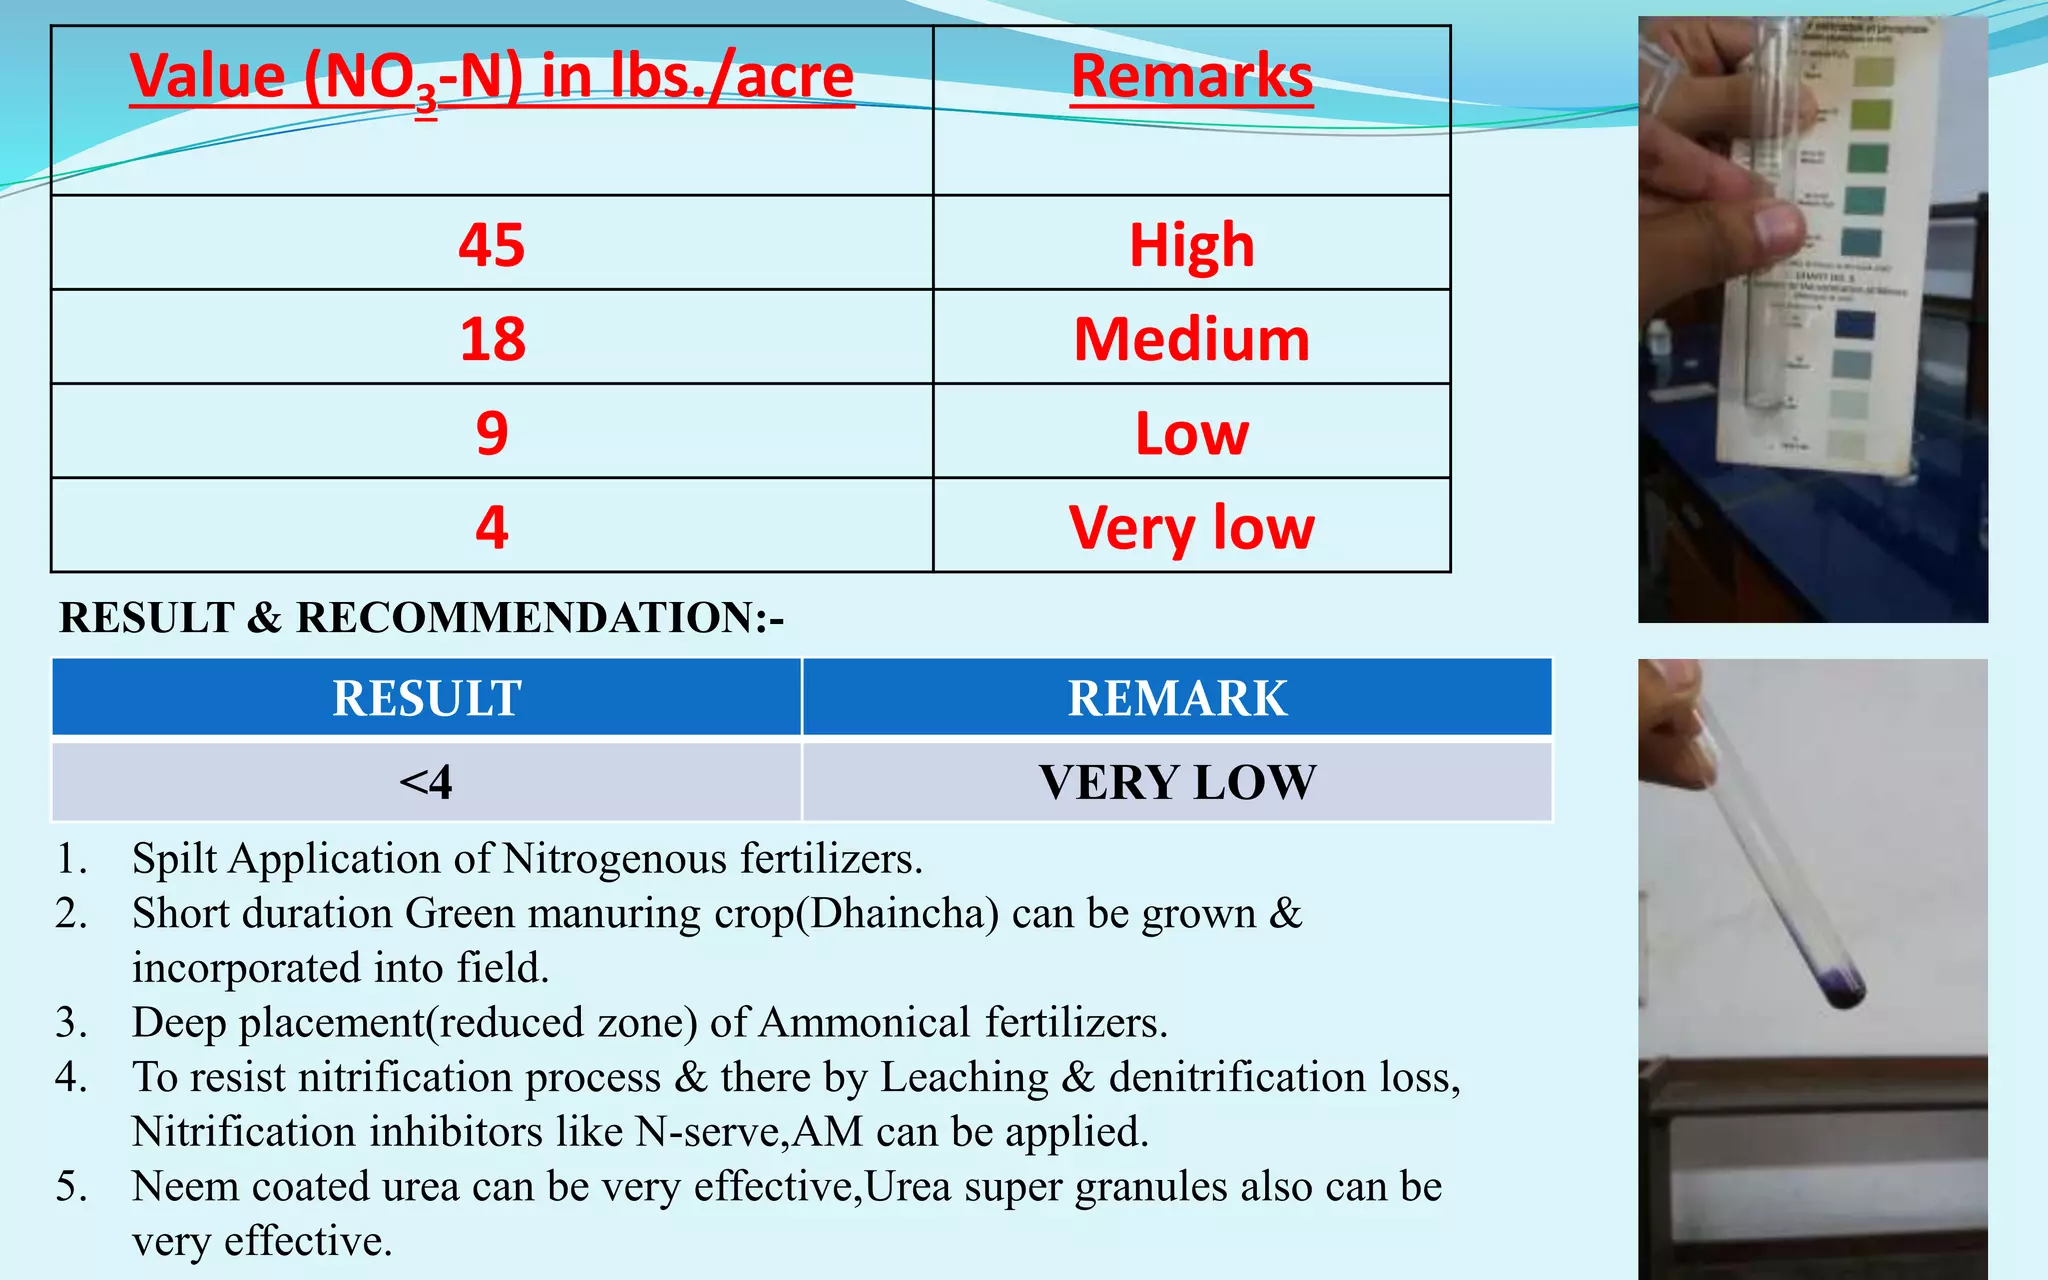
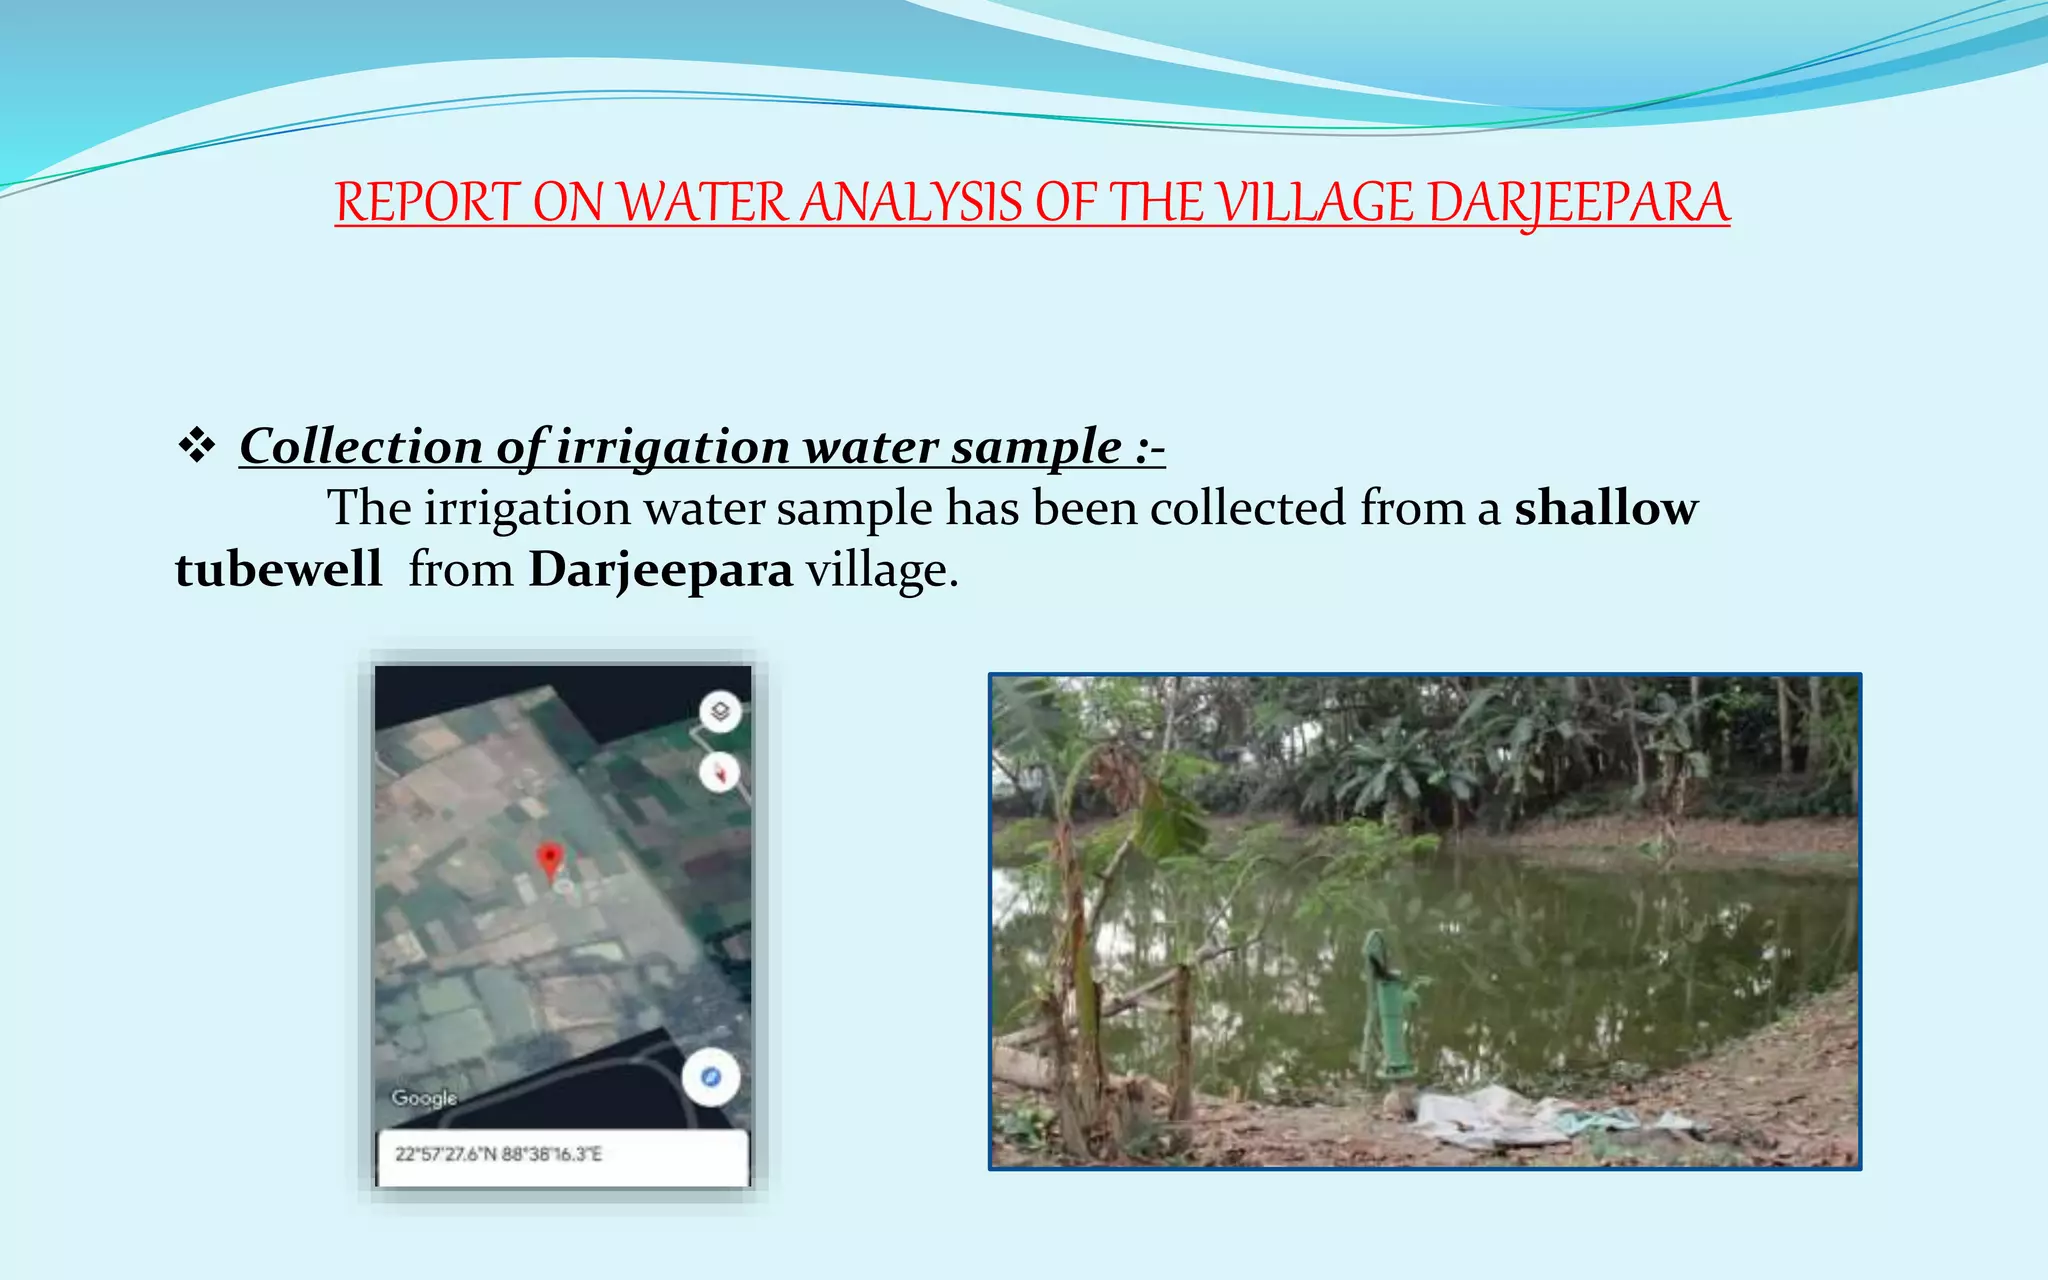
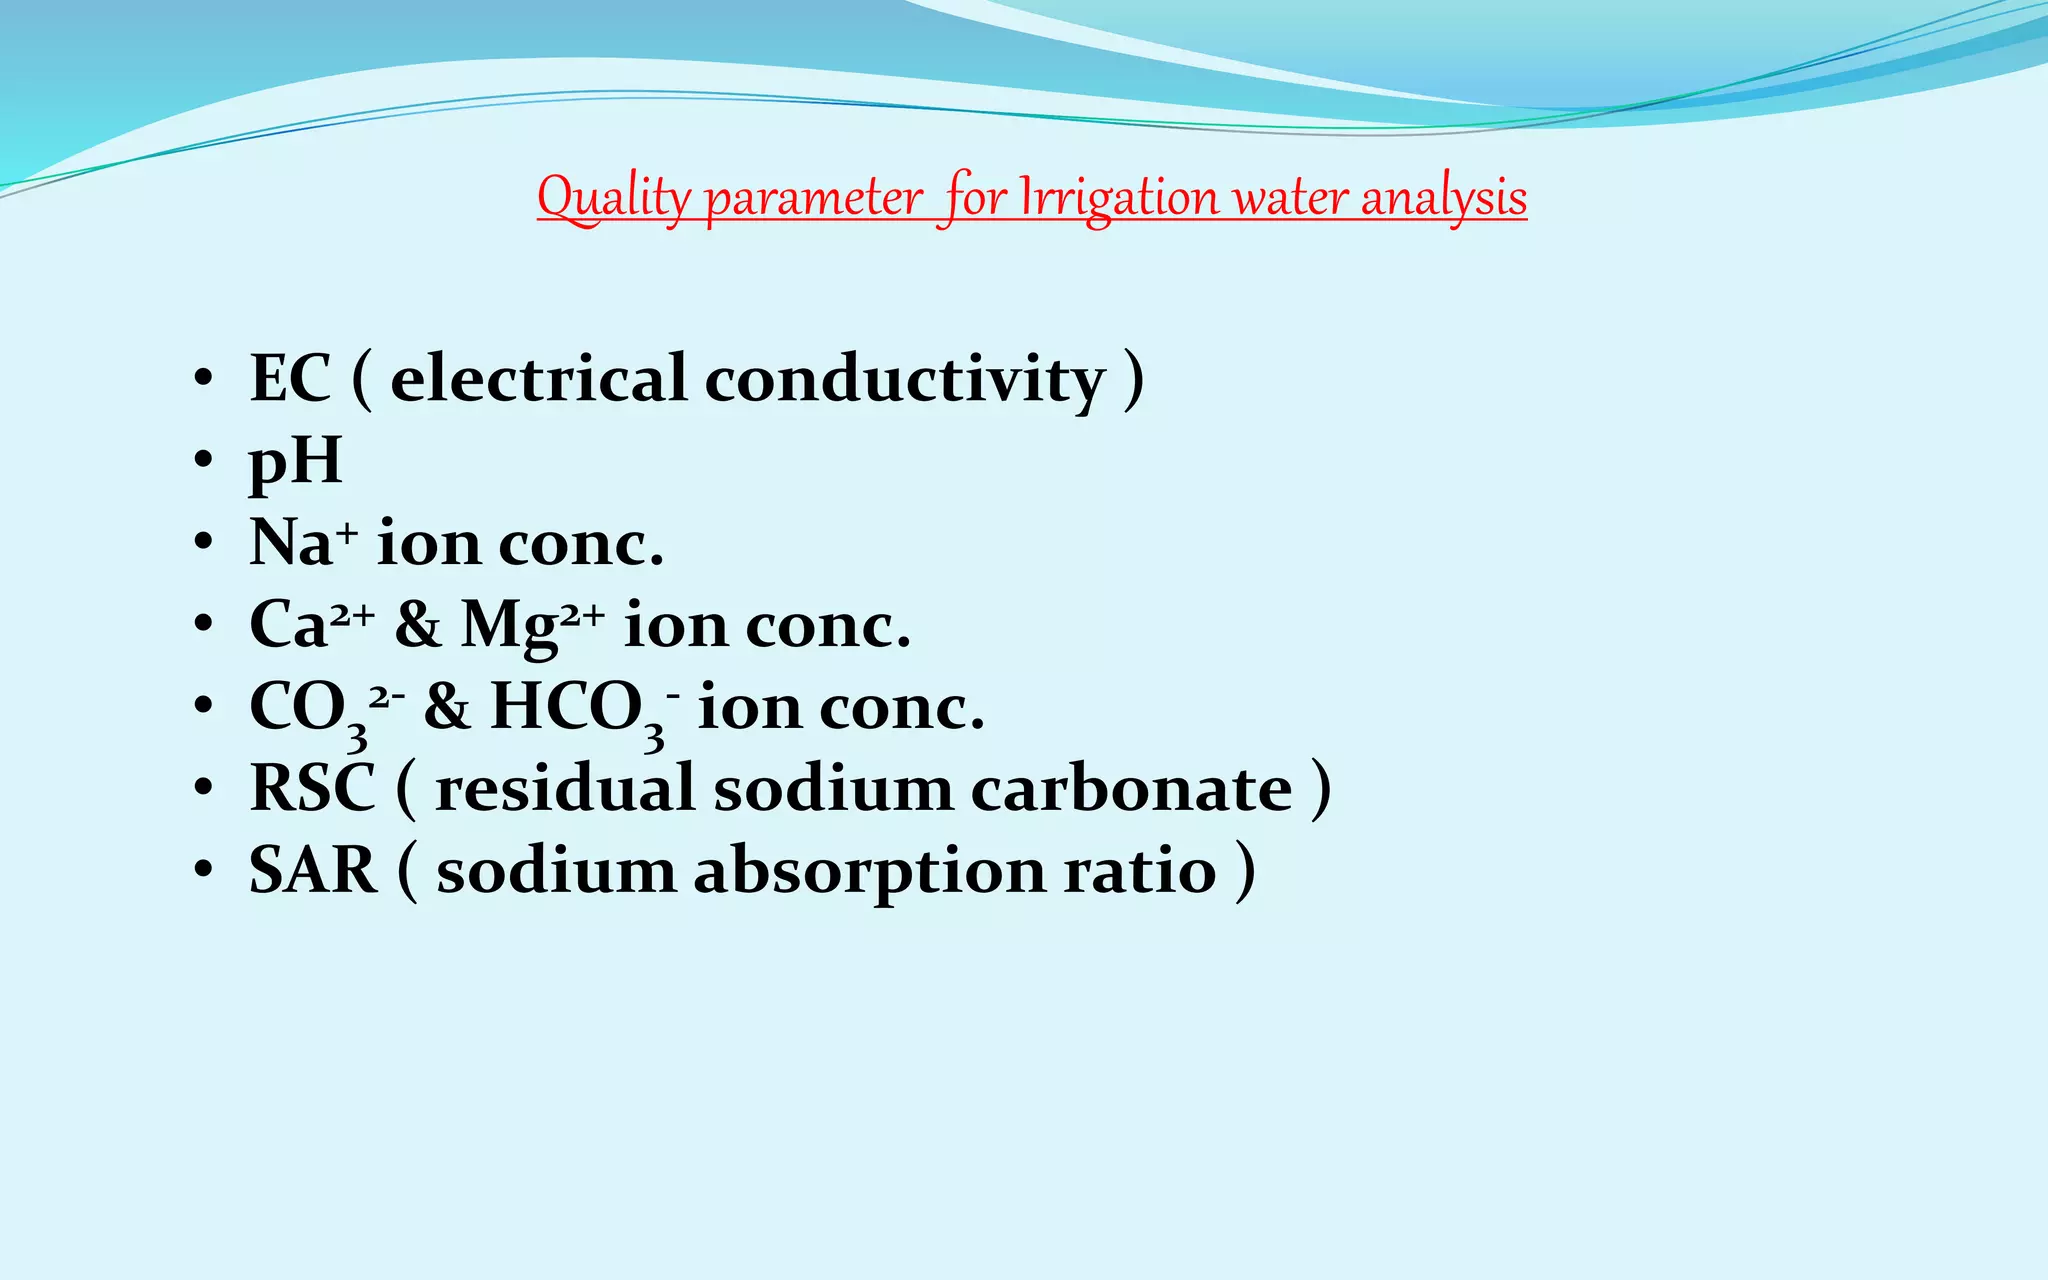
The document provides a diagnostic analysis of soil and water from Darjeepara village in West Bengal, India. Soil and water samples were collected and various tests were conducted to analyze pH, organic carbon, available phosphorus, potassium, and nitrate nitrogen in the soil. Water quality parameters like EC, pH, sodium, calcium, magnesium, carbonate, bicarbonate, RSC and SAR were also analyzed. The results of all tests for both soil and water were found to be in the safe range, indicating the soil and water samples can support crop cultivation without limitations.


