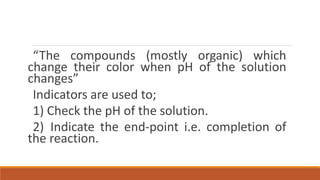
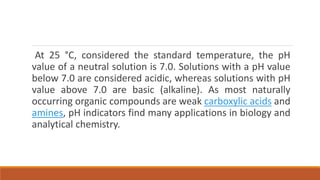
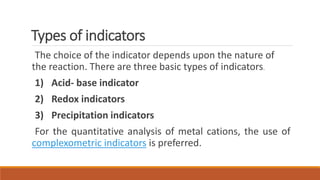
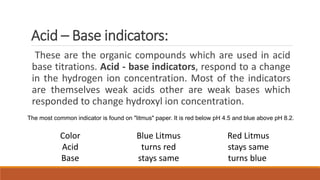
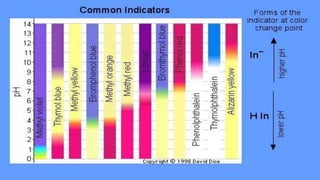
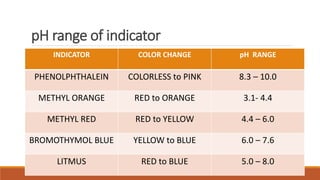
pH indicators are organic compounds that change color based on the pH of a solution. They are used to check pH and indicate the endpoint of reactions. Common indicators include litmus, which is red below pH 4.5 and blue above pH 8.2, and phenolphthalein, which is colorless below pH 8.2 and pink above pH 10. In a demonstration, phenolphthalein was added to solutions containing sodium hydroxide, turning them pink, but when one solution was then mixed with acetic acid, the indicator turned colorless due to the drop in pH caused by neutralization.
It is a type of quantitative analysis that involves weighing of the constituent under determination.
Or
It is the process of isolating and weighing an element or compound in a pure form.
Or
Gravimetric methods of analysis are based on the measurement of mass.
Electrogravimetry, we deposit the analyte as a solid film an electrode in an electrochemical cell.
Ex: The deposition as PbO2 at a Pt anode and reduction of Cu2+ to Cu at a Pt cathode is of electrogravimetry.
When thermal or chemical energy is used to remove a volatile species, such method called as Volatilization gravimetry.
Ex: In determining the moisture content of bread, for example, we use thermal energy to vaporize the water in the sample.
Particulate gravimetry we determine the analyte by separating it from the sample’s matrix using a filtration or an extraction. The determination of total suspended solids is one example of particulate gravimetry.
A gravimetric precipitating agent should react specifically, and selectively with the analyte. The ideal precipitating reagent would react with the analyte to give a product that is
Readily filtered and washed free of contaminants
Low solubility so that no significant loss of the solid occurs during filtration and washing
Un-reactive with constituents of the atmosphere
Should not alter the composition after it is dried or, if necessary, ignited.
Neutralization curves in acid base analytical titrations, indicators.nehla313
Neutralization curves in acid base analytical titrations, indicators,
strong acid strong base
weak acid strong bse
strong acid weak base
weak acid and weak base
Today's Topic Errors - Introduction, Sources of Errors, Types of Errors, Minimization of Errors, Accuracy, Precision, Significant Figures in Pharmaceutical Analysis subject in B.pharmacy 1st year as per JNTUA Syllabus...
Identify acids, bases, and salts.
Describe the properties of an acid and a base.
Define an indicator.
Draw, label, and explain the pH scale.
Use indicators to determine if an unknown is an acid, a base, or a salt.
Describe a neutralization reaction.
Complete neutralization reactions.
In chemistry, pH (potential of hydrogen) is a numeric scale used to specify the acidity or basicity of an aqueous solution. It is approximately the negative of the base 10 logarithm of the molar concentration, measured in units of moles per liter, of hydrogen ions.
How to Create Map Views in the Odoo 17 ERPCeline George
The map views are useful for providing a geographical representation of data. They allow users to visualize and analyze the data in a more intuitive manner.
How to Split Bills in the Odoo 17 POS ModuleCeline George
Bills have a main role in point of sale procedure. It will help to track sales, handling payments and giving receipts to customers. Bill splitting also has an important role in POS. For example, If some friends come together for dinner and if they want to divide the bill then it is possible by POS bill splitting. This slide will show how to split bills in odoo 17 POS.
Instructions for Submissions thorugh G- Classroom.pptxJheel Barad
This presentation provides a briefing on how to upload submissions and documents in Google Classroom. It was prepared as part of an orientation for new Sainik School in-service teacher trainees. As a training officer, my goal is to ensure that you are comfortable and proficient with this essential tool for managing assignments and fostering student engagement.
How to Make a Field invisible in Odoo 17Celine George
It is possible to hide or invisible some fields in odoo. Commonly using “invisible” attribute in the field definition to invisible the fields. This slide will show how to make a field invisible in odoo 17.
Synthetic Fiber Construction in lab .pptxPavel ( NSTU)
Synthetic fiber production is a fascinating and complex field that blends chemistry, engineering, and environmental science. By understanding these aspects, students can gain a comprehensive view of synthetic fiber production, its impact on society and the environment, and the potential for future innovations. Synthetic fibers play a crucial role in modern society, impacting various aspects of daily life, industry, and the environment. ynthetic fibers are integral to modern life, offering a range of benefits from cost-effectiveness and versatility to innovative applications and performance characteristics. While they pose environmental challenges, ongoing research and development aim to create more sustainable and eco-friendly alternatives. Understanding the importance of synthetic fibers helps in appreciating their role in the economy, industry, and daily life, while also emphasizing the need for sustainable practices and innovation.
The Indian economy is classified into different sectors to simplify the analysis and understanding of economic activities. For Class 10, it's essential to grasp the sectors of the Indian economy, understand their characteristics, and recognize their importance. This guide will provide detailed notes on the Sectors of the Indian Economy Class 10, using specific long-tail keywords to enhance comprehension.
For more information, visit-www.vavaclasses.com
Welcome to TechSoup New Member Orientation and Q&A (May 2024).pdfTechSoup
In this webinar you will learn how your organization can access TechSoup's wide variety of product discount and donation programs. From hardware to software, we'll give you a tour of the tools available to help your nonprofit with productivity, collaboration, financial management, donor tracking, security, and more.
Ethnobotany and Ethnopharmacology:
Ethnobotany in herbal drug evaluation,
Impact of Ethnobotany in traditional medicine,
New development in herbals,
Bio-prospecting tools for drug discovery,
Role of Ethnopharmacology in drug evaluation,
Reverse Pharmacology.
2. “The compounds (mostly organic) which
change their color when pH of the solution
changes”
Indicators are used to;
1) Check the pH of the solution.
2) Indicate the end-point i.e. completion of
the reaction.
3. At 25 °C, considered the standard temperature, the pH
value of a neutral solution is 7.0. Solutions with a pH value
below 7.0 are considered acidic, whereas solutions with pH
value above 7.0 are basic (alkaline). As most naturally
occurring organic compounds are weak carboxylic acids and
amines, pH indicators find many applications in biology and
analytical chemistry.
4. Types of indicators
The choice of the indicator depends upon the nature of
the reaction. There are three basic types of indicators.
1) Acid- base indicator
2) Redox indicators
3) Precipitation indicators
For the quantitative analysis of metal cations, the use of
complexometric indicators is preferred.
5. Acid – Base indicators:
These are the organic compounds which are used in acid
base titrations. Acid - base indicators, respond to a change
in the hydrogen ion concentration. Most of the indicators
are themselves weak acids other are weak bases which
responded to change hydroxyl ion concentration.
Color Blue Litmus Red Litmus
Acid turns red stays same
Base stays same turns blue
The most common indicator is found on "litmus" paper. It is red below pH 4.5 and blue above pH 8.2.
6. An indicator is usually some weak organic acid or base dye that
changes colors at definite pH values. The unionized form of weak acid
form (HIn) will have one color and the weak acid negative ion (In-)
will have a different color. The weak acid equilibrium is:
HIn --> H+ + In-
For phenolphthalein: pH 8.2 = colorless; pH 10 = red
For bromophenol blue: pH 3 = yellow; pH 4.6 = blue
7. Magic Pitcher Demonstration:
Phenolphthalein is an indicator of acids (colorless) and bases (pink).
Sodium hydroxide is a base, and it was in the pitcher at the
beginning, so when added to the phenolphthalein in beakers 2 and
4, it turned pink (top half of the graphic).
Explanation:
Equilibrium: HIn --> H+ + In-
colorless pink
The equilibrium shifts right, HIn decreases, and In- increases. As the
pH increase between 8.2 to 10.0 the color becomes red because of
the equilibrium shifts to form mostly In- ions.
8.
9. The third beaker has only the NaOH but no phenolphthalein, so it
remained colorless. The first beaker contain acetic acid and is skipped
over at first.
After pouring beakers 2, 3, 4 back into the pitcher it give a pink solution.
Bottom half of the graphic: When the pitcher is then poured back into
beakers 2, 3, 4 it is a pink solution.
In the first beaker, a strange thing happens in that the pink solution
coming out of the pitcher now changes to colorless. This happens
because the first beaker contains some vinegar or acetic acid which
neutralizes the NaOH, and changes the solution from basic to acidic.
Under acidic conditions, the phenolphthalein indicator is colorless.
Neutralization: HC2H3O2 + NaOH --> Na(C2H3O2) + HOH
10. The simplified reaction is:
H+ + OH- --> HOH
As OH- ions are added, they are consumed by the excess of acid
already in the beaker as expressed in the above equation. The
hydroxide ions keep decreasing and the hydrogen ions increase, pH
decreases.
See lower equation: The indicator equilibrium shifts left, In- ions
decrease. Below pH 8.2 the indicator is colorless. As H+ ions are
further increased and pH decreases to pH 4-5, the indicator
equilibrium is effected and changes to the colorless HIn form.
Equilibrium: HIn --> H+ + In-
colorless red
11.
12. pH range of indicator
INDICATOR COLOR CHANGE pH RANGE
PHENOLPHTHALEIN COLORLESS to PINK 8.3 – 10.0
METHYL ORANGE RED to ORANGE 3.1- 4.4
METHYL RED RED to YELLOW 4.4 – 6.0
BROMOTHYMOL BLUE YELLOW to BLUE 6.0 – 7.6
LITMUS RED to BLUE 5.0 – 8.0
13. What is End Point?
In an acid- base titration, the base solution is gradually
added from a burette into an acidic solution in a titration
flask. When the amount of base added neutralize to the
amount of base added in the flask “equivalence point or
End point” will reached. The end point of the titration is
shown by color changes of an indicator , previously added
to the acidic solution in the titration flask.