Downloaded 38 times

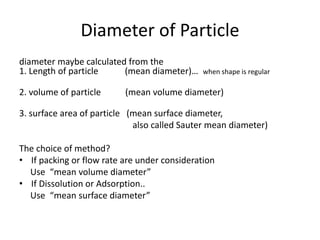
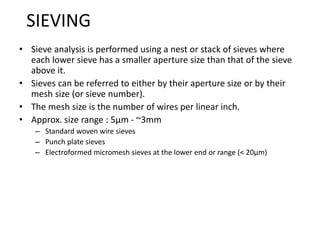
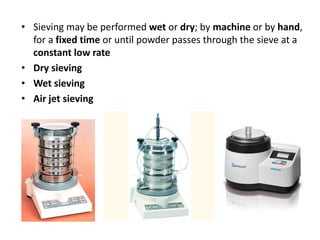


Sieve analysis involves using a stack of sieves to separate particles based on their diameter. The sieves have progressively smaller mesh sizes to separate particles. Sieve analysis can be performed wet or dry. The results are often represented using size-frequency distribution or cumulative distribution plots. A size-frequency plot shows the particle size distribution, while a cumulative plot shows the percentage of particles below each size. The median diameter is read from the 50% value on the cumulative plot. The choice to use mean volume or surface diameter depends on whether packing, flow rates, dissolution, or adsorption are being considered.