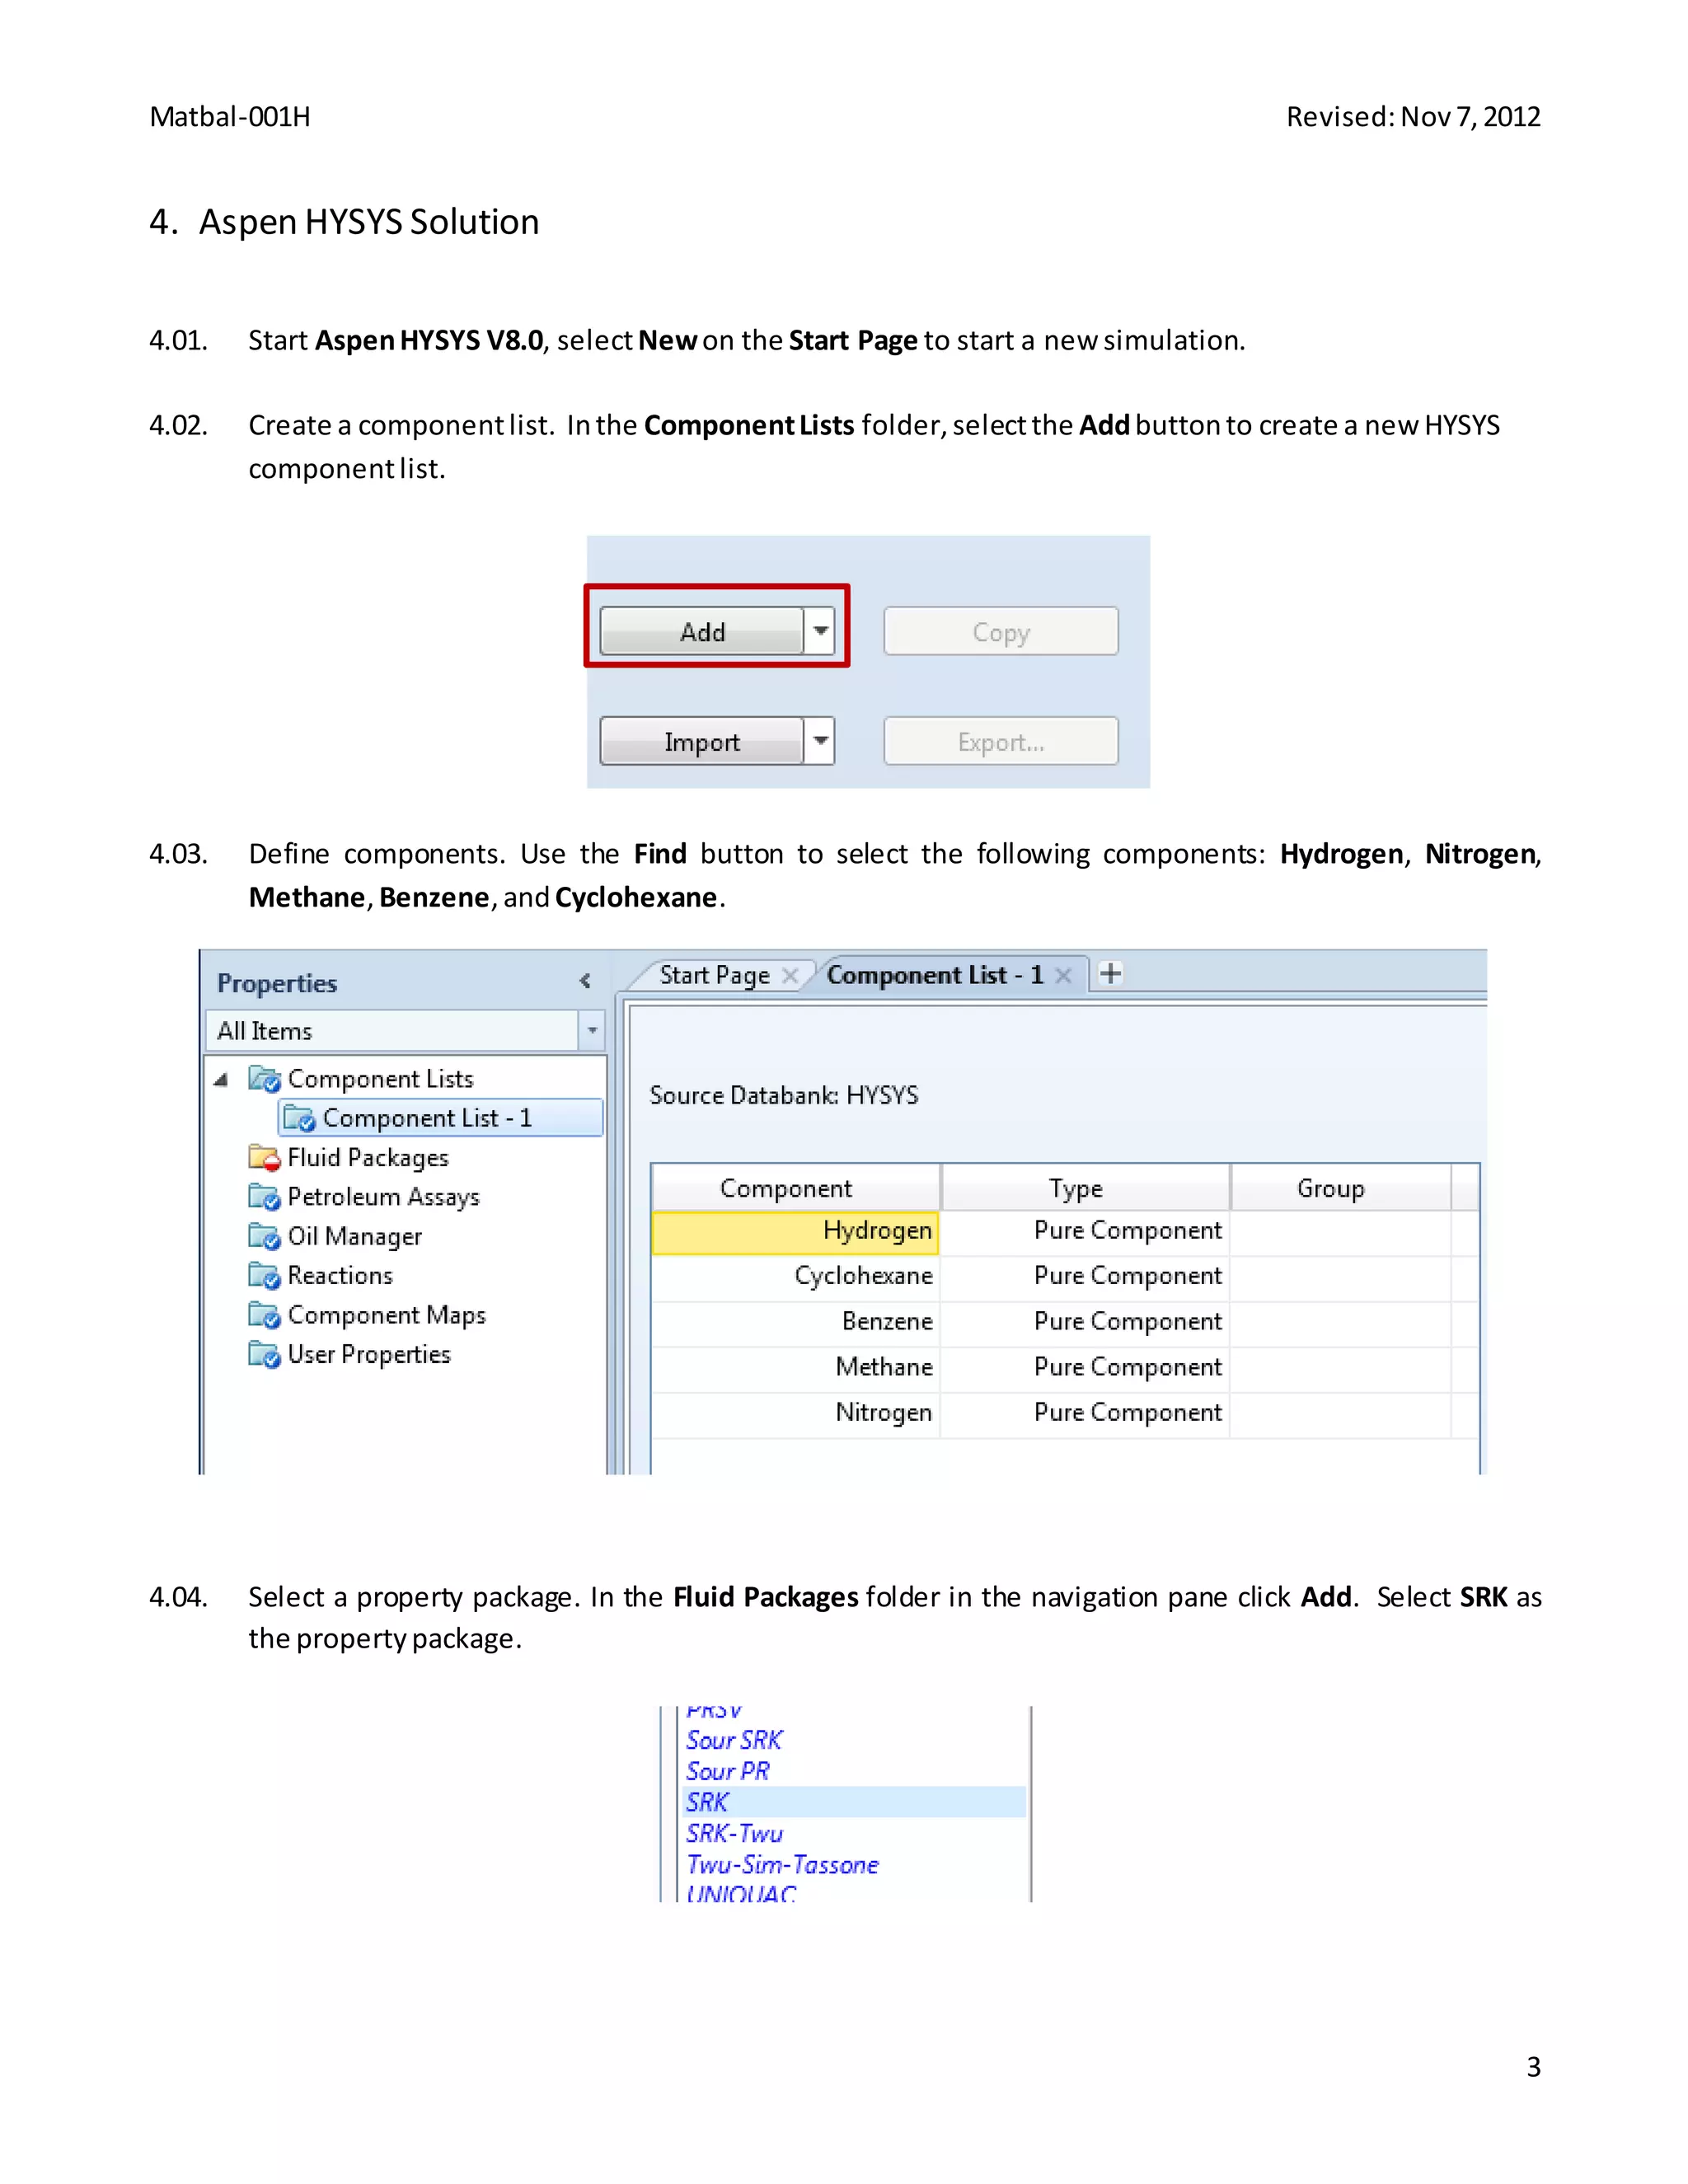
AspenTech Incorporations
Aspen Hysys V8.8
Cases Solved in Hysys Version 8.0 are same as Version 8.8
Chemical Process Principles
Matbal-001H Revised:Nov7,2012
1
Cyclohexane Production with Aspen HYSYS® V8.0
Lesson Objectives1.
 Constructan Aspen HYSYS flowsheetsimulationof the productionof cyclohexane viabenzene
hydrogenation
 Become familiarwithuserinterface and toolsassociatedwithAspenHYSYS
Prerequisites2.
 Aspen HYSYS V8.0
 Knowledgeof chemical processoperations
Background/Problem3.
Construct an Aspen HYSYS simulation to model the production of cyclohexane via benzene hydrogenation. The
simplified flowsheet for this process is shown below. Fresh benzene and hydrogen feed streams are first fed
through a heater to bring the streams up to reactor feed temperature and pressure conditions. This feed
mixture is then sent to a fixed-bed catalytic reactor where 3 hydrogen molecules react with 1 benzene molecule
to form cyclohexane. This simulation will use a conversion reactor block to model this reaction. The reactor
effluent stream is then sent to a flash tank to separate the light and heavy components of the mixture. The
vapor stream coming off the flash tank is recycled back to the feed mixture after a small purge stream is
removed to preventimpurities from building upin the system. The majority of the liquid streamleaving the flash
tank goes to a distillation column to purify the cyclohexane product, while a small portion of the liquid stream is
recycled back to the feed mixture to minimize losses of benzene. Process operating specifications are listed on
the followingpage.
Matbal-001H Revised:Nov7,2012
2
FeedStreams
Benzene Feed (BZFEED) Composition (mole fraction)
Hydrogen -
Nitrogen -
Methane -
Benzene 1
Total Flow (lbmol/hr) 100
Temperature(°F) 100
Pressure (psia) 15
Hydrogen Feed (H2FEED)
Hydrogen 97.5
Nitrogen 0.5
Methane 2.0
Benzene -
Total Flow (lbmol/hr) 310
Temperature(°F) 120
Pressure (psia) 335
DistillationColumn
Number of stages 15
Feed stage 8
Reflux Ratio 1.2
Cyclohexane recovery 99.99 mole % inbottoms
Condenser Pressure 200 psia
ReboilerPressure 210 psia
FeedPreheater
Outlet Temperature 300 °F
Outlet Pressure 330 psia
Reactor
Stoichiometry Benzene +3H2  Cyclohexane
Conversion 99.8% ofbenzene
Outlet temperature 400°F
Pressure drop 15psi
Flash Tank
Temperature 120°F
Pressure drop 5psi
Purge Stream
Purge rateis 8% ofvaporrecyclestream
LiquidSplit
70% ofliquidstreamgoes todistillationcolumn
The examplespresentedare solely intendedtoillustrate specificconceptsand principles. Theymay not
reflectan industrial application or real situation.
Matbal-001H Revised:Nov7,2012
3
Aspen HYSYS Solution4.
4.01. Start AspenHYSYS V8.0, selectNewon the Start Page to start a new simulation.
4.02. Create a componentlist. Inthe ComponentLists folder,selectthe Addbuttonto create a newHYSYS
componentlist.
4.03. Define components. Use the Find button to select the following components: Hydrogen, Nitrogen,
Methane, Benzene,andCyclohexane.
4.04. Select a property package. In the Fluid Packages folder in the navigation pane click Add. Select SRK as
the propertypackage.
Matbal-001H Revised:Nov7,2012
4
4.05. We must now specify the reaction involved in this process. Go to Reactions folder in the navigation
pane and click Add to add a reactionset.
4.06. In Reactions | Set-1 select Add Reaction. Select the Hysys radio button and select Conversion. Then
click Add Reaction. Once a new reaction (Rxn-1) can be seen on the reaction set page, close the
Reactions windowshownbelow.
4.07. Double click on Rxn-1 to define the reaction. In the reaction property window, add components
Benzene, Hydrogen, and Cyclohexane to the Stoichiometry Info grid. Enter -1, -3, and 1, respectively,
for stoichiometry coefficients. In the Basis grid select Benzene as Base Component, Overall for Rxn
Phase, 99.8 for Co, and 0 for both C1 and C2. This indicates that the reaction will convert 99.8% of
benzene regardlessof temperature. Close thiswindow whencomplete.
Matbal-001H Revised:Nov7,2012
5
4.08. Attach this reaction set to a fluid package by clicking the Add to FP button. Select Basis-1 and click Add
Set to FluidPackage. The reactionsetshouldnow be ready.
4.09. We are now ready to enter the simulation environment. Click the Simulation button in the bottom left
of the screen.
Matbal-001H Revised:Nov7,2012
6
4.10. Firstwe will place aMixer anda Heater blockontothe flowsheet.
4.11. Double click on the mixer (MIX-100) to open the mixer property window. Create 2 inlet streams:
H2FEED, BZFEED; and 1 outletstream: ToPreHeat.
Matbal-001H Revised:Nov7,2012
7
4.12. Go to the Worksheet tab to define streams H2FEED and BZFEED. First we will define the Conditions of
each stream. For H2FEED, enter a Temperature of 120°F, a Pressure of 335 psia, and a Molar Flow of
310 lbmole/hr. For BZFEED, enter a Temperature of 100°F, a Pressure of 15 psia, and a Molar Flow of
100 lbmole/hr. Note that you can change the global unit set to Field if the units are different than those
displayedbelow.
Matbal-001H Revised:Nov7,2012
8
4.13. Next we will define the Composition of the two feed streams. In the Worksheet tab go to the
Composition form. Enter the compositions shown below. You will notice that after inputting the
composition, the mixerwillsuccessfullysolve forall properties.
4.14. Double click on the heater block (E-100) to configure the heater. Select stream ToPreHeat as the inlet
and create an outletstreamcalled R-IN. Addan energystreamcalled PreHeatQ.
Matbal-001H Revised:Nov7,2012
9
4.15. Go to the Worksheet tab and specify the outlet stream R-IN temperature and pressure. Enter 300°F for
Temperature and 330 psiafor Pressure.
Matbal-001H Revised:Nov7,2012
10
4.16. The flowsheetshouldlooklike the followingatthispoint.
4.17. We will now add a Conversion Reactor to the flowsheet. Press F12 on the keyboard to open the
UnitOpswindow. Selectthe Reactorsradiobuttonand select ConversionReactor. Press Add.
4.18. In the Conversion Reactor property window, select the inlet stream to be R-IN, and create a Liquid
OutletcalledLIQ and a Vapour Outlet calledVAP. Inthe Parametersform, entera Delta P of 15 psi.
Matbal-001H Revised:Nov7,2012
11
Matbal-001H Revised:Nov7,2012
12
4.19. In the Reactions tab, select Set-1 for Reaction Set. Notice that when the reactor solves, the contents of
the reactor are entirely in the vapor phase, therefore there is no liquid flow leaving the bottom of the
reactor.
Matbal-001H Revised:Nov7,2012
13
4.20. Nextwe will addaCooler to the mainflowsheettocool downthe vaporstreamleavingthe reactor.
4.21. Double click on the cooler block (E-101) to open the cooler property window. Select VAP as the inlet
stream and create an outlet stream called COOL. Also add an energy stream called COOLQ. In the
Parameters formentera Delta P of 5 psi.
Matbal-001H Revised:Nov7,2012
14
4.22. Go to the Worksheet tab to specify the outlet stream temperature. Enter 120°F for the Temperature of
streamCOOL. The coolerwill solve.
Matbal-001H Revised:Nov7,2012
15
4.23. We will now add a Separator block to separate the vapor and liquid phases of stream COOL. From the
model palette addaSeparator to the flowsheet.
4.24. Double click on the separator block(V-100). Select COOL as the inlet stream and create liquid and vapor
outletstreamscalled LIQ1and VAP1. The separatorshouldsolve.
Matbal-001H Revised:Nov7,2012
16
4.25. The flowsheetshouldnowlooklikethe following.
4.26. We will now add 2 Tee blocks, 1 for each of the separator outlet streams. One tee will be used to purge
a portion of the vapor stream to prevent impurities from building up in the system. The other tee will
be used to recycle a portion of the liquid back to the mixer and the rest of the liquid will be fed to a
distillationcolumn.
Matbal-001H Revised:Nov7,2012
17
4.27. Double click on the first Tee block (TEE-100). Select stream VAP1 as the inlet, and create 2 outlet
streamsVAPREC,and PURGE.
Matbal-001H Revised:Nov7,2012
18
4.28. Go to the Parameterspage and enter0.08 for the Flow Ratio for streamPURGE.
4.29. You can rotate the icon for a block by selecting the icon and clicking the Rotate button in the
Flowsheet/Modifytabinthe ribbon.
Matbal-001H Revised:Nov7,2012
19
4.30. Double click the second Tee block (TEE-101). Select LIQ1 for the inlet stream and create 2 outlet
streamsLIQREC, and ToColumn.
4.31. In the Parameters tab entera FlowRatio of 0.7 for streamToColumn.
Matbal-001H Revised:Nov7,2012
20
4.32. The flowsheetshouldnow looklikethe following.
(FAQ) UsefulOption To Know:Saving Checkpoints
Save “checkpoints” as you go. Once you have a working section of the flowsheet, save as a new
file name, so you can revert to an earlier checkpoint if the current one becomes too complex to
troubleshootorconvergence errorsbecomepersistent.
Matbal-001H Revised:Nov7,2012
21
4.33. We are now ready to connect the recycle streams back to the mixer. On the main flowsheet, add 2
Recycle blocks.
Matbal-001H Revised:Nov7,2012
22
4.34. Double click on the first recycle block (RCY-1). Select stream VAPREC as the inlet stream and create an
outletstreamcalled VAPToMixer.
4.35. Double click the second recycle block (RCY-2). Select LIQREC as the inlet stream and create an outlet
streamcalled LIQToMixer.
Matbal-001H Revised:Nov7,2012
23
4.36. Connect the recycle streams back to the mixer. Double click the mixer block (MX-100). On the Design |
Connectionssheetadd LIQToMixerand VAPToMixeras inletstreams. The flowsheetshouldconverge.
4.37. The flowsheetshouldnowlooklikethe following.
Matbal-001H Revised:Nov7,2012
24
4.38. We are now ready to add the distillation column to the flowsheet. From the Model Palette add a
DistillationColumnSub-Flowsheet.
4.39. Double click on the Distillation Column Sub-flowsheet. This will launch the Distillation Column Input
Expert. Enter 15 for # Stages and specify ToColumn as inlet stream on stage 8_Main TS. Select Full
Reflux for Condenser, create an Ovhd Vapour Outlet stream called Off Gas, create Bottoms Liquid
Outletstreamcalled Bot, and adda CondenserEnergyStream calledCondQ. Whenfinishedclick Next.
Matbal-001H Revised:Nov7,2012
25
4.40. On page 2 of the Distillation Column Input Expert keep the default selections for Reboiler Configuration
and click Next.
Matbal-001H Revised:Nov7,2012
26
4.41. On page 3 of the Distillation Column Input Expert enter a condenser pressure of 200 psia and a reboiler
pressure of 210 psia. ClickNext.
4.42. On page 4 of the Distillation Column Input Expert leave fields for temperature estimates blank and click
Next. On the final page of the column expert enter a molar Reflux Ratio of 1.2 and click Done to
configure the column.
Matbal-001H Revised:Nov7,2012
27
4.43. After completing the input for the column expert the Column property window will open. We want to
create a design specification in order to ensure that 99.99% of the cyclohexane is recovered in the
bottoms stream. Go to the Design | Specs sheet. Click Add and select Column Component Recovery.
In the Comp Recovery window specify Stream for Target Type, Bot@COL1 for Draw, 0.9999 for Spec
Value,and Cyclohexane forComponents. Close thiswindow whenfinished.
Matbal-001H Revised:Nov7,2012
28
4.44. Go to the Specs Summary sheet and make sure that the only active specs are Reflux Ratio and Comp
Recovery. The columnshouldconverge.
4.45. The flowsheetisnowcomplete andshouldlooklike the following.
Matbal-001H Revised:Nov7,2012
29
Thisflowsheetisnowcomplete.
Conclusion5.
This is a simplified process simulation, however you should now have learned the basic skills to create and
manipulate asteadystate chemical processsimulationinAspenHYSYSV8.0.
Copyright6.
Copyright © 2012 by Aspen Technology, Inc. (“AspenTech”). All rights reserved. This work may not be
reproduced or distributed in any form or by any means without the prior written consent of
AspenTech. ASPENTECH MAKES NO WARRANTY OR REPRESENTATION, EITHER EXPRESSED OR IMPLIED, WITH
RESPECT TO THIS WORK and assumes no liability for any errors or omissions. In no event will AspenTech be
liable to you for damages, including any loss of profits, lost savings, or other incidental or consequential
damages arising out of the use of the information contained in, or the digital files supplied with or for use with,
thiswork. This workand itscontentsare providedforeducational purposesonly.
AspenTech®, aspenONE®, and the Aspen leaf logo, are trademarks of Aspen Technology, Inc.. Brands and
productnamesmentioned inthisdocumentationare trademarksorservice marksof theirrespective companies.
Matbal-002H Revised:Nov7,2012
1
Calculation of Gasoline Additives with Aspen HYSYS® V8.0
1. Lesson Objectives
 Learn howto specifyamixer
 Learn howto use the spreadsheetinAspen HYSYStoperformcustomizedcalculations
2. Prerequisites
 Aspen HYSYS V8.0
3. Background
Ethyl tert-butyl ether(ETBE) isan oxygenate thatisaddedtogasoline toimprove ResearchOctane Number
(RON) andto increase oxygencontent. The goal isto have 2.7% oxygenbyweightinthe final product. The legal
limitisthatETBE cannot exceed more than17% byvolume. Forsimplicity,we use 2,2,4-trimethylpentane to
representgasoline. Since ETBE'smolecularweightis102.18 g/mol, the ETBE in the productstream can be
calculatedasfollowing:
Thisyields17.243% of ETBE byweightinthe productstream. Giventhis,the spreadsheettool canbe utilizedto
target the ETBE feedtoachieve the desiredoxygencontent.
In thistutorial we will calculate:
 For a certainflowrate of gasoline (e.g.,100 kg/hr),how muchETBE shouldbe addedto achieve the
oxygencontentof 2.7% byweightinthe blendedgasoline.
 Checkwhetherornot the legal limitof ETBE contentissatisfied.
A HYSYS spreadsheetis usedtoperformcalculationsoneachcriterion. Both targetsshouldbe metinthe
simulation.
The examplespresentedare solelyintendedtoillustrate specificconceptsand principles. Theymay not
reflectan industrial application or real situation.
Matbal-002H Revised:Nov7,2012
2
4. Aspen HYSYS Solution
4.01. Start a newsimulationin AspenHYSYSV8.0.
4.02. Create a componentlist. Inthe ComponentLists folderselectAdd. Add2,2,4-trimethylpentane and
ETBE to the componentlist.
4.03. Define propertypackage. Inthe FluidPackagesfolderselectAdd. SelectPeng-Robinsonasthe
propertypackage.
4.04. Enter the simulationenvironmentbyclickingthe Simulationbuttoninthe bottomleftof the screen.
4.05. Adda Mixerto the flowsheetfromthe Model Palette.
Matbal-002H Revised:Nov7,2012
3
4.06. Double clickonthe mixer(MIX-100). Create two InletscalledETBE and Gasoline. Create anOutlet
calledBlend.
Matbal-002H Revised:Nov7,2012
4
4.07. Define feedstreams. Goto the Worksheettab. For streamETBE entera Temperature of 25°C and a
Pressure of 1 bar. Leave Mass Flowemptyas we will solve foritlater.
4.08. In the Compositionformunderthe Worksheettab,entera Mole Fraction of 1 for ETBE in the ETBE feed
stream.
Matbal-002H Revised:Nov7,2012
5
4.09. Define gasoline feedstream. Inthe Conditionsforminthe Worksheettab,entera Temperature of
25°C, a Pressure of 1 bar, anda Mass Flowof 82.76 kg/h.
4.10. In the Compositionformentera Mole Fraction of 1 for 224-Mpentane inthe Gasoline stream. The
gasoline streamshouldsolve.However.the mixerwill notsolve because the flowrate of ETBE is still
unknown.
Matbal-002H Revised:Nov7,2012
6
4.11. We will nowcreate aspreadsheettocalculate the targetmassflowrate of streamETBE. Adda
Spreadsheettothe flowsheetfromthe Model Palette.
Matbal-002H Revised:Nov7,2012
7
4.12. Double clickonthe spreadsheet(SPRDSHT-1). Goto the Spreadsheettaband enterthe followingtextin
cellsA1 and A2.
Matbal-002H Revised:Nov7,2012
8
4.13. Rightclickon cell B1 andselectImport Variable. Selectthe followingtoimportthe MassFlowof stream
Gasoline tocell B1. Press OK whencomplete.
4.14. Clickcell B2 and enterthe followingformula: =(B1*0.17243) / (1-0.17243). This will calculate the mass
flowrate for streamETBE. Fromthe backgroundsection,we know thatinorderto reach the oxygen
contentgoal of 2.7%, we will needthe gasoline streamtocontain17.243% ETBE by weight.
Matbal-002H Revised:Nov7,2012
9
4.15. We nowwishto exportthe calculatedflow rate incell B2to streamETBE. Rightclickcell B2 and select
Export Formula Result. Make the followingselectionsandclick OKwhencomplete. The mixershould
nowsolve.
Matbal-002H Revised:Nov7,2012
10
4.16. We will nowcalculate the volumepercentof ETBEin the blendedstreamtomake sure thatthe ETBE
contentisbelowthe legal limitof 17volume percent. Thiscaneasilybe observedinthe spreadsheet. In
the spreadsheet,enterthe followingtextincell A4.
4.17. Rightclickon cell B4 andselectImport Variable.Make the followingselectionstoimport MasterComp
Volume Frac of ETBE inthe blendedstream. Click OKwhencomplete.
Matbal-002H Revised:Nov7,2012
11
4.18. The volume fractionof ETBE inthe blendedstreamis0.1596, whichis below the legal limitof 0.17. It is
determinedthatthe targetflowrate of ETBE to be mixedwiththisgasoline streamis17.24 kg/h.
Matbal-002H Revised:Nov7,2012
12
5. Conclusions
For a specifiedgasolinemassflowrate of 82.76 kg/hr,17.24 kg/hrof ETBE isneededtoachieve 2.7% oxygen
contentbyweightinthe final product. Furthermore,afterblending,the productdoesnotexceedthe legallimit
for ETBE of 17% byvolume. If gasoline containsasingle component,manualcalculationshouldbe easywithout
a simulator. However,real gasoline containsmanyunknowncomponentsandgasoline’scontentsvaryas
feedstockorplantoperationconditionschange. Therefore,manual calculationbecomesverydifficultandthe
use of a simulatorsuchas Aspen HYSYScan be helpful tocarryout the calculation.
6. Copyright
Copyright© 2012 by AspenTechnology,Inc.(“AspenTech”).All rightsreserved. Thisworkmaynot be
reproducedordistributedinanyformor byany meanswithoutthe priorwrittenconsentof
AspenTech. ASPENTECHMAKESNOWARRANTYOR REPRESENTATION,EITHER EXPRESSEDOR IMPLIED, WITH
RESPECT TO THIS WORK and assumesnoliabilityforanyerrorsor omissions. Innoeventwill AspenTechbe
liable toyoufordamages,includinganylossof profits,lostsavings,orotherincidental orconsequential
damagesarisingoutof the use of the informationcontainedin,orthe digital filessuppliedwithorforuse with,
thiswork. This workand itscontentsare providedforeducational purposesonly.
AspenTech®,aspenONE®,andthe Aspenleaf logo,are trademarksof AspenTechnology,Inc.. Brandsand
productnamesmentionedinthisdocumentationare trademarksorservice marksof theirrespective companies.
Thermodynamics for Chemical Engineers
Prop-001H Revised:Nov16,2012
1
Generate Ethylene Vapor Pressure Curves with Aspen HYSYS® V8.0
1. Lesson Objectives
 Generate vaporpressure curvesforEthylene
2. Prerequisites
 Aspen HYSYS V8.0
 Introductiontovapor-liquidequilibrium
3. Background
Separationprocessesinvolvingvapor-liquidequilibrium exploitvolatilitydifferenceswhich are indicatedbythe
components’ vaporpressure. Highervaporpressure meansacomponentismore volatile.
Ethylene isanimportantmonomerforpolymersandthere are manyethyleneplantsaroundthe world. A vital
stepinethylene productionisseparatingitfromothercompoundsandasa resultthe vapor pressure of
ethylene isanimportantphysical propertyforethyleneproduction.
The examplespresentedare solelyintendedtoillustrate specificconceptsand principles. Theymay not
reflectan industrial application or real situation.
4. Problem Statement and Aspen HYSYS Solution
Problem Statement
Determine the vaporpressure of ethylene at5 °C, and itsnormal boilingpoint. Alsocreate aplotof vapour
pressure versustemperature.
Aspen HYSYS Solution
4.01. Create a newsimulationin AspenHYSYSV8.0.
4.02. Create a componentlist. Inthe ComponentList folderselectAdd. AddEthylene tothe componentlist.
Prop-001H Revised:Nov16,2012
2
4.03. Double clickon Ethylene to viewthe pure componentproperties. Goto the Critical tab. Make a note
that the Critical Temperature is9.2°C and the Normal BoilingPoint is-103.8°C.
Prop-001H Revised:Nov16,2012
3
4.04. Define propertymethods. Goto the FluidPackages folderandclick Add. SelectPeng-Robinsonasthe
propertypackage.
4.05. Move to the simulationenvironment. Clickthe Simulationbuttoninthe bottomleftof the screen.
4.06. Adda Material Stream to the flowsheet.
Prop-001H Revised:Nov16,2012
4
4.07. Double clickonmaterial stream(1).The vapor pressure of liquidisthe atmosphericpressureatwhicha
pure liquidboilsata giventemperature. The pointatwhichthe firstdropof liquidbeginstoboil is
calledthe bubble point,whichisfoundinHYSYSby specifyingavapourfraction of 0. Therefore,we can
findthe vaporpressure of pure liquidbyspecifyingatemperature andvapourfractionof 0.
4.08. In material stream 1,entera Vapour Fraction of 0, a Temperature of 5°C, and a Molar Flow of 1
kgmole/h. In the Compositionformunderthe Worksheettab entera Mole Fraction of 1 for Ethylene.
4.09. You can see that the Pressure is45.93 bar. Thisis equivalenttothe vapourpressure of ethylene atthis
temperature. Nextwe wouldliketodetermine the normal boilingpointof ethylene. Insteadof
specifyingtemperature,we will specifypressure. Emptythe fieldfortemperature andenteravalue of 1
bar forPressure.
Prop-001H Revised:Nov16,2012
5
4.10. The newlycalculatedtemperature is -104.3°C. Thisisthe boilingtemperature of ethylene atapressure
of 1 bar.
4.11. Nextwe wouldlike tocreate aplotof vapourpressure versustemperature. First,inthe Material
Stream 1 window,emptythe fieldfor Pressure andenterany Temperature (below critical temperature).
Thiswill allowustovary temperature whenwe performacase study. Go to the Case Studiesfolderin
the Navigation Pane and click Add.
Prop-001H Revised:Nov16,2012
6
4.12. In Case Study 1, click Add to selectthe variables. Select the Temperature andPressure of stream1. In
the IndependentVariable fieldenteraLow Bound of -150°C, a High Bound of 0°C, and a Step Size of
10°C. Click Run.
Prop-001H Revised:Nov16,2012
7
4.13. Afterrunningthe case study,go to the Plotstab. Here youwill see aplotof Pressure vs Temperature.
Prop-001H Revised:Nov16,2012
8
4.14. Note that bylookingatthe plotyoucan verifythatat around -104°C the vapourpressure if
approximately1bar, indicatingthe normal boilingpoint.
5. Conclusions
As we can see fromthe generated plot,ethylene isaveryvolatile component. At5°C, itsvapor pressure is
about45.93 bar. From thisanalysis,we alsosee thatethylene’s normal boilingpointtemperature isabout –104
°C.
6. Copyright
Copyright© 2012 by AspenTechnology,Inc. (“AspenTech”). All rightsreserved. Thisworkmaynotbe
reproducedordistributedinanyformor byany meanswithoutthe priorwrittenconsentof
AspenTech. ASPENTECHMAKESNOWARRANTYOR REPRESENTATION,EITHER EXPRESSEDOR IMPLIED, WITH
RESPECT TO THIS WORK and assumesnoliabilityforanyerrorsor omissions. Innoeventwill AspenTechbe
liable toyoufordamages,includinganylossof profits,lostsavings,orotherincidental orconsequential
damagesarisingoutof the use of the informationcontainedin,orthe digital filessuppliedwithorforuse with,
thiswork. This workand itscontentsare providedforeducational purposesonly.
AspenTech®,aspenONE®,andthe Aspenleaf logo,are trademarksof AspenTechnology,Inc.. Brandsand
productnamesmentionedinthisdocumentationare trademarksorservice marksof theirrespective companies.
Prop-003H Revised:Nov5,2012
1
Retrieve Pure Component Property Data with Aspen HYSYS® V8.0
1. Lesson Objectives
 Learn howto retrieve property dataforpure componentsinAspen HYSYS.
2. Prerequisites
 AspenHYSYS V8.0
3. Background
There are manyreasonsthat we needphysical propertiesof pure components.
Whenwe lookfor a solventforextractive distillation(atechnologythatusesathirdcomponent,the solvent,to
separate twocomponentsinamixture thatare difficulttoseparate directlyviadistillation),we lookfor
componentswithnormal boilingpointtemperaturesthatare higher(butnottoo muchhigher) thanthe
componentstobe separated. Forsuch a case,we needtoknow the normal boilingpointtemperaturesof
candidate solventsduringthe search.
Whenwe lookfor a solventforextraction,we needtocheckthe densitiesof candidatesolventstoensure the
twoliquidphasesformedduringextractionhave enoughdifferencesindensity. Forthe selectedsolvent,we
alsoneedto checkitsdensityagainstthe existingliquidphase sothatwe know whichliquidphaseisheavier.
The examplespresentedare solelyintendedtoillustrate specificconceptsand principles. Theymay not
reflectan industrial application or real situation.
4. Problem Statement and Aspen HYSYS Solution
Problem Statement
The pre-conditionof thisexample isthat3-methylhexaneisnow consideredapromisingcandidatesolventfor
separationof acetone andwater. The task is to determinewhetherthe densityof 3-methylhexane isdifferent
enoughfrom the density of water. We alsoneedto determinewhichof the twoliquidphasesformedmainlyby
these twocomponentsisheavier.
Prop-003H Revised:Nov5,2012
2
Aspen HYSYS Solution
4.01. Create a new case inAspenHYSYS V8.0.
4.02. Create a componentlist. Inthe ComponentLists folderselectthe Addbuttonto add a new component
list.
Prop-003H Revised:Nov5,2012
3
4.03. Enter 3-methylhexane inthe Searchfor box. Aspen HYSYS shoulddisplaythe relevantsearchresults. If
the componentyouare lookingfordoesnotappear, you can alsouse the Filteror Search by drop-down
listfordifferentsearchcriteria. Clickthe < Addbuttonto add the componentto the componentlist.
Prop-003H Revised:Nov5,2012
4
4.04. To retrieve andviewthe pure componentproperty dataand, double-clickthe component 3-Mhexane.A
newwindowshouldappear.
4.05. Go to the Critical tab inthe newwindow.Youwill see alistof property datainthe Base Propertiesand
Critical Properties frames. Note thatthe Ideal Liquid Densityfor3-methylhexane is690.2 kg/m3
.
Prop-003H Revised:Nov5,2012
5
4.06. In the navigationpane, gotothe Components| ComponentList -1 sheet. Enterwater inthe Search for
box and add the componenttothe componentlist.
Prop-003H Revised:Nov5,2012
6
4.07. Double-clickonthe component H2O. A new window shouldappear.
Prop-003H Revised:Nov5,2012
7
4.08. Go to the Critical tab inthe newwindow. Youwill see alistof property datainthe Base Propertiesand
Critical Properties frames. Note thatthe Ideal Liquid DensityforWater is998.0 kg/m3
.
5. Conclusions
The densityof 3-methylhexane isaround690.2 kg/m3
,whichisclearlylessthan the density of water(998.0
kg/m3
).The liquidphase formedmainlyby3-methylhexane shouldbe lighterthanthe phase formedmainlyby
waterand, thus,the aqueousphase shouldbe atthe bottomand the otherliquidphase shouldbe atthe top.
Prop-003H Revised:Nov5,2012
8
6. Copyright
Copyright© 2012 by AspenTechnology,Inc.(“AspenTech”).All rightsreserved. Thisworkmaynot be
reproducedordistributedinanyformor byany meanswithoutthe priorwrittenconsentof
AspenTech. ASPENTECHMAKESNOWARRANTYOR REPRESENTATION,EITHER EXPRESSEDOR IMPLIED, WITH
RESPECT TO THIS WORK and assumesnoliabilityforanyerrorsor omissions. Innoeventwill AspenTechbe
liable toyoufordamages,includinganylossof profits,lostsavings,orotherincidental orconsequential
damagesarisingoutof the use of the informationcontainedin,orthe digital filessuppliedwithorforuse with,
thiswork. This workand itscontentsare providedforeducational purposesonly.
AspenTech®,aspenONE®,andthe Aspenleaf logo,are trademarksof AspenTechnology,Inc.. Brandsand
productnamesmentionedinthisdocumentationare trademarksorservice marksof theirrespective companies.
Prop-005H Revised:Nov7,2012
1
Hypothetical Components and Petroleum Assays
with Aspen HYSYS® V8.0
1. Lesson Objectives
 Create hypothetical componentsinAspenHYSYS
 Characterize apetroleumassay
2. Prerequisites
 Aspen HYSYS V8.0
3. Background
AspenHYSYS allowsyoutocreate non-libraryorHypothetical components. These hypothetical componentscan
be pure components,definedmixtures,undefinedmixtures,orsolids. A wide selectionof estimationmethods
are providedforvariousHypogroupstoensure the bestrepresentationof behaviorfor the Hypothetical
componentinthe simulation.
In orderto accuratelymodel aprocesscontaininga crude oil,suchas a refineryoperation,the oil properties
mustbe defined. Itisnearlyimpossible todeterminethe exactcompositionof anoil assay,as there are far too
manycomponentsinthe mixture. Thisis a situation where hypothetical components are useful. Boilingpoint
measurementsof distillate fractionsof anassaycan be usedto characterize the oil properties.
The examplespresentedare solelyintendedtoillustrate specificconceptsand principles. Theymay not
reflectan industrial application or real situation.
4. Problem Statement and Aspen HYSYS Solution
Problem Statement
Create a hypothetical componentgroupinAspenHYSYSandcharacterize a petroleumassaytobe usedina
refinerysimulation.
Aspen HYSYS Solution
4.01. Start a newsimulationin AspenHYSYSV8.0.
4.02. Create a componentlist. Inthe ComponentLists folderselectAdd. Change the Selectfieldto
Hypothetical and enterthe Initial and Final BoilingPoints for the hypothetical group shownbelow.
ClickGenerate Hypos whencomplete. Thiswillgenerateagroupof hypothetical componentswith
estimatedpropertiesbasedonthe specifiedboilingpointof eachcut.
Prop-005H Revised:Nov7,2012
2
4.03. ClickAdd All to add the entire hypothetical grouptothe componentlist.
Prop-005H Revised:Nov7,2012
3
4.04. Define propertypackage. Inthe FluidPackagesfolderselectAdd. SelectPeng-Robinsonasthe
propertypackage.
4.05. Enter the simulationenvironmentbyclickingthe Simulationbuttoninthe bottomleftof the screen.
Prop-005H Revised:Nov7,2012
4
4.06. Adda Material Stream to the flowsheetfromthe Model Palette. Doubleclickthe streamandgo to the
Compositionformunderthe Worksheettab.
4.07. You will notice thatthe mole fractionsof all the componentsare empty. If youwouldlike toassignan
oil assayto thisstreamgo to the PetroleumAssayform underthe Worksheettab. Selectthe option
Create New Assay On Stream.
Prop-005H Revised:Nov7,2012
5
4.08. Clickthe PetroleumAssay Specifications button. Thispage allowsyoutoenterassaydistillationdataor
importdata froma knownoil assay.
Prop-005H Revised:Nov7,2012
6
4.09. Clickthe Import From buttonand select AssayLibrary to importdata froma knownassayinthe HYSYS
assaylibrary.
4.10. Say,for example,thatwe wanttomodel a refineryprocessusingBachaqueroheavycrude from
Venezuela. Scroll downthe listof assaysandselect Bachaquero,Venezuela. Click ImportSelected
Assay.
Prop-005H Revised:Nov7,2012
7
4.11. Aftera fewmomentsthe MacroCutData window will be filledwithdistillationcutdatafor Bachaquero
heavycrude.
4.12. Clickthe Calculate Assay buttonto assign mole fractionstothe hypothetical componentsdefinedfor
the stream. Exit the MacroCut Data window andview the Componentsformof the material stream.
Prop-005H Revised:Nov7,2012
8
4.13. The compositionforthe streamisnow definedandwill model the propertiesof the selectedpetroleum
assaythrough the use of hypothetical components.
5. Conclusions
Thisexample demonstrateshowtocreate hypothetical componentsandhow toassigna petroleumassaytoa
streamin orderto model the assaypropertiesinasimulation.
6. Copyright
Copyright© 2012 by AspenTechnology,Inc.(“AspenTech”).All rightsreserved. Thiswork maynot be
reproducedordistributedinanyformor byany meanswithoutthe priorwrittenconsentof
AspenTech. ASPENTECHMAKESNOWARRANTYOR REPRESENTATION,EITHER EXPRESSEDOR IMPLIED, WITH
RESPECT TO THIS WORK and assumesnoliabilityforanyerrors or omissions. Innoeventwill AspenTechbe
liable toyoufordamages,includinganylossof profits,lostsavings,orotherincidental orconsequential
damagesarisingoutof the use of the informationcontainedin,orthe digital filessuppliedwithor foruse with,
thiswork. This workand itscontentsare providedforeducational purposesonly.
AspenTech®,aspenONE®,andthe Aspenleaf logo,are trademarksof AspenTechnology,Inc.. Brandsand
productnamesmentionedinthisdocumentationare trademarksorservice marksof theirrespective companies.
Thermo-002H Revised:Nov6,2012
1
Flash Calculation in Aspen HYSYS® V8.0
1. Lesson Objective
 Learn howto model aFlash separatorand examine differentthermodynamicmodelstosee how
theycompare.
 FlashblocksinAspen HYSYS
2. Prerequisites
 Aspen HYSYS V8.0
3. Problem
We wantto investigate Vapor-Liquidseparationatdifferent pressures,temperaturesandcompositions.Assume
youhave a feedwith anequimolarbinarymixture of ethanolandbenzeneat1 bar and 25°C. Examine the
followingflashconditionsusingthe heaterblockinAspenHYSYS.Use Vapor-Liquidasthe ValidPhase inthe
computation.
 Condition#1(P-VFlash):At 1 bar and a vapor fraction of 0.5, findthe equilibriumtemperature and
the heat duty.
 Condition#2(T-P Flash):At the temperature determined fromCondition#1 and a pressure of 1 bar,
verify thatthe flashmodel resultsina vapor fraction of 0.5 at equilibrium.
 Condition#3(T-V Flash):Atthe temperature of Condition#1,and a vaporfraction of 0.5, verifythat
the flashmodel resultsinan equilibriumpressure of 1bar.
 Condition#4(P-Q Flash):At1 bar and withthe heatduty determinedfrom Condition#1, verifythat
the temperature andvaporfractionare consistent withprevious conditions.
 Condition#5(T-Q Flash):At the temperature andheatdutydeterminedfromCondition#1,verify
that the pressure andvaporfraction are consistentwithpreviousconditions.
The examplespresentedare solelyintendedtoillustrate specificconceptsand principles. Theymay not
reflectan industrial application or real situation.
4. Aspen HYSYS Solution:
4.01. Start AspenHYSYS V8.0. SelectNewtostart a new simulation.
4.02. Create a componentlist. Inthe ComponentLists folderselectAdd. SelectEthanol and Benzene.
Thermo-002H Revised:Nov6,2012
2
4.03. Create a fluid package. In the Fluid Packages folder select Add, and select NRTL as the property package.
4.04. Go to the simulationenvironment. Clickthe Simulationbuttoninthe bottomleftof the screen.
4.05. Place a Heater blockontothe flowsheetfromthe Model Palette.
Thermo-002H Revised:Nov6,2012
3
4.06. Double click the Heaterto openthe propertywindow.Create an Inletstreamcalled FEED,an Outlet
streamcalled OUT, and an Energy streamcalled Q.
4.07. Specifyconditionsof FEEDstream. Go to the Worksheettaband entera Temperature of 25°C, a
Pressure of 1 bar (100 kPa),anda Molar flowof 1 kgmole/h. AlsoenterMole Fractionsof 0.5 foreach
componentonthe Compositionform.
Thermo-002H Revised:Nov6,2012
4
4.08. Condition#1 Compute the temperature toget0.5 vapor fractionat 1 bar. In the Conditionsformunder
Worksheet,enteraVapour Fraction of 0.5 and a Pressure of 1 bar (100 kPa) for streamOUT. The
heaterwill automaticallysolve andyouwill see thatthe calculatedtemperature is 67.03°C.
4.09. Condition#2 Compute vaporfractionat 1 bar andat the temperature obtained inCondition#1. Clear
the fieldforVapour Fraction forstreamOUT, thenentera Pressure of 1 bar (100 kPa) and a
Temperature of 67.03°C. Inorder to be able to entera temperature,youmustfirstemptythe entry
fieldforVapourFraction. This isdone by clickingthe entryfieldand pressingdeleteonthe keyboard.
Once a Temperature isentered,the VapourFraction will solve.
Thermo-002H Revised:Nov6,2012
5
4.10. Condition#3 Compute pressure atthe temperature obtainedinCondition#1with0.5 vapor fraction.
Delete the value inthe Pressure fieldandenteraVapour Fraction of 0.5. The pressure shouldsolve.
Thermo-002H Revised:Nov6,2012
6
4.11. Condition#4 Compute temperature andvaporfraction at1 bar and usingthe heatduty obtainedin
Condition#1. Empty the fieldsforTemperature andVapour Fraction instreamOUT. InstreamOUT
entera Pressure of 1 bar. In streamQ, entera Heat Flow of 2.363e004 kJ/h. The Temperature of
67.03°C and Vapour Fraction of .500 are consistentwithCondition#1.
4.12. Condition#5 Compute pressure andvaporfractionat the temperature andheatdutyobtained in
Condition#1. In streamOUT, emptythe fieldforPressure. Entera Temperature of 67.03°C. The
Pressure and Vapor Fraction shouldbe the same as Condition#1.
Thermo-002H Revised:Nov6,2012
7
5. Conclusion
You have gone through the five flashmethodswhichare mostcommoninAspenHYSYS.Here isa brief
summary.
Flash Method T (C) P (bar) V (-) Q (MJ/hr)
P-V Flash 67.03 1 0.5 23.63
T-P Flash 67.03 1 0.5099 23.98
T-V Flash 67.03 1 0.5 23.63
P-Q Flash (or P-H) 67.03 1 0.5 23.63
T-Q Flash (or T-H) 67.03 1 0.5 23.63 Specified Computed
FeedCondition:ETHANOL/BEZENE(Equimolarmixture) at1 bar and 25 Celsius.
Thermo-002H Revised:Nov6,2012
8
6. Copyright
Copyright© 2012 by AspenTechnology,Inc.(“AspenTech”). All rightsreserved. Thisworkmaynot be
reproducedordistributedinanyformor byany meanswithoutthe priorwrittenconsentof
AspenTech. ASPENTECHMAKESNOWARRANTYOR REPRESENTATION,EITHER EXPRESSEDOR IMPLIED, WITH
RESPECT TO THIS WORK and assumesnoliabilityforanyerrorsor omissions. Innoeventwill AspenTechbe
liable toyoufordamages,includinganylossof profits,lostsavings,orotherincidental orconsequential
damagesarisingoutof the use of the informationcontainedin,orthe digital filessuppliedwithorforuse with,
thiswork. This workand itscontentsare providedforeducational purposesonly.
AspenTech®,aspenONE®,andthe Aspenleaf logo,are trademarksof AspenTechnology,Inc.. Brandsand
productnamesmentioned inthisdocumentationare trademarksorservice marksof theirrespective companies.
Thermo-003H Revised:Nov6,2012
1
Steam Tables in Aspen HYSYS® V8.0
1. Objective
Learn howto access SteamTablesinAspen HYSYS,and how to interpretthe SteamTable data.
2. Prerequisites
 Aspen HYSYS V8.0
3. Background
Aspen HYSYS offers 2typesof SteamTablesPropertiesMethods:
Property Method Name Models (Steam
Tables)
Note
ASME Steam ASME 1967
The ASME Steampropertymethodusesthe:
 1967 International Associationfor
Propertiesof WaterandSteam(IAPWS,
http://www.iapws.org) correlationsfor
thermodynamicproperties
STEAM-TA methodismade upof different
correlationscoveringdifferentregionsof the P-T
space.These correlationsdonotprovide
continuityatthe boundaries,whichcanleadto
convergence problemsandpredictwrongtrends.
NBS Steam NBS 1984
The NBS Steampropertymethodsusesthe:
 1984 International Associationfor
Propertiesof WaterandSteam(IAPWS,
http://www.iapws.org) correlationsfor
thermodynamicproperties
Use the NBS Steampropertymethod forpure
waterand steamwithtemperature rangesof
273.15 K to 2000 K. The maximumpressure is
over10000 bar.
The examplespresentedare solelyintendedtoillustrate specificconceptsand principles. Theymay not
reflectan industrial application or real situation.
Thermo-003H Revised:Nov6,2012
2
4. Problem
UsingAspen HYSYS, we wantto calculate saturatedsteamproperties from100°C to 300°C. We wouldlike to
create a table thatdisplaysmassenthalpy,massentropy,pressure,anddensity.
Aspen HYSYS Solution:
4.01. Start AspenHYSYS V8.0. SelectNewto start a new simulation.
4.02. Create a componentlist. Inthe ComponentLists folder,selectAdd. AddWaterto the componentlist.
4.03. Create a fluidpackage. Inthe FluidPackages folder,selectAdd. SelectNBSSteamas the property
package.
4.04. Go to the simulationenvironment.
Thermo-003H Revised:Nov6,2012
3
4.05. Adda material streamtothe flowsheetfromthe Model Palette.Double clickonthe streamtoopenthe
propertywindow. Rename thisstream STEAMandentera Mole Fraction of 1 forwater.
4.06. In the navigationpane,goto Stream Analysis andclick onthe dropdownarrow nextto Add and select
Property Table. In the SelectProcess Stream window thatappears,select STEAMandpress OK.
4.07. Next,double clickon PropertyTable-1to openthe propertywindow. UnderIndependentVariables
selectTemperature asVariable 1. Enter a Lower Bound of 100°C and an UpperBound of 300°C. Enter
100 for# of Increments. SelectVapourFraction for Variable 2 andselectState forMode. Entera value
of 1 for State Values. We are goingto be varyingthe temperature while holdingthe vapourfraction
constantat 1.
Thermo-003H Revised:Nov6,2012
4
4.08. We mustnowdefine the dependentpropertiesthatwe are interestedinviewingresultsfor. Goto the
Dep. Prop formunderthe Design tab. SelectAdd. Here we will add Mass Enthalpy,Mass Entropy,
Pressure,andMass Density.
Thermo-003H Revised:Nov6,2012
5
4.09. ClickCalculate to generate the propertytable. Resultscanbe viewedinthe Performance tabof the
propertytable window.
Thermo-003H Revised:Nov6,2012
6
5. Conclusion
Aftercompletingthisexercise youshouldnow be familiarwithhow toaccessandinterpretthermodynamic
propertiesforsteamusingAspen HYSYS.
6. Copyright
Copyright © 2012 by Aspen Technology, Inc. (“AspenTech”). All rights reserved. This work may not be
reproduced or distributed in any form or by any means without the prior written consent of
AspenTech. ASPENTECH MAKES NO WARRANTY OR REPRESENTATION, EITHER EXPRESSED OR IMPLIED, WITH
RESPECT TO THIS WORK and assumes no liability for any errors or omissions. In no event will AspenTech be
liable to you for damages, including any loss of profits, lost savings, or other incidental or consequential
damages arising out of the use of the information contained in, or the digital files supplied with or for use with,
thiswork. This workand itscontentsare providedforeducational purposesonly.
AspenTech®,aspenONE®,andthe Aspenleaf logo,are trademarksof AspenTechnology,Inc.. Brandsand
productnamesmentionedinthisdocumentationare trademarksorservice marksof theirrespective companies.
Thermo-004H Revised:Nov6,2012
1
Heat of Vaporization with Aspen HYSYS® V8.0
1. Lesson Objectives
 Learn howto calculate heatof vaporizationusingthe heaterblockinAspen HYSYS
 Understandthe impactof heatof vaporizationondistillation
2. Prerequisites
 Aspen HYSYS V8.0
3. Background
The drivingforce fordistillationisenergy. The mostenergyconsumingpartof a distillationcolumnis the
vaporizationof material inthe reboilertocause vaporto flow fromthe bottomof the columntothe topof the
column. Heatof vaporizationdeterminesthe amountof energyrequired. Therefore,itisimportanttoknowthe
heatof vaporizationof variousspeciesduringsolventselection. Witheverythingelse equal,we shouldselecta
componentwithlowerheatof vaporizationsothatwe can achieve the same degree of separationwithless
energy. Thisexample containsthree isolated heaterblocks. Each heaterblockis usedtocalculate the heatof
vaporizationforapure component.
The examplespresentedare solelyintendedtoillustrate specificconceptsand principles. Theymay not
reflectan industrial application or real situation.
Thermo-004H Revised:Nov6,2012
2
4. Aspen HYSYS Solution:
4.01. Create a newsimulationin AspenHYSYSV8.0.
4.02. Create a componentlist. Inthe ComponentLists folder,selectAdd. SelectWater,3-methylhexane,
and 1,1,2-trichloroethane.
4.03. Create a fluidpackage. Inthe FluidPackages folder,selectAdd. SelectUNIQUACasthe property
package and select RK as the Vapour Model.
4.04. Enter the simulationenvironment.
Thermo-004H Revised:Nov6,2012
3
4.05. Addthree separate Heaterblocks to the flowsheet.
4.06. Double clickon E-100 to openthe propertywindow. Thisfirstheaterwill vaporize astreamof pure
water. Create an Inletstreamcalled Feed-Water,anOutletstreamcalled Water-Out,andanEnergy
streamcalled Q-Water.
Thermo-004H Revised:Nov6,2012
4
4.07. Go to the Worksheettab. Specifythe feedstreamtobe at a Pressure of 100 kPa, a Vapour Fraction of
0, and witha Molar Flow of 1 kgmole/h. Inthe Compositionformunderthe Worksheettab,entera
Mole Fraction of 1 for Water inthe feedstream. Lastly,we mustspecifythe outletpressure andthe
outletvapourfraction. Enter 100 kPa for Pressure,and1 forVapour Fraction of the Water-Outstream.
The heatershouldsolve.Make note of the Heat Flow of the energystream Q-Water.
4.08. We will nowrepeatthisprocessforheaters E-101 and E-102. E-101 will vaporize 3-methylhexaneandE-
102 will vaporize 1,1,2-trichloroethane.
4.09. Double clickon E-101. Create an Inletstream called Feed-3MH,anOutletstreamcalled 3MH-Out,and
an Energy streamcalled Q-3MH.
Thermo-004H Revised:Nov6,2012
5
4.10. In the Worksheettab,for the feedstreamentera Vapour Fraction of 0, a Molar Flowof 1 kgmole/h,
and a Pressure of 100 kPa. Inthe Compositionform, enteraMole Fraction of 1 for3-methylhexane in
the feedstream. Lastlyspecifythe outletconditionsof 100 kPa for Pressure anda Vapour Fraction of 1.
Make note of the Heat Flowfor the energystream.
Thermo-004H Revised:Nov6,2012
6
4.11. Double click E-102. Create an Inlet streamcalled Feed-1,1,2,anOutletstreamcalled 1,1,2-Out, and an
Energy streamcalled Q-1,1,2.
4.12. In the Worksheettab,for the feedstreamentera Vapour Fraction of 0, a Molar Flowof 1 kgmole/h,
and a Pressure of 100 kPa. Inthe Compositionform, enteraMole Fraction of 1 for1,1,2-
trichloroethane inthe feedstream. Lastlyspecifythe outletconditionsof 100 kPa for Pressure anda
Vapour Fraction of 1. Note the Heat Flowof the energystream.
Thermo-004H Revised:Nov6,2012
7
5. Conclusions
Althoughwaterhassmall molecularweight,itsheatof vaporizationislarge. Heatof vaporizationforwateris
about18% higherthanthat of 1,1,2-trichloroethaneandabout30% higherthanthat of 3-methylhexane. Of the
three options,3-methylhexane hastolowestheatof vaporizationandwould require the leastamountof energy
as a solventina distillation.
6. Copyright
Copyright© 2012 by AspenTechnology,Inc.(“AspenTech”).All rightsreserved. Thisworkmaynot be
reproducedordistributedinanyformor byany meanswithoutthe priorwrittenconsentof
AspenTech. ASPENTECHMAKESNO WARRANTYOR REPRESENTATION,EITHER EXPRESSEDOR IMPLIED, WITH
RESPECT TO THIS WORK and assumesnoliabilityforanyerrorsor omissions. Innoeventwill AspenTechbe
liable toyoufordamages,includinganylossof profits,lostsavings,orotherincidental orconsequential
damagesarisingoutof the use of the informationcontainedin,orthe digital filessuppliedwithorforuse with,
thiswork. This workand itscontentsare providedforeducational purposesonly.
AspenTech®,aspenONE®,andthe Aspenleaf logo,are trademarksof AspenTechnology,Inc.. Brandsand
productnamesmentionedinthisdocumentationare trademarksorservice marksof theirrespective companies.
Therm-005H Revised:Nov6,2012
1
Simulation of Steam Engine with Aspen HYSYS® V8.0
1. Lesson Objectives
 Learn howto simulate asteamengine withAspen HYSYS
 Learn how to specifypumps,heaters,coolers,expanders
2. Prerequisites
 Aspen HYSYS V8.0
 Introductorythermodynamics
3. Background
A steamengine consistsof the followingsteps:
 Water ispumpedintoa boiler usingapump.
 Water isvaporizedin a boilerandbecomeshigh temperature and pressure steam.
 Steamflowsthrougha turbine anddoeswork. The pressure andtemperature godownduringthis
step. The steam isalsopartiallycondensed.
 The steam isfurthercooledtobe condensedcompletely. Then,itisfedtothe pumpmentionedin
the firststepto be re-used.
The examplespresentedare solelyintendedtoillustrate specificconceptsand principles. Theymay not
reflectan industrial application or real situation.
4. Aspen HYSYS Solution
4.01. Create a newsimulationin AspenHYSYSV8.0.
4.02. Create a componentlist. Inthe ComponentLists folder,selectAdd. AddWaterto the componentlist.
Therm-005H Revised:Nov6,2012
2
4.03. Create a fluidpackage. Inthe FluidPackages folder,selectAdd.SelectNBSSteam as the property
package.
4.04. Go to the simulationenvironmentbyclickingthe Simulationbuttoninthe bottomleftof the screen. In
the Home ribbon,selectEuroSIas the Unit Set.
4.05. Enter the simulationenvironment. Adda Heater,a Cooler,a Pump andan Expander as shown inthe
flowsheet.
Therm-005H Revised:Nov6,2012
3
4.06. Double clickthe pump(P-100) to openthe pumpspecificationwindow.Createan Inletstreamcalled
Liq-Water,anOutlet streamcalledToBoiler,andan Energy streamcalled Q-Pump.
4.07. In the Worksheettab,specifyanoutlet Pressure of 1.2 bar.
Therm-005H Revised:Nov6,2012
4
4.08. Double clickthe heater(E-100). SelectToBoileras the Inletstream, create an Outletstreamcalled
HPSteam (highpressure steam),andcreate an Energystream called Q-Heat.
4.09. In the Worksheettab,specifyanoutlet Pressure of 40 bar, and a Temperature of 460°C.
Therm-005H Revised:Nov6,2012
5
4.10. Double clickthe expander(K-100). SelectHPSteamasthe Inletstream, create an Outletstreamcalled
LPSteam, andcreate an Energystream called Q-Expand.
Therm-005H Revised:Nov6,2012
6
4.11. In the Worksheettab,specifyanoutlet Pressure of 1 bar.
Therm-005H Revised:Nov6,2012
7
4.12. Double clickthe cooler(E-101).Selectan Inlet streamof LPSteam, an Outletstreamof Liq-Water,and
create an Energy streamcalled Q-Cool.
Therm-005H Revised:Nov6,2012
8
4.13. In the Worksheettab,specifyanoutlet VapourFraction of 0 anda Pressure of 1 bar.
4.14. The flowsheetisnowreadytosolve. All thatislefttodo isto specifythe compositionandflowrate of a
streamwithinthe loop. Double clickonstream Liq-WaterandspecifyaMole Fraction of 1 for Water
and a Mass Flow if 10,000 kg/h.
Therm-005H Revised:Nov6,2012
9
Therm-005H Revised:Nov6,2012
10
4.15. The flowsheetshouldnowsolve.
5. Conclusions
The steam engine systemcanbe simulatedusingAspen HYSYS. Thisflowsheetclearlyshowswhereenergyis
beinginputtothe systemandwhere energyisbeingreleased.
6. Copyright
Copyright© 2012 by AspenTechnology,Inc.(“AspenTech”). All rightsreserved. Thisworkmaynot be
reproducedordistributedinanyformor byany meanswithoutthe priorwrittenconsentof
AspenTech. ASPENTECHMAKESNOWARRANTYOR REPRESENTATION,EITHER EXPRESSEDOR IMPLIED, WITH
RESPECT TO THIS WORK and assumesnoliabilityforanyerrorsor omissions. Innoeventwill AspenTechbe
liable toyoufordamages,includinganylossof profits,lostsavings,orotherincidental orconsequential
damagesarisingoutof the use of the informationcontainedin,orthe digital filessuppliedwithorforuse with,
thiswork. This workand itscontentsare providedforeducational purposesonly.
AspenTech®,aspenONE®,andthe Aspenleaf logo,are trademarksof AspenTechnology,Inc.. Brandsand
productnamesmentionedinthisdocumentationare trademarksorservice marksof theirrespective companies.
Thermo-006H Revised:Nov6,2012
1
Illustration of Refrigeration with Aspen HYSYS® V8.0
1. Lesson Objectives
 Learn howto specify compressors,heaters,andvalvesinAspen HYSYS
 Understand a refrigerationloop
2. Prerequisites
 Aspen HYSYS V8.0
 Introductorythermodynamics
3. Background
In a typical refrigerationsystem,the refrigerantstartsatroom temperature andambientpressure. It is
compressed, whichincreasesthe refrigerant’stemperature andpressuresoitisa superheatedvapor. The
refrigerantiscooledbyairwitha fan sothat it isclose to room temperature. Atthispoint,itspressure remains
highand the refrigeranthasbeencondensedto a liquid. Then,the refrigerantisallowedtoexpandthrough an
expansionvalve. Itspressure decreasesabruptly,causingflashevaporation,whichreduces the refrigerant’s
temperature significantly. The verycoldrefrigerantcanthencool a fluidpassedacrossa heatexchanger(e.g.,
air inan air conditioner). Of course,foran ACunitto work,the airthat is usedto cool downthe super-heated
refrigerantmustbe airoutside of the room;the airthat is cooledbythe coldrefrigerantisthe air inside the
room.
The examplespresentedare solelyintendedtoillustrate specificconceptsand principles. Theymay not
reflectan industrial application or real situation.
4. Aspen HYSYS Solution
Problem Statement
Determine the coolingcapacityof 300 kgmole/hof CFH2-CF3 whenallowedtoexpandfrom10bar to 1 bar.
Thermo-006H Revised:Nov6,2012
2
Aspen HYSYS Solution
4.01. Create a newsimulationin AspenHYSYSV8.0.
4.02. Create a componentlist. Inthe ComponentLists folderselectAdd. Add1,1,1,2-tetrafluoroethane to
the componentlist.
4.03. Create a fluidpackage. Inthe FluidPackages folder,selectAdd.SelectNRTL as the propertypackage.
4.04. Move to the simulation environment. Clickthe Simulationbuttoninthe bottomleftof the screen. In
the Home ribbon,selectEuroSi as the UnitSet.
4.05. Adda Compressor,a Cooler,a Heater, and a Valve to the mainflowsheet.
Thermo-006H Revised:Nov6,2012
3
4.06. Double clickonthe compressor(K-100). Create an Inletstreamcalled Vapor,an Outlet streamcalled
SuperHeat-Vapor,andan Energy streamcalled Q-Comp.
Thermo-006H Revised:Nov6,2012
4
4.07. In the Worksheettab,specifyanoutlet Pressure of 10 bar.
Thermo-006H Revised:Nov6,2012
5
4.08. Double clickthe Cooler(E-100). SelectSuperHeat-Vaporasthe Inletstream, create an Outlet stream
calledLiquid,andcreate an Energy streamcalled Q-Cool.
4.09. In the Worksheettab,specifyanoutlet Temperature of 30°C. Inthe Parametersform underthe Design
tab, entera Delta P of 0.
Thermo-006H Revised:Nov6,2012
6
4.10. Double clickthe valve (VLV-100). Selectstream Liquidasthe Inlet streamandcreate an Outletstream
calledLowP.
Thermo-006H Revised:Nov6,2012
7
4.11. In the Worksheettabspecifyanoutlet Pressure of 1 bar.
Thermo-006H Revised:Nov6,2012
8
4.12. Double clickonthe heater(E-101). SelectstreamLowP as the Inletstream, selectstream Vaporas the
Outletstream,and create an Energy streamcalled Q-Heat.
4.13. In the Worksheettab,specifyanoutlet Temperature of 25°C. Inthe Parametersform underthe Design
tab, specifyaDelta P of 0.
Thermo-006H Revised:Nov6,2012
9
We mustnowspecifythe molarflowrate andcompositionof the refrigerant. Double clickanystream,
for example stream Liquid. EnteraMolar Flow of 300 kgmole/h. In the Compositionformspecifya
Mole Fraction of 1 for the refrigerant.
Thermo-006H Revised:Nov6,2012
10
4.14. The flowsheetwill nowsolve.
Thermo-006H Revised:Nov6,2012
11
4.15. Checkresults. Toviewthe coolingcapacityof thisrefrigerationloop,doubleclickenergystream Q-Heat.
The stream isremoving 1.26e006 kcal/h, or approximately350kcal/sec.
5. Conclusions
Refrigerationisaprocesswhere heatmovesfromacolderlocationtoa hotterone usingexternal work(e.g.,a
compressor). We knowthatvaporizationof a liquidtakesheat. If there isnoexternal heatavailable,the heat
will come fromthe liquiditself byreducingitsowntemperature.
6. Copyright
Copyright© 2012 by AspenTechnology,Inc.(“AspenTech”). All rightsreserved. Thisworkmaynot be
reproducedordistributedinanyformor byany meanswithoutthe priorwrittenconsentof
AspenTech. ASPENTECHMAKESNOWARRANTYOR REPRESENTATION,EITHER EXPRESSEDOR IMPLIED, WITH
RESPECT TO THIS WORK and assumesnoliabilityforanyerrorsor omissions. Innoeventwill AspenTechbe
liable toyoufordamages,includinganylossof profits,lostsavings, orotherincidental orconsequential
damagesarisingoutof the use of the informationcontainedin,orthe digital filessuppliedwithorforuse with,
thiswork. This workand itscontentsare providedforeducational purposesonly.
AspenTech®,aspenONE®,andthe Aspenleaf logo,are trademarksof AspenTechnology,Inc.. Brandsand
productnamesmentionedinthisdocumentationare trademarksorservice marksof theirrespective companies.
Thermo-007H Revised:Nov6,2012
1
Maximum Fill up in Propane Tanks with Aspen HYSYS® V8.0
Using a Spreadsheet
1. Lesson Objectives
 How to calculate the maximumliquidlevel inpropane tanks
 How to accessstreamvariablesinAspen HYSYS
 How to configure aheaterblock
 How to use the Spreadsheettool toperformcustomizedcalculations
2. Prerequisites
 Aspen HYSYS V8.0
3. Background
Whena propane tank isfilledat25°C, we needtoleave enoughvolumefor liquidpropaneexpansiondue toan
increase intemperature. The hottestweathereverrecordedisabout58°C. In real life practices,propane tanks
are onlyfilledupto80-85% of the tank volume. Why? We know that propane expandswhenitisheatedup.
However,why80-85%?
We can answerthisquestionbyusingasimple flashcalculationinAspen HYSYS.
The examplespresentedare solelyintendedtoillustrate specificconceptsand principles. Theymay not
reflectan industrial application or real situation.
4. Problem Statement and Aspen HYSYS Solution
Problem Statement
Propane tanksare filledat25°C withliquefiedpropane. These tankswill be storedandusedinanenvironment
at 1 bar and ambienttemperature. Howmuch,intermsof volume %, caneach tankbe filledup to?
Thermo-007H Revised:Nov6,2012
2
Aspen HYSYS Solution
4.01. Create a newsimulationin AspenHYSYSV8.0.
4.02. Create a componentlist. Inthe ComponentLists folderselectAdd.AddPropane to the componentlist.
4.03. Create a fluidpackage. Inthe FluidPackagers folder,selectAdd.SelectPeng-Robinsonasthe property
package.
4.04. Go to the simulationenvironment. Clickthe Simulationbuttoninthe bottomleftof the screen.
4.05. Adda Heaterto the flowsheet.
Thermo-007H Revised:Nov6,2012
3
4.06. Double clickonthe heater(E-100). Create an Inletstream, an Outletstream, and an Energy stream,
named1, 2, andQ, respectively.
Thermo-007H Revised:Nov6,2012
4
4.07. Define feedstream. Goto the Worksheettab. For the feedstream, entera Vapour Fraction of 1, a
Temperature of 25°C, and a Molar Flowof 1 kgmole/h. Inthe Compositionform, enter1 forMole
Fraction of propane.
Thermo-007H Revised:Nov6,2012
5
4.08. Specify outletconditions. Forthe outletstream, entera Vapour Fraction of 0, and a Temperature of
58°C. The heatershouldsolve.
4.09. Adda Spreadsheettothe flowsheettocalculate the maximumpercenttofill the propane tanktoallow
for expansionwhenheated.
Thermo-007H Revised:Nov6,2012
6
4.10. Double clickthe spreadsheet(SPRDSHT-1). Go to the Spreadsheettaband enterthe followingincells
A1, A2, andA3.
Thermo-007H Revised:Nov6,2012
7
4.11. Nowwe will linkflowsheetvariablestothe spreadsheet. Rightclickoncell B1 and selectImport
Variable.Make the followingselectionstoimportthe MolarDensity of stream1. Click OK when
complete.
4.12. Rightclickon cell B2 andselectImport Variable to importthe Molar Densityof stream2. Make the
followingselectionsandclick OK.
Thermo-007H Revised:Nov6,2012
8
4.13. The spreadsheetshouldnowlooklike the following.
4.14. Next,clickcell B3 andenter“=(B2/B1)*100”. Thisdividesthe molardensityat58°C bythe molardensity
at 25°C. The resultingnumberisthe percentage thatapropane tank shouldbe filledat25°C to allowfor
thermal expansionuptoa temperature of 58°C.
4.15. The maximumfill %of propane at 25°C is87.86%, as seeninthe spreadsheet.
Thermo-007H Revised:Nov6,2012
9
5. Conclusions
The calculation shows that the maximum fill up is 87.8% if the ambient temperature doesn’t exceed 58 °C. To
accommodate special cases, typically, propane tanks are filled up to 80-85%. After completing this exercise you
shouldbe familiarwithhowtocreate a spreadsheettoperformcustomcalculations.
It is important to note that, in real life, the content in a filled propane tank is typically a mixture instead of pure
propane. In addition to propane, the mixture also has a few other light components such as methane and
ethane. Therefore, to carry out calculations for a real project, we need to know the compositions of the mixture
we are dealingwith.
6. Copyright
Copyright © 2012 by Aspen Technology, Inc. (“AspenTech”). All rights reserved. This work may not be
reproduced or distributed in any form or by any means without the prior written consent of
AspenTech. ASPENTECH MAKES NO WARRANTY OR REPRESENTATION, EITHER EXPRESSED OR IMPLIED, WITH
RESPECT TO THIS WORK and assumes no liability for any errors or omissions. In no event will AspenTech be
liable to you for damages, including any loss of profits, lost savings, or other incidental or consequential
damages arising out of the use of the information contained in, or the digital files supplied with or for use with,
thiswork. This workand itscontentsare providedforeducational purposesonly.
AspenTech®, aspenONE®, and the Aspen leaf logo, are trademarks of Aspen Technology, Inc.. Brands and
productnamesmentionedinthisdocumentationare trademarksorservice marksof theirrespective companies.
Thermo-013H Revised:Nov7,2012
1
Generate PT Envelope with Aspen HYSYS® V8.0
1. Lesson Objectives
 Learn howto generate PTenvelopesinAspen HYSYS
2. Prerequisites
 Aspen HSYSY V8.0
3. Background
It isveryimportantto knowthe phase conditionsof amixture ata giventemperatureandpressure. For
example,the phase conditionsof afluidina heatexchangerhave animpacton the heat transferrate.
Formationof bubbles(vaporphase) ininletstreamscanalsobe verydamagingtopumps. The phase conditions
of a fluidina pipe canimpact pipeline calculations.
The PT envelope foragivenmixture providesacomplete picture of phase conditionsforagivenmixture.
The examplespresentedare solely intendedtoillustrate specificconceptsand principles. Theymay not
reflectan industrial application or real situation.
4. Aspen HYSYS Solution
4.01. Start AspenHYSYS V8.0 andstart a new simulation.
4.02. Create a componentlist. Inthe ComponentLists folderselectAdd. AddEthane and n-Pentane tothe
componentlist.
Thermo-013H Revised:Nov7,2012
2
4.03. Define propertypackage. Inthe FluidPackagesfolderselectAdd. SelectPeng-Robinsonasthe
propertypackage.
4.04. Go to the simulationenvironmentbyclickingthe Simulationbuttoninthe bottomleftof the screen.
4.05. Adda Material Stream to the flowsheet. Tocreate a PT Envelope we mustperforma StreamAnalysis,
and inorderto performa StreamAnalysiswe needamaterial stream.
Thermo-013H Revised:Nov7,2012
3
4.06. Double clickthe material stream(1). Entera Molar Flow of 100 kg/h. In the Compositionformenter
Mass Fractions of 0.5 foreach component.
4.07. Rightclickon the streamand select Create Stream Analysis| Envelope.
Thermo-013H Revised:Nov7,2012
4
4.08. In the Envelope window,gotothe Performance tab. Here you will see aPT Envelope. Note thatyou
can change the Envelope type usingthe radiobuttonsinthe bottomrightcorner of the window. Onthe
graph,the blue line representsthe dew pointandthe redline representsthe bubble point. The area
betweenthe lines representsthe 2-phase region.
Thermo-013H Revised:Nov7,2012
5
5. Conclusions
Withthe PT envelope of amixture,we candetermine itsphase conditionsforagiventemperature andpressure.
6. Copyright
Copyright© 2012 by AspenTechnology,Inc.(“AspenTech”). All rightsreserved. Thisworkmaynot be
reproducedordistributedinanyformor byany meanswithoutthe priorwrittenconsentof
AspenTech. ASPENTECHMAKESNOWARRANTYOR REPRESENTATION,EITHER EXPRESSEDOR IMPLIED, WITH
RESPECT TO THIS WORK and assumesnoliabilityforanyerrorsor omissions. Innoeventwill AspenTechbe
liable toyoufordamages,includinganylossof profits,lostsavings,orotherincidental orconsequential
damagesarisingoutof the use of the informationcontainedin,orthe digital filessuppliedwithorforuse with,
thiswork. This workand itscontentsare providedforeducational purposesonly.
AspenTech®,aspenONE®,andthe Aspenleaf logo,are trademarksof AspenTechnology,Inc.. Brandsand
productnamesmentionedinthisdocumentationare trademarksorservice marksof theirrespective companies.
Thermo-014H Revised:Nov7,2012
1
Retrograde Behavior Illustrated with Aspen HYSYS® V8.0
1. Lesson Objectives
 Observe retrograde behavior
2. Prerequisites
 Aspen HYSYS V8.0
 Completionof teachingmodule Thermo-013
3. Background
For a mixture,the amountof liquid(liquidfraction) increasesas pressure increasesatconstanttemperature.
However,inthe retrograde regionnearthe critical region,we maysee some interestingbehavior—vapor
fractionincreasesaspressure increases(atconstanttemperature).
Many mixtureshave retrograde behavior nearthe critical region. Inthisexample,we will examine the
retrograde behaviorusingabinary mixture of ethane and pentane.
The examplespresentedare solelyintendedtoillustrate specificconceptsand principles. Theymay not
reflectan industrial application or real situation.
4. Problem Statement and Aspen HYSYS Solution
Problem Statement
Retrograde behaviorcanbe observedinthe mixture of ethane andpentane.InAspen HYSYS,use PTEnvelope to
determine the critical regionof the mixture.Then,use aPropertyTable toexamine the retrograde behaviornear
the critical region.
Thermo-014H Revised:Nov7,2012
2
Aspen HYSYS Solution
4.01. Openthe file titled Thermo-14H_Retrograde_Behavrior_Start.hsc. Thisisidentical tothe file thatwas
createdinlessonThermo-013H_PT_Envelope.
4.02. In the PT Envelope that appearsinthe Performance tab of the Envelope window,notice thatthere isa
regionnearthe critical pointwhere the vaporfractionwill increase aspressure increaseswhile
temperature isheldconstant.
Thermo-014H Revised:Nov7,2012
3
4.03. We can demonstrate thisbehaviorbycreatingapropertytable inHYSYS. In the Stream Analysisfolder
inthe NavigationPane,click the dropdownarrow nextto Add and selectPropertyTable. Selectstream
1 and click OK.
Thermo-014H Revised:Nov7,2012
4
4.04. Double click PropertyTable-1. SelectTemperature forVariable 1 andselectState forMode. Entera
State value of 115°C. SelectPressure forVariable 2 and Incremental forMode. Entera Lower Bound
of 60 bar, an UpperBound of 69 bar, and a # of Incrementsof 20.
4.05. In the Dep. Prop formunderthe Design tab click Add. SelectVapourFraction and click OK.
Thermo-014H Revised:Nov7,2012
5
4.06. ClickCalculate.Once complete,gotothe Performance tab. Here youcan view the resultsineithertable
or plotform. Go to Plotsand selectViewPlot.
4.07. From the plotyoucan clearlysee the regionwhere increasingthe pressure will cause the vapour
fractionto increase.
5. Conclusions
For the binarymixture of ethane andpentane (50% eachon massbasis),we observedthatvaporfraction
increasesfrom0.701457 to 1 as pressure increasesfrom65.22 bar to 66.78 bar, whichisa retrograde behavior.
Thisretrograde behaviorcanbe a source of multiple solutionsto process simulation.
6. Copyright
Copyright© 2012 by AspenTechnology,Inc.(“AspenTech”).All rightsreserved. Thisworkmaynot be
reproducedordistributedinanyformor byany meanswithoutthe priorwrittenconsentof
AspenTech. ASPENTECHMAKESNOWARRANTYOR REPRESENTATION,EITHER EXPRESSEDOR IMPLIED, WITH
RESPECT TO THIS WORK and assumesnoliabilityforany errorsor omissions. Innoeventwill AspenTechbe
Thermo-014H Revised:Nov7,2012
6
liable toyoufordamages,includinganylossof profits,lostsavings,orotherincidental orconsequential
damagesarisingoutof the use of the informationcontainedin,orthe digital filessuppliedwithorforuse with,
thiswork. This workand itscontentsare providedforeducational purposesonly.
AspenTech®,aspenONE®,andthe Aspenleaf logo,are trademarksof AspenTechnology,Inc.. Brandsand
productnamesmentionedinthisdocumentationare trademarksorservice marksof theirrespective companies.
Thermo-019H Revised:Nov 7,2012
1
Remove Hydrogen from Methane, Ethylene and Ethane
with Aspen HYSYS® V8.0
1. Lesson Objectives
 Learn howto remove bulkof hydrogenusinga cooleranda vapor liquidseparator
 Learn howto use adjustblockand spreadsheets
2. Prerequisites
 Aspen HYSYS V8.0
 Introductiontovapor-liquidequilibrium
3. Background
In an ethyleneplant, we have afeedstreamcontaininghydrogen,methane,ethylene,andethane. Before this
streamcan be fedto the demethanizer, hydrogenmustbe removedsothe volumetricflow isless,which
decreasesthe requiredsizeforthe demethanizercolumn. Because hydrogen hasamuch highervaporpressure
than the othercomponents,one ormore flashdrumscan be usedfor hydrogenremoval.
The examplespresentedare solelyintendedtoillustrate specificconceptsand principles. Theymay not
reflectan industrial application or real situation.
4. Problem Statement and Aspen HYSYS Solution
Problem Statement
The feedstreamisa combinationof 6,306 lb/hrof hydrogen,29,458 lb/hrof methane,26,049 lb/hrof ethylene,
and 5,671 lb/hrof ethane.The mole fractionof hydrogeninthe feedstreamisgreaterthan0.51, indicatinga
large volume of hydrogeninthe feedstream. There are twogoalsforthissectionof the process:
 Afterbulkof hydrogen isremoved,the streamcontainslessthan0.02 mole fractionof hydrogen
 Loss of ethylene tothe hydrogen streamshouldbe lessthan1%
Thermo-019H Revised:Nov 7,2012
2
Aspen HYSYS Solution
4.01. Create a newsimulationin AspenHYSYSV8.0.
4.02. Create a componentlist. Inthe ComponentLists folderselectAdd. AddHydrogen, Methane,Ethylene,
and Ethane to the componentlist.
4.03. Define propertypackage. Inthe FluidPackagesfolderselectAdd. SelectPeng-Robinsonasthe
propertypackage.
4.04. Go to the simulationenvironment. Clickthe Simulationbuttoninthe bottomleftcornerof the screen.
4.05. Adda Coolerblockto the flowsheetfromthe Model Palette.
Thermo-019H Revised:Nov 7,2012
3
4.06. Double clickthe cooler(E-100). Create an Inlet streamcalled Feed,anOutletstreamcalled ToSep,and
an Energy streamcalled Q-Cool.
Thermo-019H Revised:Nov 7,2012
4
4.07. In the Parameters form,entera Delta P of 0, anda Duty of 0 kcal/h. We will create anadjustblockto
vary the dutyto reach the desired specifications.
Thermo-019H Revised:Nov 7,2012
5
4.08. Define feedstream. Goto the Worksheettab. Entera Temperature of -90°F (-67.78°C),and a Pressure
of 475 psia (32.75 bar).
4.09. Define composition. Goto the Compositionformand enterthe following MassFlowratesin kg/h.
Thermo-019H Revised:Nov 7,2012
6
4.10. Adda Separator to the flowsheetfromthe Model Palette.
4.11. Double clickthe separator(V-100). SelectstreamToSepas the Inletstream, andcreate Outletstreams
calledVapand Liq.
Thermo-019H Revised:Nov 7,2012
7
4.12. Go to the Worksheettabto viewthe separationresults. Youcan see thatthe liquidstreamhasa
flowrate of 0. We mustnowadd an adjustblockand a spreadsheettofindthe coolerduty requiredto
limitthe lossof ethylenetothe vaporstreamto lessthan1%.
Thermo-019H Revised:Nov 7,2012
8
4.13. Adda Spreadsheettothe flowsheetfromthe Model Palette.
4.14. Double clickonthe spreadsheet(SPRDSHT-1). Inthe Spreadsheettabenter“Ethylene flowin Feed”in
cell A1, and “Ethylene flowin Liq stream” incell A2. Right clickoncell B1 and selectImportVariable.
Selectthe MasterComp Molar Flow (Ethylene) inthe Feedstream. Rightclickcell B2 and selectImport
Variable. Selectthe Master CompMolar Flow (Ethylene) inthe Liqstream.
Thermo-019H Revised:Nov 7,2012
9
4.15. Enter the text“FractionEthylene Lost” in cell A3. Incell B3 enterthe followingformula: =(B1-B2)/B1.
4.16. You can see that rightnowwe are losing100% of the Ethylene to the vapor stream. We will nowaddan
adjustblockto vary the coolerdutyinorder to limitthe fractionlosttounder0.01. Addan Adjust block
to the flowsheetfromthe Model Palette.
Thermo-019H Revised:Nov 7,2012
10
4.17. Double clickonthe adjustblock(ADJ-1). Specifythe AdjustedVariable tobe the Duty of coolerblock E-
100. Specifythe TargetVariable to be cell B3 of SPRDSHT-1. Entera SpecifiedTargetValue of 0.01.
Thermo-019H Revised:Nov 7,2012
11
4.18. In the Parameters tab entera StepSize of 1e+005 kcal/h and change the Maximum Iterationsto 100.
ClickStart to begincalculations.
Thermo-019H Revised:Nov 7,2012
12
4.19. The fractionof ethylenelostinthe vaporstreamwill now be lessthan1%. We must alsomake sure that
the Mole Fraction of Hydrogen inthe liquidstreamislessthan0.02. Double clickthe Liq streamand go
to the Compositionformunderthe Worksheettab.
4.20. The Mole Fraction of hydrogeninthe liquidstreamis 0.0172, whichislessthanthe specifiedvalue of
0.02.
Thermo-019H Revised:Nov 7,2012
13
5. Conclusions
The vapor pressure of hydrogenis muchhigher(6,600 timeshigherthanmethane at -150 °C) than the vapor
pressuresof the othercomponents inthe feedstream. We used the adjustblockanda spreadsheetto
determine agoodvalue forthe heatdutyof the coolerblock to remove the bulkof hydrogenfromthe feed
streamthrougha separatorblock.
6. Copyright
Copyright© 2012 by AspenTechnology,Inc.(“AspenTech”). All rightsreserved. Thisworkmaynot be
reproducedordistributedinanyformor byany meanswithoutthe priorwrittenconsentof
AspenTech. ASPENTECHMAKESNOWARRANTYOR REPRESENTATION,EITHER EXPRESSEDOR IMPLIED, WITH
RESPECT TO THIS WORK and assumesnoliabilityforanyerrorsor omissions. Innoeventwill AspenTechbe
liable toyoufordamages,includinganylossof profits,lostsavings,orotherincidental orconsequential
damagesarisingoutof the use of the informationcontainedin,orthe digital filessuppliedwithorforuse with,
thiswork. This workand itscontentsare providedforeducational purposesonly.
AspenTech®,aspenONE®,andthe Aspenleaf logo,are trademarksof AspenTechnology,Inc.. Brandsand
productnamesmentionedinthisdocumentationare trademarksorservice marksof theirrespective companies.
Thermo-020H Revised:Nov7,2012
1
Use of a Decanter to Recover Solvent and Cross Distillation
Boundaries with Aspen HYSYS® V8.0
1. Lesson Objectives
 Use a 3 phase separatorto recoversolvent
2. Prerequisites
 Aspen HYSYS V8.0
 Introductiontoliquid-liquidequilibrium
3. Background
In an anhydrousethanol productionplant,cyclohexane isusedasanentrainerduringseparationtobreakthe
ethanol-waterazeotrope. The streamfromthe topof the firstdistillationcolumnistypicallyamixture witha
compositionthatisveryclose to the ternary azeotrope. Since cyclohexane andwaterare notmiscible,a
decantercan be usedto separate cyclohexanefromthe ethanol andwater. The secondrole of thisliquid-liquid
separationistocross distillationboundaries. One of the twooutletstreamsfromthe decanterisrecovered
solvent. The otherstreamhasa compositioninthe ethanol-richdistillationregionandisfedtothe second
column.
The examplespresentedare solelyintendedtoillustrate specificconceptsand principles. Theymay not
reflectan industrial application or real situation.
4. Use of a Decanter for solventrecovery
Problem Statement
A 100 kmol/hrfeedstreamthatis35 mol-%ethanol,6mol-% water,and59 mol-% cyclohexane isfedtoa
decanter. Determine the compositionsof the twooutletstreamsfromthe decanterandtheirflowrates.
Thermo-020H Revised:Nov7,2012
2
Aspen HYSYS Solution
4.01. Start AspenHYSYS V8.0 andcreate a new simulation.
4.02. Create a componentlist. Inthe ComponentLists folderselectAdd.AddEthanol,Water, and
Cyclohexane tothe componentlist.
4.03. Define propertypackage. Inthe FluidPackagesfolderselectAdd. SelectUNIQUACasthe property
package. In the Activity Model Specifications grid,selectRKforVapour Model.
4.04. Go to the simulationenvironment. Clickthe Simulationbuttoninthe bottomleftof the screen.
4.05. Adda 3-Phase Separator to the flowsheetfromthe Model Palette.
Thermo-020H Revised:Nov7,2012
3
4.06. Double clickthe 3 phase separatorvessel (V-100). Create an Inletstreamcalled Feed,andthree Outlets
calledVapor,Liquid1, andLiquid2.
Thermo-020H Revised:Nov7,2012
4
4.07. Define feedstream. Goto the Worksheettab. Entera Temperature of 25°C, a Pressure of 1 bar, and a
Molar Flow of 100 kgmole/h.
4.08. In the CompositionformenterMole Fractions of 0.35 forethanol,0.06 forwater, and 0.59 for
cyclohexane. The separatorshouldsolve whencompositionsare complete.
Thermo-020H Revised:Nov7,2012
5
4.09. Checkresults. Youcan see that the feedstreamwasseparatedintotwoseparate liquidstreams
because of a differenceindensitybetweenthe twoliquidphases. Stream Liquid1hasflowrate of 54.6
kgmole/h,while the heavierstream Liquid2hasa flowrate of 45.4 kgmole/h.
Thermo-020H Revised:Nov7,2012
6
4.10. Checkstreamcomposition. StreamLiquid1isenrichedincyclohexane whilestreamLiquid2isenriched
inethanol.
Thermo-020H Revised:Nov7,2012
7
5. Conclusions
A Decantercan be usedto concentrate cyclohexanefrom59% to 78% so it can be recycled orrepurposed.The
otheroutlet(Liquid2) hasacompositioninadifferentdistillationregionfromthe Feedstream, providinga
productthat crossesdistillation boundaries.Thisservesasthe decanter’ssecond role mentionedinthe
backgroundsection.
6. Copyright
Copyright© 2012 by AspenTechnology,Inc.(“AspenTech”). All rightsreserved. Thisworkmaynot be
reproducedordistributedinanyformor byany meanswithoutthe priorwrittenconsentof
AspenTech. ASPENTECHMAKESNOWARRANTYOR REPRESENTATION,EITHER EXPRESSEDOR IMPLIED, WITH
RESPECT TO THIS WORK and assumesnoliabilityforanyerrorsor omissions. Innoeventwill AspenTechbe
liable toyoufordamages,includinganylossof profits,lostsavings,orotherincidental orconsequential
damagesarisingoutof the use of the informationcontainedin,orthe digital filessuppliedwithorforuse with,
thiswork. This workand itscontentsare providedfor educational purposesonly.
AspenTech®,aspenONE®,andthe Aspenleaf logo,are trademarksof AspenTechnology,Inc.. Brandsand
productnamesmentionedinthisdocumentationare trademarksorservice marksof theirrespective companies.
Mass Transfer Operations
Dist-001H Revised:Nov7,2012
1
Distillation of Close Boiling Components with Aspen HYSYS® V8.0
1. Lesson Objectives
 Distillation columnmodeling
 Columnprofiles
 Customstreamresults
 Material balance across distillationcolumn
2. Prerequisites
 AspenHYSYS V8.0
 Experience insertingblocksandconnectingstreamsin HYSYS
 Introductiontovaporliquidequilibrium
3. Background
Ethylene isanimportantmonomer,andismade fromethane. The conversionof the reactionisnotperfect,so
the ethylene mustbe separatedfromthe system. Ethane andethyleneare molecularlysimilar,andsoare
difficulttoseparate. The difficultyof the separationiscompoundedbythe factthat polymerproduction
requiresextremelypure feedstocks.
The examplespresentedare solelyintendedtoillustrate specificconceptsand principles. Theymay not
reflectan industrial application or real situation.
4. Problem Statement and Aspen HYSYS Solution
Problem: A stream containing 68.5wt% ethylene with a total flowrate of 7.3 million lb/day is fed into a
distillation column consisting of 125 stages. It is desired to produce a distillate product stream containing a
minimum of 99.96 wt% ethylene with a total flowrate of 5 million lb/day. It is also desired that the bottoms
productcontainsno more than 0.10wt% ethylene.Determineif thisseparationisfeasible.
Dist-001H Revised:Nov7,2012
2
Assumptions:
- 100% tray efficiency
- Total condenser
- 300 psigcolumnoperatingpressure
- A refrigerantutilitystreamcapable of condensingthe ethylene mixture(notincludedin model)
- Feedmixture isat350 psig andis a vapor
- 125 stages
- Feedenters the columnatstage 90
- Peng-Robinsonequationof state
AspenHYSYS Solution:
4.01. Start AspenHYSYS V8. SelectNewto start a new simulation.
4.02. Create a ComponentList. In the Propertiesenvironment,selectthe ComponentListsfolderinthe
navigationpane andclick Add to adda new HYSYS componentlist. In ComponentList– 1 addEthane
and Ethylene tothe selectedcomponentslist. Youmayneedtouse the searchfunctionbytypingin
ethene andpressingentertofindthe componentethylene.
Dist-001H Revised:Nov7,2012
3
4.03. Create a Fluid Package. Click on the Fluid Packages folder in the navigation pane and select Add to add a
new HYSYS fluid package. Select Peng-Robinson as the property package. The Peng-Robinson equation
of state istypicallyusedtomodel systemscontaininghydrocarbonsathighpressures.
4.04. You are now ready to enter the simulation environment and construct the flowsheet. Go to the
simulation environment by clicking the Simulation button at the bottom left of the screen. On the main
flowsheetinsertaDistillationColumnSub-Flowsheetfromthe Model Palette underthe Columnstab.
Dist-001H Revised:Nov7,2012
4
4.05. Double click on the Distillation unit on the main flowsheet, or go to UnitOps | T-100 in the navigation
pane. The Distillation Column Input Expert window will appear. Here we will create the feed and
product streams, as well as define the operating conditions of the column. On the first page, enter 125
for # Stages and define the feedandproductstreamsas shownbelow.
Dist-001H Revised:Nov7,2012
5
4.06. Click Next and page 2 will appear. This page allows you to configure the reboiler. Select Regular Hysys
reboilerforReboilerType Selection,andselectthe Once-throughradiobutton. Click Next.
4.07. This next page allows you to input the pressure and pressure drop in the condenser and reboiler. Enter
a Condenser Pressure and Reboiler Pressure of 300 psig (2170 kPa). This indicates that there is no
pressure dropthroughthe column,whichisacceptable forthissimplifiedexample.
4.08. Click Next. This page (page 4 of 5) allows you to enter optional temperature estimates for the
condenser, top stage, and reboiler. In this case we will leave these fields blank. Click Next. The final
page allows you enter a liquid distillate rate or a reflux ratio. From our problem statement, we know
that distillate rate will be 5 million lb/day of ethylene. Select Mass for Flow Basis and enter 5000000
lb/day (94498.4 kg/h) for LiquidRate. SelectDone to enterthe columnpropertywindow.
4.09. We must first define the feed stream going into the column. In the Column property window, go to the
Worksheet tab. On the Conditions form, enter a pressure of 350 psig (2514 kPa), a Vapour fraction of
1, and a Mass Flow of 7.3e+06 lb/day (1.380e+005 kg/h) for the Feed@COL1 stream. Go to the
Compositions sheet in the Worksheet tab. Here we will define the composition of the feed stream.
Type a number into the Feed composition grid for Ethane to open the Input Composition for Stream
window. Select the Mass Fractions radio button, enter 0.315 for Ethane and 0.685 for Ethylene. Click
OK. The feed stream on the main flowsheet should turn blue, indicating that all required input has been
Dist-001H Revised:Nov7,2012
6
entered and that it has solved for all properties. If you open the Feed stream property window you will
see a greenstatusbar sayingOK at the bottom.
Dist-001H Revised:Nov7,2012
7
4.10. Now we must enter design specs to reach the desired product compositions as provided in the problem
statement. In the Column property window, go to Design | Specs. Our two design specifications for this
simulation will be distillate rate and mass fraction of ethylene in the bottoms stream. In the column
specifications form there should already be a Distillate Rate spec that was created from the column
input expert. Make sure that the distillate specification value is correct (9.450e+004 kg/h) and that the
specis checkedasactive.
4.11. In the Column Specifications form, click Add and select a Column Component Fraction specification. In
the Comp Frac Spec window select the Stream radio button for Target Type. Enter Ethane@COL1 for
Draw, Mass Fraction for Basis, and 9.0e-004 for Spec Value. Select Ethylene for Components. Close
thisformwhenall information isentered.
Dist-001H Revised:Nov7,2012
8
4.12. Make sure that this spec (Comp Fraction) is checked as Active in the Specification Details area. You will
notice that after activating the Comp Fraction spec, the Degrees of Freedom changes to -1. This means
that the problem is over specified. To fix this, simply deactivate one of the column specifications, in this
case the Reflux Ratio. Once the reflux ratio design spec is deactivated, the column should solve. You will
notice thatthe statusbar at the bottomof the sheetwill turngreenandsay Converged.
Dist-001H Revised:Nov7,2012
9
4.13. Check results. In the Column property window, go to the Performance tab. On the Summary sheet you
can see the flowrates and compositions of the feed and product streams. You can see that both
specificationsdescribedinthe problemstatementare met.
Dist-001H Revised:Nov7,2012
10
4.14. In the Column Profiles sheet you can view the calculated reflux ratio, boilup ratio, as well as material
and energyprofilesthroughthe column.
4.15. On the Plots sheet you can create plots such as temperature and composition along the column, as
shownbelow.
Dist-001H Revised:Nov7,2012
11
Dist-001H Revised:Nov7,2012
12
4.16. Finally, on the Cond./Reboiler sheet you can view the calculated operating conditions for both the
condenserandreboiler.
5. Conclusions
The 125 stage column was able to exceed the specification of 99.96wt% ethylene at 5 million lb/day, as well as
the bottoms having less than 0.10wt% ethylene. It could then be concluded that this column is capable of
completing the desired separation. Aspen HYSYS allows engineers to model existing equipment and see if it is
possible torepurpose it or,otherwise, designnew equipmentthatwould meetvery specificcriteria.
6. Copyright
Copyright © 2012 by Aspen Technology, Inc. (“AspenTech”). All rights reserved. This work may not be
reproduced or distributed in any form or by any means without the prior written consent of
AspenTech. ASPENTECH MAKES NO WARRANTY OR REPRESENTATION, EITHER EXPRESSED OR IMPLIED, WITH
RESPECT TO THIS WORK and assumes no liability for any errors or omissions. In no event will AspenTech be
liable to you for damages, including any loss of profits, lost savings, or other incidental or consequential
damages arising out of the use of the information contained in, or the digital files supplied with or for use with,
thiswork. This workand itscontentsare providedforeducational purposesonly.
AspenTech®, aspenONE®, and the Aspen leaf logo, are trademarks of Aspen Technology, Inc.. Brands and
productnamesmentionedinthisdocumentationare trademarksorservice marksof theirrespective companies.
Dist-002H Revised:Nov5,2012
1
Pressure Swing Distillation with Aspen HYSYS® V8.0
1. Lesson Objectives
 Configure distillationcolumnsinAspenHYSYS
 Learn to use pressure swingtoovercome azeotropicmixture
2. Prerequisites
 Aspen HYSYS V8.0
 Workingknowledgeof vapor-liquidequilibrium anddistillation
3. Background
Basics on Azeotropic Distillation
An azeotrope occurs when the liquid and vapor mole fractions of each component are the same. On a y-x plot,
an azeotrope is shown by a line which passes through the x = y line. Azeotropes present challenges to
separationprocessesandneedtobe accountedforinprocessdesignandoperation.
Dist-002H Revised:Nov5,2012
2
No further enrichment can occur in either phase when the system reaches the azeotrope constraint because the
driving force is eliminated. A mixture will separate towards a pure component and the azeotropic mixture. The
component whichis purified depends onwhich side of the crossover the initial mixture is. To purify the minority
component, you must first cross the azeotrope. This can be done by adding an entrainer, another chemical
which breaks the azeotrope. This creates the need for additional separation and usually material recycle with a
purge stream. Alternatively, the composition of the azeotrope is dependent on pressure, which can be
exploitedtogetthe mixture acrossthe azeotrope. Thisiscalledpressure swingdistillation.
Ethanol and water form an azeotrope at approximately 95.5mol-% ethanol at 1 atm. This is a low-boiling point
(or positive) azeotrope. The boiling point of the mixture is lower than either of the pure components, so the
azeotropic mixture exit from the top of the column regardless of which compound is being enriched in the
bottoms.
The examples presented are solely intended to illustrate specific concepts and principles. They may not
reflectan industrial application or real situation.
4. Problem Statement
A feed of 24,000 kg/h of 20mol-% ethanol and 80 mol-% water must be separated. The required product stream
is 99 mol-%ethanol at a flowrate of at least 7,500 kg/h. This separation will be achieved by using pressure swing
distillation.
We begin by creating a technically feasible design for a two-column separation train. We will report for each
column: operating pressure, number of stages, reflux ratio, and the purity and recovery specifications. Also
report a stream table with the flowrates and compositions of relevant streams. Material recycle will be
necessary to achieve these results. We will use an operating pressure of 0.1 bar for the first column, and an
operatingpressure of 20 bar for the secondcolumn.
Aspen HYSYS Solution
4.01. Create a newsimulationin AspenHYSYSV8.0.
4.02. Create a componentlist. Inthe ComponentLists folderselectAdd. Addethanol andwaterto the
componentlist.
Dist-002H Revised:Nov5,2012
3
4.03. Define propertypackage. Inthe FluidPackagesfolderselectAdd. SelectNRTLas the propertypackage.
SelectRK as the Vapour Model. The non-random, twoliquid(NRTL) model workswell forverynonideal
liquidsystemswhichisimportantbecause of the hydrogenbondingpresent. The Redlich-Kwong
equationmodel worksmuchbetterathighpressuresthanthe ideal gasassumptioninthe vapourphase.
4.04. Go to the simulationenvironmentbyclickingthe Simulationbuttoninthe bottomleftof the screen.
4.05. Adda DistillationColumnSub-Flowsheettothe flowsheetfromthe Model Palette.
Dist-002H Revised:Nov5,2012
4
4.06. Double click the column (T-100). This will open the Distillation Column Input Expert window. Enter the
followinginformationandclick Nextwhencomplete.
Dist-002H Revised:Nov5,2012
5
4.07. On the second page of the input expert leave the default selections for a Once-through, Regular Hysys
reboilerandclick Next.
4.08. On page 3 of the input expert enter Condenser and Reboiler Pressures of 0.1 bar. Click Next when
complete.
4.09. On page 4, leave all fields for temperature estimates blank. Click Next to continue. On page 5 of the
inputexpert,againleave all fieldsblankandclick Done toconfigure the column.
4.10. We will now define the feed stream. Double click on the Feed stream. In the Worksheet tab enter a
Temperature of 65°C, a Pressure of 1.2 bar, anda Mass Flowof 24,000 kg/h.
Dist-002H Revised:Nov5,2012
6
4.11. Go to the Compositionformunderthe Worksheettabto define the compositionof the feedstream.
Enter Mole Fractions of 0.2 for ethanol and 0.8 forwater. Whencomplete,the feedstreamshouldbe
fullydefinedandwillsolve.
4.12. Double clickthe column(T-100) to finishspecifyingthe operatingconditions. Goto the Specs form
underthe Designtab. First,we wouldlike torecover99% of ethanol fromthe feedstream. Todo this
we will clickthe Addbuttonand select ColumnComponentRecovery. SelectstreamD1 as the Draw,
entera Spec Value of 0.99, andselectEthanol as the Component.
Dist-002H Revised:Nov5,2012
7
4.13. Second,we wouldlike the distillatestream(D1) to have a mole fractionof 0.90 for ethanol. The
azeotrope preventsusfromthe reachingthe desiredproductpurityof 99% witha single column,butwe
wouldstill wantthe distillate from the firstcolumntobe verypure while losingaslittle producttothe
bottomsstreamas possible. Click Addand selectColumnCompFraction. SelectStreamfor Target
Type, D1 for Draw, 0.90 for Spec Value,andEthanol for Component.
Dist-002H Revised:Nov5,2012
8
4.14. Go to the SpecsSummary form underthe Designtab. Make sure that the onlyspecificationsmarkedas
active are CompRecovery and CompFraction. The columnwill attempttosolve once these specsare
active.
4.15. If the solverfailstoconverge,we mayhave toadd some parameterestimates. Forexample,we can
provide anestimate forthe distillate streamflowrate basedona simple massbalance. We knowthat
the feedcontainsapproximately 200 kgmole/hof ethanol. We alsoknow that we wantto recover99%
of ethanol withanethanol mole fractionof 0.9in the distillate. We canthenprovide anestimate of 220
kgmole/hrforthe distillate stream. Inthe SpecsSummary grid,enter220 kgmole/h forDistillate Rate
whichwill serve asanestimate aslongas it isnot an active specification. Click Runwhencomplete. The
columnshouldnowconverge. Alsonote thatthe bottomsstreamisover99% water,whichmeansthat
we are throwingawayverylittle ethanol. A pure waterstreamisalsodesirable becausewe cannow
repurpose ordispose of thisstreamwithminimal furtherprocessing.
Dist-002H Revised:Nov5,2012
9
4.16. We are now readyto constructthe secondcolumn, whichwilloperate onthe otherside of the
azeotrope ata pressure of 20 bar. We firstneedtoinserta pumpto increase the pressure of the
distillatestreamleavingthe firstcolumn. Adda pump to the flowsheetfromthe Model Palette.
Dist-002H Revised:Nov5,2012
10
4.17. Double click the pump (P-100). Select stream D1 as the Inlet, create an Outlet stream called Feed2, and
create an Energy streamcalled Q-Pump.
4.18. In the Worksheet tab, enter a Pressure of 20 bar (operating pressure of the second column) for stream
Feed2. The pumpshouldsolve.
Dist-002H Revised:Nov5,2012
11
4.19. Nextwe will insertthe second DistillationColumnSub-Flowsheettothe flowsheet,afterthe pump.
4.20. Double click the second column (T-101). This will open the Distillation Column Input Expert. On the
firstpage,enterthe followinginformationandclick Nextwhencomplete.
4.21. On page 2 of the input expert, leave the default selections for a Once-through, Regular Hysys reboiler.
ClickNext.
4.22. On page 3 of the input expert, enter Condenser and Reboiler Pressures of 20 bar. Click Next when
complete.
Dist-002H Revised:Nov5,2012
12
4.23. On page 4 leave all fields for temperature estimates blank. Click Next. On the final page, also leave all
fieldsblank. Click Done to configure the column.
4.24. We must now enter the operating specifications for the column. In the column window for T-101 go to
the Specs form under the Design tab. Add a column specification for the mole fraction of ethanol in the
bottoms stream. Click Add and select Column Component Fraction. Select Stream for Target Type,
Ethanol for Draw, 0.99 for SpecValue,and Ethanol forComponent.
Dist-002H Revised:Nov5,2012
13
4.25. We will now add a specification for the mole recovery of ethanol in the bottoms stream. In the Specs
Summary form under the Design tab, double click the specification for Btms Prod Rate. We know that
approximately 203 kgmole/h of ethanol are entering the process in the original feed stream. Since we
are recovering 99% of the ethanol in the first column, we expect the final product stream to have a
flowrate of approximately 200kgmole/h.
4.26. In the Specs Summary form, make sure that the only active specifications are Btms Prod Rate and Comp
Fraction. The columnwill attempt to solve, but you should find that it will not be able to converge. This
isbecause we needtoadd a recycle streamto the flowsheet.
Dist-002H Revised:Nov5,2012
14
4.27. Double click on the first column (T-100) and add a second Inlet Stream called Recycle. This stream will
enteronthe same stage as the Feedstream(stage 25).
4.28. We will define the recycle stream with a guess of what the actual recycle stream will consist of. We will
use this “dummy” recycle stream to allow both columns to converge, and then we will add a recycle
block to find the actual recycle stream conditions. Double click the Recycle stream on the flowsheet. In
the Worksheet tab enter a Vapour Fraction of 0, a Pressure of 1.2 bar, and a Molar Flow of 400
kgmole/h. In the Composition form enter Mole Fractions of 0.9 for ethanol, and 0.1 for water. Again,
these values are just guesses that will be used to converge both columns. The actual values for the
recycle stream will be determined later through the use of a recycle block. Make sure that you specify
Recycle in its own window, rather than in the Worksheet tab of Column T-100, as this will cause a
consistencyerrordue tooverspecificationwhenyoutrytocomplete the recycle loop.
Dist-002H Revised:Nov5,2012
15
4.29. Once the recycle stream is fully specified, double click on each column and click Run to converge the
columns. Bothcolumnsshouldnowsuccessfullyconverge.
4.30. Now we can close the recycle loop to determine the actual values for the Recycle stream. First we must
lower the pressure of stream D2 through the use of a valve. Add a Valve to the flowsheet from the
Model Palette.
Dist-002H Revised:Nov5,2012
16
4.31. Double clickonthe valve (VLV-100). SelectstreamD2 as the Inletand create an OutletcalledRec.
4.32. Go to the Worksheettaband specifyanoutlet Pressure of 1.2 bar. The valve shouldsolve.
Dist-002H Revised:Nov5,2012
17
4.33. We will nowadda Recycle blockto the flowsheetfromthe Model Palette.
Dist-002H Revised:Nov5,2012
18
4.34. Double click on the recycle block (RCY-1). Select stream Rec as the Inlet and stream Recycle as the
Outlet. The recycle blockshouldautomaticallysolve.
Dist-002H Revised:Nov5,2012
19
4.35. Go to the Worksheet tab to view recycle convergence results. The two streams should be equal to each
otherwithinacertaintolerance.
4.36. If you are not satisfied with the recycle convergence, go to the Parameters tab and lower the
sensitivities. For example if we change the sensitivity value to 1 for Flow and Composition we get the
followingresults.
Dist-002H Revised:Nov5,2012
20
4.37. The flowsheet is now complete. Further analysis can be performed to optimize the column size, feed
location,andenergyrequirements,butthatanalysisisnotcoveredinthislesson.
Dist-002H Revised:Nov5,2012
21
5. Conclusions
The azeotrope in the ethanol-water system presents a barrier to separation, but pressure swing distillation can
be used to purify ethanol. A technically feasible design for purifying ethanol to 99mol-% with pressure swing
distillation can be constructed using Aspen HYSYS. A column with 30 equilibrium stages and operating at 0.1 bar
with a reflux ratio of 6.9 increases the ethanol composition to 90mol-%. A second column with 75 equilibrium
stagesand operatingat20 bar witha reflux ratioof 10.8 increasesthe purityto99mol-%.
6. Copyright
Copyright © 2012 by Aspen Technology, Inc. (“AspenTech”). All rights reserved. This work may not be
reproduced or distributed in any form or by any means without the prior written consent of
AspenTech. ASPENTECH MAKES NO WARRANTY OR REPRESENTATION, EITHER EXPRESSED OR IMPLIED, WITH
RESPECT TO THIS WORK and assumes no liability for any errors or omissions. In no event will AspenTech be
liable to you for damages, including any loss of profits, lost savings, or other incidental or consequential
damages arising out of the use of the information contained in, or the digital files supplied with or for use with,
thiswork. This workand itscontentsare providedforeducational purposes only.
AspenTech®, aspenONE®, and the Aspen leaf logo, are trademarks of Aspen Technology, Inc.. Brands and
productnamesmentionedinthisdocumentationare trademarksorservice marksof theirrespective companies.
Dist-003H Revised:Nov 7,2012
1
First-Pass Distillation Estimates with Aspen HYSYS® V8.0
1. Lesson Objectives
 Short cut distillationmodeling
 Initial columnsizing
2. Prerequisites
 Aspen HYSYS V8.0
 Introductiontovaporliquidequilibrium
3. Background
Short Cut Distillation Block
The Short Cut ColumnperformsFenske-Underwoodshortcutcalculationsforsimplerefluxedtowers.The
Fenske minimumnumberof traysandthe Underwoodminimumreflux are calculated.A specifiedrefluxratio
can thenbe usedtocalculate the vapor andliquidtrafficratesinthe enrichingandstrippingsections,the
condenserdutyandreboilerduty,the numberof ideal trays,andthe optimal feedlocation. The ShortCut
Columnisonlyan estimate of the Columnperformance andisrestrictedtosimple refluxedColumns.Formore
realisticresultsthe rigorousColumnoperationshouldbe used.Thisoperationcanprovide initial estimatesfor
mostsimple Columns
Heavy and Light Keys
In two-componentdistillation,the columnsplitsthe feed soa single componentisenrichedineach exitstream.
In multi-componentdistillation,there are more componentsthaneffluentstreams,sothere are multiple
components enriched inatleastone of the exitstreams. The keycomponentsare the componentsthatare split
by the column. The lightkeyisthe leastvolatile component enrichedinthe distillate stream;the heavykeyis
the most volatile componentenrichedinthe bottomsstream. If there are componentsA,B,C, and D with
decreasingvolatility,acolumncancreate the followingseparations:
Dist-003H Revised:Nov 7,2012
2
The examplespresentedare solelyintendedtoillustrate specificconceptsand principles. Theymay not
reflectan industrial application or real situation.
4. Problem Statement and Aspen HYSYS Solution
Problem
A streamcontaining68.5 wt% ethylene and 31.5 wt%ethane witha total flowrate of 7.3 million lb/daymustbe
separated. Reporta reasonable startingpointfor a more detaileddesignincludinganestimate of the numberof
theoretical stagesandreflux ratiorequiredtoachieve aseparationof 99.9% recoveryof ethylene and99.0%
recoveryof ethane.
Aspen HYSYS Solution
Initial estimationfordistillationof relativelyidealcomponentslikeethane andethylene canbe done using
graphical methodsandsemi-empirical equationslikethe equationsdescribedinthe backgroundsection. In
AspenHYSYS,the Short Cut Column usesthese equations. The usermustinputwhichcomponentsare the light
and heavykeysand the recoveryof each of these components,the pressure inthe condenserandreboiler,and
the reflux ratio. These equationsare goodstartingpoints,but the ShortcutColumn isnot a rigorouscalculation
block;it doesnotdirectlyuse thermodynamicstosolve forthe reflux ratioorrequirednumberof stages. A
more rigorouslookat thisseparationproblemisavailable inDist-001_C2Splitter.
4.01. Create a newcase in AspenHYSYS V8.0.
4.02. Create a componentlist. Inthe ComponentLists folderselectAdd. AddEthane and Ethylene tothe
componentlist. Youmayneedtotype “ethene”inthe Search for fieldtofindethylene.
Dist-003H Revised:Nov 7,2012
3
4.03. Define property package. Inthe FluidPackagesfolderselectAdd. SelectPeng-Robinsonasthe
propertypackage.
4.04. Go to the simulationenvironmentbyclickingonthe Simulationbuttonbelow the navigationpane.
4.05. Adda Short Cut Distillationmodel tothe flowsheetfromthe Model Palette.
4.06. Double clickonthe column(T-100). Create an InletcalledFeed,aCondenserDuty calledQ-Cond,a
Distillate calledDist,a ReboilerDuty calledQ-Reb,anda Bottoms calledBot.Checkthe Liquidradio
buttonunderTop Product Phase, whichspecifies atotal condenser.
Dist-003H Revised:Nov 7,2012
4
4.07. Define feedstream. Goto the Worksheettab. Entera Vapour Fraction of 1, a Pressure of 350 psig
(25.14 bar), anda Mass Flowof 7,300,000 lb/day (1.38e+005 kg/h).
4.08. In the CompositionformenterMass Fractions of 0.315 for Ethane and 0.685 for Ethylene. The feed
streamshouldsolve.
Dist-003H Revised:Nov 7,2012
5
4.09. Go to the Parametersform underthe Designtab inthe Shortcut Columnwindow. Usingthe recovery
percentagesspecifiedinthe problemstatementalongwithasimple massbalance,itcanbe determined
that the mole fractionof ethane inthe distillatestreamwillbe approximately 0.004, andthe mole
fractionof ethylene inthe bottomswillbe approximately 0.002. Enterthese valuesintothe
Componentsgridin the Parameters form.
4.10. Specifythe CondenserandReboilerPressures tobothbe 300 psig(21.698 bar). You can see thatHYSYS
has nowcalculatedthe MinimumRefluxRatiorequiredtocomplete the specifiedseparationwithan
infinite numberof stages.
4.11. You may nowentera RefluxRatio and the Shortcut Columnwill calculate the numberof stages,feed
stage location,condenserandreboilertemperatures,andmaterial andenergyflows. Forexample,
enter4.5 as the External RefluxRatio.
Dist-003H Revised:Nov 7,2012
6
4.12. In the Performance tab youwill see the followingresults.
Dist-003H Revised:Nov 7,2012
7
5. Conclusions
Estimationusingthe ShortCutColumn can be done veryquickly,evenforcomplexdistillationsystems. The
resultscanthenbe usedas a startingpointformore complex analysis,suchasa witha rigorousdistillation
model.
6. Copyright
Copyright © 2012 by Aspen Technology, Inc. (“AspenTech”). All rights reserved. This work may not be
reproduced or distributed in any form or by any means without the prior written consent of
AspenTech. ASPENTECH MAKES NO WARRANTY OR REPRESENTATION, EITHER EXPRESSED OR IMPLIED, WITH
RESPECT TO THIS WORK and assumes no liability for any errors or omissions. In no event will AspenTech be
liable to you for damages, including any loss of profits, lost savings, or other incidental or consequential
damages arising out of the use of the information contained in, or the digital files supplied with or for use with,
thiswork. This workand itscontentsare providedforeducational purposesonly.
AspenTech®, aspenONE®, and the Aspen leaf logo, are trademarks of Aspen Technology, Inc.. Brands and
productnamesmentionedinthisdocumentationare trademarksorservice marksof theirrespective companies.
Dist-004H Revised:Nov 7,2012
1
Gibbs Phase Rule in a Distillation Column with Aspen HYSYS® V8.0
1. Lesson Objectives
 Use Aspen HYSYSto observe one-to-one relationbetweenstage temperaturesandcompositionsina
distillationcolumn forabinarysystemwithfixedpressure.
2. Prerequisites
 Aspen HYSYS V8.0
3. Background
Accordingto the Gibbsphase rule,the degreesof freedom( ) isequal to the numberof components(C) minus
numberof phases( ,plus2.
For a binarymixture involvingvapor-liquidequilibrium,there are nodegrees of freedomleft once temperature
and pressure are fixed. All state variablesare fixed,includingvaporandliquidcompositions. Thisisuseful for
distillationcolumncontrol. Indistillationcolumn simulations,the productcompositionsare typicallythe most
importantresults. Therefore,compositionsare typicallymeasuredandcontrolled. However,measuring
compositionsisaslower,more costlyprocessthanmeasuringtemperatures. Whenpressureisfixed,
temperature andcompositionhave aone-to-onecorrespondence (exceptforcaseswithazeotropes).
Therefore,measuringandcontrollingtop/bottomstage temperaturesisthe same asmeasuringandcontrolling
top/bottomstage composition.
In thisexample, we will carryoutseveral case studiestoshow thatcompositionsfortopandbottomstagesare
constantwhentopand bottomstage temperaturesare fixedregardlessof changesinotheroperatingconditions
and columnconfigurations.
The examplespresentedare solelyintendedtoillustrate specificconceptsand principles. Theymay not
reflectan industrial application or real situation.
Dist-004H Revised:Nov 7,2012
2
4. Problem Statement and Aspen HYSYS Solution
Problem Statement
For a distillationcolumn consistingof a binarymixture of ethane andethylene,whenthe pressure and
temperature foranequilibriumstage have beenfixed,will the vaporandliquidcompositionsleavingthisstage
change withotherconditionsof the column?
Aspen HYSYS Solution
4.01. Create a newcase in AspenHYSYS V8.0.
4.02. Create a componentlist. Inthe ComponentLists folderselectAdd. AddEthane and Ethylene tothe
componentlist. Ethylene canbe foundbyentering“ethene”inthe Searchfor field.
4.03. Define propertypackage. Inthe FluidPackagesfolderselectAdd. SelectPeng-Robinsonasthe
propertypackage.
4.04. Go to the simulationenvironmentbyclickingthe Simulationbuttoninthe bottomleftof the screen.
Dist-004H Revised:Nov 7,2012
3
4.05. Adda DistillationColumnSub-Flowsheettothe flowsheetfromthe Model Palette.
4.06. Double clickonthe distillationcolumn(T-100). The DistillationColumnInput Expertwindow will open.
On the firstpage of the expertenterthe followinginformation. Click Nextwhencomplete.
Dist-004H Revised:Nov 7,2012
4
4.07. On the secondpage of the inputexpertleavethe defaultselectionsfora Once –through, Regular HYSYS
reboilerandclick Next.
4.08. On the thirdpage of the inputexpertenter CondenserandReboilerPressures of 100 kPa. Click Next.
4.09. On the fourthpage of the inputexpertleave all fieldsfortemperature estimatesblankandclick Next.
Alsoleave all fieldsblankonthe fifthpage andclick Done to configure the column.
4.10. We will firstdefine the feedstream. Doubleclickonthe Feedstream. Entera Vapour Fraction of 0.5, a
Pressure of 100 kPa, and Molar Flowof 100 kgmole/h.
Dist-004H Revised:Nov 7,2012
5
4.11. In the CompositionformenterMole Fractions of 0.5 for both Ethylene and Ethane. The streamshould
solve.
4.12. Double clickthe column(T-100) to complete the specificationsforthe column. Goto the Specsform
underthe Designtab. We wouldlike tospecifythe temperaturesof the topand bottomstages. Click
the Add buttonand selectaColumn Temperature specificationtype. Select Stage 1 and entera Spec
Value of -104.193°C. Thistemperature correspondstoamole fractionof 0.99 ethylene inthe distillate.
4.13. Adda second Temperature specificationandselect Stage 50 and entera SpecValue of -88.971°C. This
temperature correspondstoamole fraction of 0.99 ethane inthe bottoms.
Dist-004H Revised:Nov 7,2012
6
4.14. In the SpecsSummary form,make sure that the onlyactive specificationsare the twotemperature
specsthat were justcreated. Afterbothtemperature specsare made active the columnshouldsolve.
Dist-004H Revised:Nov 7,2012
7
4.15. Checkproductcompositionresults. Inthe columnpropertywindow,gotothe Performance tab. In the
Summary form youcan see that the mole fractionof ethylene inthe distillate is 0.9934 andthe mole
fractionof ethane inthe bottomsis 1.
Dist-004H Revised:Nov 7,2012
8
4.16. To viewthe RefluxandBoilup Ratios go to the ColumnProfilesformunderthe Performance tab.
4.17. We will now change the feedlocation tothe columnwhileholdingthe topandbottomstage
temperature specificationsconstant. The productcompositionsshouldnotchange because we are
holdingtemperatureandpressure constant. Goto the Designtab in the columnwindow andchange
the FeedstreamInletStage to 29. Click Run to begincalculations. The columnshouldconverge.
Dist-004H Revised:Nov 7,2012
9
4.18. Go to the Performance tab to viewresults.Notethatthe productcompositionshave notchanged. You
will notice howeverthatthe RefluxandBoilupRatios have changed.
4.19. We will now change the compositionof the feedstream. Double clickthe Feedstreamandgoto the
Compositionformunderthe Worksheettab. Change the Mole Fractions to 0.6 forEthylene and 0.4 for
Ethane. Whenfinishedthe columnshouldautomaticallyupdate andconverge. Again,the product
compositionsshouldnotchange because we are still holdingthe temperature andpressure of the top
and bottomstage constant.
Dist-004H Revised:Nov 7,2012
10
4.20. Go to the Performance tab inthe columnwindow toview the compositionresults.
4.21. Lastly, we will add10 stagesto the columnand observe the effectonproductpurity. Go to the Design
tab of the columnwindowandenter 60 for Numof Stages. Press Run whencomplete. The column
shouldconverge.
Dist-004H Revised:Nov 7,2012
11
4.22. Go to the Performance tab to viewresults. Once againyouwill see thatthe productcompositions
remainunchanged.
5. Conclusions
Thisexample showsthatfora binarydistillationcolumn,fixingtop/bottomstage temperatures holds
top/bottomcompositions constantregardlessof changestootherthings(e.g.,feedconditionsandlocationsor
the numberof stagesin the column). Thisbehaviorcanbe leveragedforcontrol. Forbinarymixtureswith
azeotrope(s),thisstillholdstrue assuming thata composite feedstayswithinacertainregiondividedby
azeotropes.
6. Copyright
Copyright© 2012 by AspenTechnology,Inc.(“AspenTech”).All rightsreserved. Thisworkmaynot be
reproducedordistributedinanyformor byany meanswithoutthe priorwrittenconsentof
AspenTech. ASPENTECHMAKESNOWARRANTYOR REPRESENTATION,EITHER EXPRESSEDOR IMPLIED, WITH
RESPECT TO THIS WORK and assumesno liabilityforanyerrorsor omissions. Innoeventwill AspenTechbe
liable toyoufordamages,includinganylossof profits,lostsavings,orotherincidental orconsequential
damagesarisingoutof the use of the informationcontainedin,orthe digital filessuppliedwithorforuse with,
thiswork. This workand itscontentsare providedforeducational purposesonly.
AspenTech®,aspenONE®,andthe Aspenleaf logo,are trademarksof AspenTechnology,Inc.. Brandsand
productnamesmentionedinthis documentationare trademarksorservice marksof theirrespective companies.
Dist-009H Revised:Nov19,2012
1
Separation of Acetone-Water with Aspen HYSYS® V8.0
Liquid-Liquid Extraction with 3-Methylhexane as the Solvent
1. Lesson Objectives
 Learn howto buildanextractionandsolventrecoveryflowsheet.
 Learn howto configure aliquid-liquidextractorandadistillationcolumn.
2. Prerequisites
 Aspen HYSYS V8.0
3. Background
Water has a highlatentheat(heatof vaporization) comparedtomanyothercomponents. Forthe separationof
a water-acetone mixture (50wt-% each),itmaybe more energyefficienttouse extractioninsteadof direct
distillation. Inthisexample,we utilize 3-methylhexane asasolventtoremove watervialiquid-liquidextraction,
followedbydistillationtoremove the solventfromacetone.
The examplespresentedare solelyintendedtoillustrate specificconceptsand principles. Theymay not
reflectan industrial application or real situation.
4. Problem Statement and Aspen HYSYS Solution
Problem Statement
Determine howmuch energy isrequiredto separate a50 wt-% acetone 50 wt-% waterstreamusing3-
methylhexaneasa solvent.
Aspen HYSYS Solution
4.01. Start a newsimulation inAspenHYSYSV8.0.
4.02. Create a componentlist. Inthe ComponentLists folderselectAdd. AddAcetone,Water,and 3-
methylhexane tothe componentlist.
Dist-009H Revised:Nov19,2012
2
4.03. Selectpropertypackage. Inthe FluidPackages folderselectAdd. SelectPRSVasthe propertypackage.
For informationaboutthe PRSV propertypackage see AspenHYSYShelp.
4.04. Move to the simulationenvironmentbyclickingthe Simulationbuttoninthe bottomleftof the screen.
4.05. Firstwe will adda Mixerto the flowsheetfromthe Model Palette. Thismixerwill servetomix together
the recycledsolventstreamandthe solventmake upstream.
Dist-009H Revised:Nov19,2012
3
4.06. Double clickthe mixer(MIX-100). Create twoInletstreamscalled Make Up and Solvent-Recycle.
Create an Outletstreamcalled Solvent.
Dist-009H Revised:Nov19,2012
4
4.07. Double clickonthe Make Up stream. SpecifyaTemperature of 25°C, a Pressure of 1 bar, and a Molar
Flowof 0. We will laterassignthisstreama flowrate,butfornow itwill have zeroflow. Inthe
Compositionformentera Mole Fraction of 1 for 3-methylhexane.
4.08. Double clickonthe Solvent-Recycle stream. Entera Temperature of 30°C, a Pressure of 1 bar, and a
Mass Flow of 150 kg/h. In the Compositionformentera Mole Fraction of 1 for3-methylhexane. These
specificationswill serveasan initial guessastowhatthe actual recycle streamwill be.
Dist-009H Revised:Nov19,2012
5
4.09. Adda Liquid-LiquidExtractor to the flowsheetfromthe Model Palette.
4.10. Double clickonthe extractor(T-100) to openthe Liquid-LiquidExtractor Input Expertwindow. Onthe
firstpage entera Top Stage Inlet calledFeedandselectSolventforthe Bottom Stage Inlet. Change the
numberof stagesto 8. Enteran Ovhd Light Liquid streamcalled Rich-Sol anda Bottoms Heavy Liquid
streamcalled Water. ClickNextwhencomplete.
Dist-009H Revised:Nov19,2012
6
4.11. On Page 2 of the Input Expert enterTop andBottom Stage Pressuresof 1 bar. Click Nextwhen
complete.
4.12. On the final page of the Input Expert entera Top Stage Temperature Estimate of 25°C. Click Done
whencomplete toconfigure the column.
Dist-009H Revised:Nov19,2012
7
4.13. We mustnowdefine the feed stream. Goto the Worksheettabinthe Column:T-100 window. Forthe
Feedstreamentera Temperature of 25°C, a Pressure of 1 bar, and a Mass Flow of 100 kg/h.
4.14. In the Compositionsformunderthe WorksheettabenterMass Fractions of 0.5 foracetone andwater
inthe Feedstream.
Dist-009H Revised:Nov19,2012
8
4.15. Clickthe Run buttonat the bottomof the Column:T-100 window tobegincolumncalculations. The
columnshouldconverge.
4.16. Checkthe compositionof the Waterstreamexitingthe bottomof the column. Youwill see thatthe
mole fraction for water is1.
Dist-009H Revised:Nov19,2012
9
4.17. We will nowinsertaDistillationColumnSub-Flowsheetfromthe Model Palette.
4.18. Double clickthe column(T-101) to openthe DistillationColumnInputExpert. On Page 1 enterthe
followinginformationandclick Nextwhencomplete.
Dist-009H Revised:Nov19,2012
10
4.19. On Page 2 of the Input Expert leave the defaultselectionsfora Once-through,Regular Hysys Reboiler.
ClickNext.
4.20. On Page 3 of the Input Expert enterCondenserandReboilerPressures of 1 bar. Click Nextwhen
complete.
Dist-009H Revised:Nov19,2012
11
4.21. On Page 4 and 5 leave all fieldsblank. Click Done onthe final page to configure the column.
4.22. We mustdefine the designspecificationsforthiscolumn. Goto the SpecsSummary formunderthe
Designtab. Enter 1.2 for RefluxRatio and make sure that the reflux ratiospecificationisthe onlyactive
designspecification.
4.23. We will nowadda specificationforthe mole fractionof acetone inthe distillate stream. Goto the Specs
formunderthe Design tab. ClickAddand selectColumnComponentFraction. SelectStreamfor Target
Type, Acetone for Draw, enter0.99 for SpecValue,and selectAcetone forComponent.
4.24. The Degreesof Freedomforthe columnshouldnow be 0. Clickthe Run buttonto begincolumn
calculations. The columnshouldsolve.
Dist-009H Revised:Nov19,2012
12
4.25. We nowneedtoadd a coolerto cool the bottomsstreaminorderto recycle itback to the mixer. Adda
Coolerto the flowsheetfromthe Model Palette.
Dist-009H Revised:Nov19,2012
13
4.26. Double clickonthe cooler(E-100). Selectstream Sol-Recas the Inlet, and create an OutletcalledLean-
Sol and an Energystream called Q-Cool.
4.27. In the Worksheettabenteran outlet Temperature of 30°C and a Pressure of 1 bar. The blockshould
solve.
Dist-009H Revised:Nov19,2012
14
4.28. Nowwe will adda Spreadsheetto control to flowrate of solventinthe Make Up stream.
4.29. Double clickonthe spreadsheet(SPRDSHT-1). Goto the Spreadsheettaband enterthe followingtextin
cellsA1 and A2.
Dist-009H Revised:Nov19,2012
15
4.30. Rightclickon cell B1 andselectImport Variable. SelectMasterComp Molar Flowof 3-methylhexane in
the acetone productstream.
4.31. Clickon cell B2 and enter“=B1”. Rightclickon cell B2 andselectExport Formula Result. Selectthe
Molar Flow of streamMake Up. Thiswill setthe Make Up streamflowrate equal tothe flowrate of
solventbeinglostinthe productstream.
Dist-009H Revised:Nov19,2012
16
4.32. We will nowrecycle the bottomsstreamsfromthe secondcolumninordertopreventthrowingaway
acetone product. Adda Recycle blockto the flowsheetfromthe Model Palette.
Dist-009H Revised:Nov19,2012
17
4.33. Double clickonthe recycle block(RCY-1). SelectstreamSol-Recasthe Inletand streamSolvent-Recycle
as the Outlet. The flowsheetshouldsolve.
4.34. We can nowtry to minimize the amountof solventthatwe are recycling. Itis possible thatthere are
manysolutionsforthe amountof solventrecycle,andwe wishtofindthe optimumsolution. We can
vary the mass flowof the recycle streamandfindwhere the reboilerdutyisatthe lowest.
4.35. Go to Case Studiesinthe navigationpane andclick Add. In Case Study 1 clickAdd and selectthe Mass
Flowof streamSolvent-Recycle andthe ReboilerDuty of column T-101. Enter a Low Bound of 75 kg/h,
a High Bound of 200 kg/h, anda StepSize of 5 kg/h. ClickRun.
Dist-009H Revised:Nov19,2012
18
4.36. Checkresults. Go to the Plotstab and youwill see thatthe reboilerdutyisthe lowestwhenthe solvent
recycle flowisaround 75 kg/h. You may try settingthe flowrate of Solvent-Recycle evenlower,butyou
will findthatthe flowsheetwill notconverge.
Dist-009H Revised:Nov19,2012
19
4.37. Double clickonstream Solvent-Recycle andenteraMass Flow of 75 kg/h. The flowsheetshould
converge aftera fewmoments.
4.38. Checkresults. Double clickoncolumn T-101 and go to the Cond./Reboilerformunderthe Performance
tab. Make note of the CondenserandReboilerDuty.
4.39. Double clickonenergystream Q-Cool andmake note of the coolingduty.
Dist-009H Revised:Nov19,2012
20
4.40. The total heatingdutyforthisdesignis 16,270 kcal/h and the total coolingdutyis 9,218 kcal/h.
4.41. Save thisthe HYSYS file as Dist-009H_Extraction.hsc.
5. Conclusions
Basedon the simulationresults, itwouldrequire 16,270 kcal/hof heatingand9,218 kcal/hof coolingto
separate the water–acetone mixture vialiquid-liquidextraction. Thisdesignisproventobe feasible,howeverit
may or may notbe the optimal design. Anotheroptionwouldbe directdistillationof waterandacetone. Direct
distillationof waterandacetone wouldrequire lessequipment, butitmayrequire more energy.
6. Copyright
Copyright © 2012 by Aspen Technology, Inc. (“AspenTech”). All rights reserved. This work may not be
reproduced or distributed in any form or by any means without the prior written consent of
AspenTech. ASPENTECH MAKES NO WARRANTY OR REPRESENTATION, EITHER EXPRESSED OR IMPLIED, WITH
RESPECT TO THIS WORK and assumes no liability for any errors or omissions. In no event will AspenTech be
liable to you for damages, including any loss of profits, lost savings, or other incidental or consequential
damages arising out of the use of the information contained in, or the digital files supplied with or for use with,
thiswork. This workand itscontentsare providedforeducational purposesonly.
AspenTech®, aspenONE®, and the Aspen leaf logo, are trademarks of Aspen Technology, Inc.. Brands and
productnamesmentionedinthisdocumentationare trademarksorservice marksof theirrespective companies.
Dist-010H Revised:Nov20,2012
1
Pressure Swing to Overcome Azeotropes with Aspen HYSYS® V8.0
Separation of Ethanol and Benzene
1. Lesson Objectives
 Learn howto use pressure swingtoseparate abinarymixture thatformsan azeotrope intotwo
pure components
2. Prerequisites
 Aspen HYSYS V8.0
 Introductiontoazeotropicmixtures
 Introductiontodistillation
3. Background
Ethanol and benzene formanazeotrope andthe azeotropiccompositionissensitive topressure. Therefore,itis
possible touse pressure swingtoseparate thisbinarymixture into pure components.
The examplespresentedare solelyintendedtoillustrate specificconceptsand principles. Theymay not
reflectan industrial application or real situation.
4. Problem Statement and Aspen HYSYS Solution
Problem Statement
The firstcolumnoperatesundera pressure of 3 bars and the secondone at 0.1 bar. A compressorisusedto
pressurize the recycle streamfrom 0.1bar to 3 bars before itisrecycledbackto the firstcolumn.
Since the relative volatilityislarge exceptforthe azeotrope point,thereisnoneedtoadd a thirdcomponent(as
a solvent).
Aspen HYSYS Solution
4.01. Start a newsimulation inAspenHYSYSV8.0.
4.02. Create a componentlist. Inthe ComponentLists folderselectAdd. AddEthanol and Benzene tothe
componentlist.
Dist-010H Revised:Nov20,2012
2
4.03. Define propertypackage. Inthe FluidPackagesfolderselectAdd. SelectPRSVas the propertypackage.
4.04. Go to the simulationenvironmentbyclickingthe Simulationbuttoninthe bottomleftof the screen.
4.05. We will firstaddtwo Material Streams to the flowsheet. Name one of the streams Feedandthe other
Recycle.
Dist-010H Revised:Nov20,2012
3
4.06. Double clickonthe Feedstream. Thiswill be the ethanol-benzenefeedtothe process. Inthe
Worksheettabentera Vapour Fraction of 0.5, a Pressure of 3 bar, anda Molar Flowof 100 kgmole/h.
In the CompositionformenterMole Fractions of 0.5 for both ethanol andbenzene.
4.07. We will nowdefine the stream Recycle. Thisstreamwill consistof ethanol andbenzenevaporsthat
come off the topof the secondcolumn,whichwe will recyclesowe don’tthrow awayany product.
Double clickonthe Recycle stream. Inthe Worksheettabentera Vapour Fraction of 1, a Pressure of 3
bar, and a Molar Flowof 200 kgmole/h. In the Compositiontab enterMole Fractions of 0.5 for both
ethanol and benzene.These valuesare initialestimates.Theywill eventuallybe replacedbythe actual
recycledproduct.
Dist-010H Revised:Nov20,2012
4
4.08. We are now readyto add a DistillationColumnSub-Flowsheettothe flowsheetfromthe Model
Palette.
Dist-010H Revised:Nov20,2012
5
4.09. Double clickthe distillationcolumn(T-100). Thiswill launchthe DistillationColumnInputExpert. On
Page 1 specifythe followinginformation. Change the #Stages to 30 and selectstreams Feedand
Recycle to enteron stage 10. SelectFull Reflux forCondenser,create anOvhd Vapour Outletstream
calledVap,a Bottoms LiquidOutletcalledBenzene,anda CondenserEnergyStream calledQ-Cond1.
Whencomplete click Next.
4.10. On Page 2 of the DistillationColumnInput Expert selectaOnce-through,Regular Hysys reboiler.Click
Next.
4.11. On Page 3 of the DistillationColumnInput Expert enterCondenserandReboilerPressures of 3 bar.
For thissimulationwe will assume nopressuredropthroughthe column. Inreal life thiswouldn’tbe
the case. Click Next.
Dist-010H Revised:Nov20,2012
6
4.12. Page 4 asks for Temperature estimates. These are optionalvaluesthatwill helpthe columnsolver
converge. Forthiscolumnwe will leave all estimatesblank. ClickNext.
4.13. On the final page of the expertentera RefluxRatio of 3. Click Done.
Dist-010H Revised:Nov20,2012
7
4.14. The Column: T-100 windowwill now appear. We mustdefine the designspecificationsforthe column.
We have alreadyspecifiedthe reflux ratio,butwe still needtospecifythe molefractionof benzene in
the bottomsstream. Firstgo to the SpecsSummary form and make sure that onlythe RefluxRatio
specificationischeckedasactive.
Dist-010H Revised:Nov20,2012
8
4.15. Nowwe will create a specificationforthe mole fractionof benzene inthe bottomsstream. Goto the
Specs formunderthe Designtab. Click Add and selectColumnComponentFraction. SelectStreamfor
Target Type, Benzene forDraw, enter0.999 for SpecValue,and selectBenzene forComponent.
4.16. The Degreesof Freedomforthe columnshouldnow be 0. Clickthe Run buttonto begincalculations.
The columnshouldquicklyconverge.
Dist-010H Revised:Nov20,2012
9
4.17. We will nowinsertasecond DistillationColumnSub-Flowsheet.
4.18. Double clickonthe secondcolumn(T-101) to openthe DistillationColumnInput Expert. Onthe first
page change the # Stages to 30 and selectthe stream Vap to enteronstage 10. SelectFull Reflux for
the Condenser,create an Ovhd Vapour OutletcalledRec,a Bottoms LiquidOutletcalledEthanol,and a
CondenserEnergyStream calledQ-Cond2. Click Nextwhencomplete.
Dist-010H Revised:Nov20,2012
10
4.19. On Page 2 of the DistillationColumnInput Expert leave the defaultselectionsfora Once-through,
Regular Hysys reboiler. Click Next.
Dist-010H Revised:Nov20,2012
11
4.20. On Page 3 of the DistillationColumnInput Expert enterCondenserandReboilerPressures of 0.1 bar.
ClickNextwhencomplete.
4.21. On Page 4 of the DistillationColumnInput Expert leave all fieldsfortemperature estimatesblank. Click
Next.
Dist-010H Revised:Nov20,2012
12
4.22. On the final page of the DistillationColumnInput Expert entera RefluxRatio of 1. Click Done when
complete toconfigure the column.
4.23. Go to the SpecsSummary form underthe Designtab. We wishtospecifythe reflux ratioandthe mole
fractionof ethanol inthe bottomsstream. We have alreadyspecifiedthe reflux ratio,butwe still need
to create a specificationforthe mole fractionof ethanol inthe bottoms. First,make sure thatthe only
currentactive specificationisthe RefluxRatio.
4.24. Nowwe will create a specificationforthe mole fractionof ethanol inthe bottomsstream. Goto the
Specs formunderthe Designtab. Click Add and selectColumnComponentFraction. SelectStreamfor
Target Type, Ethanol for Draw, enter0.999 for SpecValue,and selectEthanol for Component.
Dist-010H Revised:Nov20,2012
13
4.25. The Degreesof Freedomforthe columnshouldnow be 0. Clickthe Run buttonto begincalculations.
The columnshouldconverge.
Dist-010H Revised:Nov20,2012
14
4.26. Before we connectthe recycle loopwe mustfirstadda compressortoraise the pressure of stream Rec.
Adda Compressorto the flowsheetfromthe Model Palette.
Dist-010H Revised:Nov20,2012
15
4.27. Double clickonthe compressor(K-100). SelectstreamRecas the Inlet. Create an OutletcalledRec-
HighP and an Energy streamcalled Q-Comp.
4.28. In the Worksheettabenteran outlet Pressure of 3 bar. The compressorshouldsolve.
Dist-010H Revised:Nov20,2012
16
4.29. We are now readyto connectthe recycle loop. Adda Recycle blockto the flowsheetfromthe Model
Palette.
4.30. Double clickonthe recycle block(RCY-1). SelectstreamRec-HighPasthe Inletand selectstream
Recycle as the Outlet. The flowsheetshouldsolve afterafew moments.
Dist-010H Revised:Nov20,2012
17
4.31. The flowsheetisnowcomplete. Checkresults. Double clickonstream Benzene andstreamEthanol.
You will findthatthe flowrate of eachstreamisroughly 50 kgmole/hwitha mole fractionof 0.999 of
each respectiveproduct.
Dist-010H Revised:Nov20,2012
18
5. Conclusions
Pressure swingdistillationcanbe a good methodforseparating abinarymixture thatformsan azeotrope when:
 The azeotropiccompositionissensitive to apressure change
 The relative volatilityof the twocomponentsislarge exceptatthe azeotropicpoint
6. Copyright
Copyright© 2012 by AspenTechnology,Inc.(“AspenTech”). All rightsreserved. Thisworkmaynot be
reproducedordistributedinanyformor byany meanswithoutthe priorwrittenconsentof
AspenTech. ASPENTECHMAKESNOWARRANTYOR REPRESENTATION,EITHER EXPRESSEDOR IMPLIED, WITH
RESPECT TO THIS WORK and assumesnoliabilityforanyerrorsor omissions. Innoeventwill AspenTechbe
liable toyoufordamages,includinganylossof profits,lostsavings,orotherincidental orconsequential
damagesarisingoutof the use of the informationcontainedin,orthe digital filessuppliedwithorforuse with,
thiswork. This workand itscontentsare providedforeducational purposesonly.
AspenTech®,aspenONE®,andthe Aspenleaf logo,are trademarksof AspenTechnology,Inc.. Brandsand
productnamesmentionedinthisdocumentationare trademarksorservice marksof theirrespective companies.
Dist-011H Revised:Nov20,2012
1
Azeotropic Distillation with Aspen HYSYS® V8.0
Production of Anhydrous Ethanol Using an Entrainer
1. Lesson Objectives
 Designa separationtrainforanhydrousethanol productionusingcyclohexaneasanentrainer
 Include recycle of cyclohexane and the azeotropicmixture so thatthe recoveryof ethanol is>99.5%
and the recoveryof cyclohexane is nearly 100%
 Successfully converge aflowsheetwithmultiple recyclestreams
 Configure athree phase distillationcolumn
2. Prerequisites
 Aspen HYSYS V8.0
 Understandingof azeotropes
3. Background
Ethanol productionviafermentationoccursinwater,whichmustlaterbe separatedtomake anhydrousethanol
(99.95% ethanol). There isanazeotrope inthe ethanol-watersystematapproximately95mol-% ethanol, which
isa barrierto separation. Cyclohexaneisone of the solventsusedforthe productionof anhydrousethanol for
foodand pharmaceutical usage. Itisusedas an entrainer:the ternarymixture formsaternaryazeotrope witha
differentethanol concentration,whichallowsethanoltoenrichinthe otherstream. The azeotropicliquidis
separatedtorecoverthe entrainerand the ethanol thatexitsthe columninthe azeotropicmixture.
The examplespresentedare solelyintendedtoillustrate specificconceptsand principles. Theymay not
reflectan industrial application or real situation.
4. Problem Statement and Aspen HYSYS Solution
Problem Statement
The feedto the separationtrainisa streamat 100 kgmole/hwith87mol-% ethanol and13 mol-% water.
Cyclohexaneis addedtothe column,and> 99.95 mol-% ethanol exitsthe bottomof the column. The distillateis
thenseparatedinthree phase condenser. The cyclohexane-richstreamisrecycleddirectlytothe firstcolumn,
while the water- andethanol-richstreamissenttoa secondcolumnfromwhichalmost-pure waterexitsinthe
bottoms. The distillate of the secondcolumnisrecycledtothe firstcolumn.
Designthe separationtrainsothat the ethanol productstream meetsthe purityspecification andthe water
effluentstreamhasa purityof 99mol-%.
Dist-011H Revised:Nov20,2012
2
Aspen HYSYS Solution
Thismodel isbuiltusingaspecificpath.The orderin whichthingsare done isimportantforsuccessful
convergence of the model.Donotreinitializethe rununlessaskedto,andif stepsare skippedordone outof
orderyou mayneedto be start at the beginningorfroma previouslysavedversion.
4.01. Start a newsimulation inAspenHYSYSV8.0.
4.02. Create a componentlist. Inthe ComponentLists folderclick Add. AddEthanol, Water,and
Cyclohexane tothe componentlist.
4.03. Selectpropertypackage. Inthe FluidPackages folderclick Add. SelectPRSVas the propertypackage.
4.04. Go to the simulationenvironmentbyclickingthe Simulationbuttoninthe bottomleftof the screen.
4.05. We will beginbyaddingthe feedandrecycle streamstothe flowsheet. Addfour Material Streamsand
a Mixerto the flowsheet. Name themasshownbelow.
Dist-011H Revised:Nov20,2012
3
4.06. Double clickonthe mixer(MIX-100). Selectstreams Make Up and SolventRecycle as Inletsand create
an OutletcalledSolvent.
Dist-011H Revised:Nov20,2012
4
4.07. In orderfor the mixertosolve,we mustdefine the inletstreams. Double clickonstream Make Up. This
streamwill adda small amountof solventtothe systemto accountfor any solventlossestoproduct
streams. We will laterimplementanadjustblocktosolve forthe correct flow rate of solvent,butfor
nowwe will enterasmall numberasa guess. Inthe Worksheettabentera Temperature of 25°C, a
Pressure of 1 bar, anda Molar Flowof 0.01 kgmole/h. Inthe Compositionformentera Mole Fraction
of 1 for cyclohexane.
4.08. Double clickonthe SolventRecycle stream. Thisstreamwill be the solventthat exitsthe condenserof
the firstcolumnand will be recycledandfedbackintothe column. We will adda recycle blockthat will
calculate the correct flowrate andcomposition,butfornow we will enteraninitial guess. Inthe
Worksheettabentera Temperature of 25°C, a Pressure of 1 bar, anda Molar Flowof 400 kgmole/h. In
the CompositionformenterMole Fractions of 0.5 for cyclohexane andethanol.
Dist-011H Revised:Nov20,2012
5
4.09. The mixershouldnowsolve.
Dist-011H Revised:Nov20,2012
6
4.10. We will nowdefine the FeedandFeedRecycle streams. Double click onthe Feedstream. Thisisthe
streamthat pumpsthe ethanol-watermixtureintothe process. Entera Vapour Fraction of 0.3, a
Pressure of 1 bar, anda Molar Flowof 100 kgmole/h. Inthe CompositionformenterMole Fractionsof
0.87 forEthanol and 0.13 forWater.
4.11. Lastlywe will definethe FeedRecycle stream. Thisstreamwill be the ethanol-watermixture thatexits
the condenserof the secondcolumn. Thisstreamwill be fedbackto the firstcolumnto preventlosses
of ethanol. Lateronwe will implementarecycle blocktocalculate the actual specificationsforthis
stream,butfor nowwe will enteraninitial guess. Doubleclickonthe FeedRecycle stream. Inthe
Worksheettabentera Vapour Fraction of 0, a Pressure of 1 bar, and a Molar Flowof 25 kgmole/hr. In
the CompositionformenterMole Fractions of 0.7 for Ethanol, and 0.3 forWater.
Dist-011H Revised:Nov20,2012
7
4.12. Remembertofrequentlysave yourprogressasyouare creatingthissimulation. Save thisfileas Dist-
011_Azeotropic_Distillation.hsc.
4.13. We are now readyto inserta Three Phase DistillationColumntothe flowsheet.
Dist-011H Revised:Nov20,2012
8
4.14. Double clickonthe column(T-100) to openthe Three Phase Column InputExpert window. Inthe first
windowthatappearsselectthe Distillationradiobutton. Click Next.
4.15. In the nextwindow,change the NumberofStages to 62. Make sure thatthe Condenserisselectedto
checkfor two liquidphases. Click Nextwhencomplete.
Dist-011H Revised:Nov20,2012
9
4.16. In the thirdwindow,selectthe Total radio buttonforCondenserType. Create a Light Outletstream
calledSol-Rec,aHeavy Outlet streamcalled C2-Feed,andanEnergy streamcalled Q-Cond. Click Next
whencomplete.
4.17. In the fourthwindow,leaveall fieldsblankandclick Next.
Dist-011H Revised:Nov20,2012
10
4.18. The DistillationColumnInput Expert window will now appear. Selectstreams Feed,FeedRecycle,and
Solventas InletStreams. Specifystreams FeedandFeedRecycle toenteron stage 20, and stream
Solventto enteronstage 1. Create a Bottoms LiquidOutletstream called ETOH. Click Nextwhen
complete.
4.19. On Page 2 of the DistillationColumnInput Expert clickNext.
Dist-011H Revised:Nov20,2012
11
4.20. On Page 3 of the DistillationColumnInput Expert enterCondenserandReboilerPressuresof 1 bar.
ClickNextwhencomplete.
4.21. On Page 4 of the DistillationColumnInput Expert leave all fieldsfortemperature estimatesblank. Click
Next.
Dist-011H Revised:Nov20,2012
12
4.22. On the final page of the DistillationColumnInput Expert clickDone to configure the column.
4.23. The Column: T-100 windowshouldautomaticallyopen. We mustdefine the designspecificationsfor
thiscolumn. Go to the Specs Summary form underthe Designtab. For thiscolumnwe will specifythe
Heavy RefluxRatio, the Light RefluxRatio, and the Mole Fraction of Ethanol inthe bottoms. Entera
value of 3.5 for the Heavy RefluxRatio and a value of 1 for the Light RefluxRatio. Firstuncheckthe
active box for Bot Product Rate andcheck the active boxesfor Light RefluxRatio and Heavy Reflux
Ratio.
Dist-011H Revised:Nov20,2012
13
4.24. We mustcreate a specificationforthe mole fractionof ethanol inthe bottomsstream. Goto the Specs
formunderthe Design tab. Click Addand selectColumnComponentFraction. SelectStreamfor Target
Type, ETOH for Draw, enter0.9995 forSpec Value,and Ethanol forComponent. The columnshould
automaticallysolve.
Dist-011H Revised:Nov20,2012
14
4.25. Again,be sure to periodicallysave yoursimulationasyoumake progress.
4.26. Before we constructthe secondcolumn,we will addan Adjust blockand a Spreadsheettofindthe
correct flowrate forthe Make Up stream.
4.27. Double clickonthe spreadsheet(SPRDSHT-1). Goto the Spreadsheettab. Enter the followingtextin
cellsA1 and A2.
Dist-011H Revised:Nov20,2012
15
4.28. Rightclickon cell B1 andselectImport Variable. Selectthe MasterComp Molar Flow of Cyclohexane in
streamETOH.
4.29. Rightclickon cell B2 andselectImport Variable. Selectthe MolarFlow of the Make Upstream. Having
these twoflowratesside byside will easilyallow youtocheckthat the amountof solventleavingthe
systemisequal tothe amount of solvententeringthe system.
Dist-011H Revised:Nov20,2012
16
4.30. As youcan see fromthe spreadsheetthere ismore solventleavingthe systemthanisentering. Thiswill
cause convergence issueswhenwe attempttoclose the recycle streams. Thisiswhere we willuse the
adjustblock. Double clickonthe adjustblock(ADJ-1). Selectthe AdjustedVariable to be the Molar
Flowof the Make Up stream,selectthe Target Variable to be the Master Comp Molar Flow
(Cyclohexane) of streamETOH, andset the Target Value to cell B2 inthe spreadsheet.
Dist-011H Revised:Nov20,2012
17
4.31. The adjustblockwill varythe Make Up streamflowrate until the amountof solventleavingthe system
equalsthe amountenteringthe system. Goto the Parameters tab. Change the Tolerance to 0.001
kgmole/hand change the StepSize to 0.01 kgmole/h. Clickthe Start buttonto begincalculations. After
a fewmomentsthe flowsheetwill converge.
4.32. Openthe spreadsheetandyouwill see thatthe solventleavingthe systemisnow equal tothe solvent
enteringthe system.
4.33. Save the simulation.
Dist-011H Revised:Nov20,2012
18
4.34. We will nowadda Recycle blockto close the recycle loopforthe solvent.
4.35. Double clickonthe recycle block(RCY-1). Selectthe Inletstreamtobe Sol-Recandselectthe Outlet
streamto be SolventRecycle. The flowsheetshouldconverge afterafew moments.
Dist-011H Revised:Nov20,2012
19
4.36. We are now readyto add the secondcolumn. Adda DistillationColumnSub-Flowsheetfromthe Model
Palette.
4.37. Double clickonthe column(T-101) to openthe DistillationColumnInput Expert window. Change #
Stages to 50 and selectstream C2 Feedasthe Inletstreamenteringonstage 35. SelectTotal for
Condenserandcreate an Ovhd Liquid OutletcalledFeedRec,a Bottoms Liquid OutletcalledWater,
and a CondenserEnergyStream calledQ-Cond2. ClickNextwhencomplete.
Dist-011H Revised:Nov20,2012
20
4.38. On Page 2 of the DistillationColumnInput Expert leave the defaultselectionsfora Once-through,
Regular Hysys reboiler. Click Next.
Dist-011H Revised:Nov20,2012
21
4.39. On Page 3 of the DistillationColumnInput Expert enterCondenserandReboilerPressures of 1 bar.
ClickNextwhencomplete.
4.40. On Page 4 of the DistillationColumnInput Expert leave all fieldsblankfortemperature estimates. Click
Next.
Dist-011H Revised:Nov20,2012
22
4.41. On the final page of the DistillationColumnInput Expert entera RefluxRatio of 0.5. ClickDone when
complete toconfigure the column.
4.42. The Column: T-101 windowshouldautomaticallyopen. We needtodefine anotherdesignspecification
inorder forthe columntosolve. Go to the SpecsSummary formunderthe Design tab andmake sure
that the RefluxRatio is the onlyactive specification.
4.43. We mustnowcreate a specificationforthe mole fractionof waterinthe bottomsstream. Go to the
Specs formunderthe Designtab. Click Add and selectColumnComponentFraction. SelectStream for
Target Type, Waterfor Draw, enter0.99 for SpecValue,and selectH2O for Component.
Dist-011H Revised:Nov20,2012
23
4.44. The Degreesof Freedomforthe columnshouldnow be 0. Click Run to begincalculations. The column
shouldsolve.
Dist-011H Revised:Nov20,2012
24
4.45. Save the simulation.
4.46. The last stepisto connectthe FeedRecycle loop. Adda Recycle blockto the flowsheet.
4.47. Double clickonthe recycle block(RCY-2). SelectstreamFeedRecas the Inletand streamFeedRecycle
as the Outlet. The flowsheetwillbegintosolve. Afteraminute ortwothe flowsheetwill solve. Be
patientasthere are manyvariablesattemptingtoconverge. Ateachiterationbothrecycle loopsmust
converge,bothcolumnsmustconverge,andthe adjustblockmustconverge.
Dist-011H Revised:Nov20,2012
25
4.48. The flowsheetisnowcomplete andshouldlooksimilartothe following.
Dist-011H Revised:Nov20,2012
26
5. Conclusions
In thisexample, cyclohexaneisusedasthe entrainertoseparate waterandethanol toproduce anhydrous
ethanol. Byusingthe properamountof solvent,we obtainpure ethanolfromthe bottomof the firstcolumn.
The stream fromthe top of the firstcolumnisseparatedintotwostreams usingathree phase condenser:One
streamis solventrichandisrecycledbackto the firstcolumn as solvent;the otherstreamiswell withinanother
distillationregionsothatwe can use the secondcolumntoobtainpure water. The topstream of the second
columnisrecycledbackto the firstcolumnasfeed.
6. Copyright
Copyright© 2012 by AspenTechnology,Inc.(“AspenTech”). All rightsreserved. Thisworkmaynot be
reproducedordistributedinanyformor byany meanswithoutthe priorwrittenconsentof
AspenTech. ASPENTECHMAKESNOWARRANTYOR REPRESENTATION,EITHER EXPRESSEDOR IMPLIED, WITH
RESPECT TO THIS WORK and assumesnoliabilityforanyerrorsor omissions. Innoeventwill AspenTechbe
liable toyoufordamages,includinganylossof profits,lostsavings,orotherincidental orconsequential
damagesarisingoutof the use of the informationcontainedin,orthe digital filessuppliedwithorforuse with,
thiswork. This workand itscontentsare providedforeducational purposesonly.
AspenTech®,aspenONE®,andthe Aspenleaf logo,are trademarksof AspenTechnology,Inc.. Brandsand
productnamesmentionedinthisdocumentationare trademarksorservice marksof theirrespective companies.
Dist-012H Revised:Nov19,2012
1
Extractive Distillation for Heptane-Toluene Separation using
Aspen HYSYS® V8.0
1. Lesson Objectives
 Essentialsof extractivedistillation
 How to compare designalternatives
2. Prerequisites
 Aspen HYSYS V8.0
 Introductiontodistillation
3. Background
Whenthe two componentsinabinarymixture have veryclose normal boilingpoints,theirrelativevolatilityis
likelytobe small if theydonotform an azeotrope. Forsuchcases,it may be more efficienttouse extractive
distillation withasolventthannormal distillation. Inextractive distillation,alessvolatile solventisusedto
increase the relative volatilitiesof the original mixtures,allowingforeasierseparation. Inthisexample,phenol
isusedas the solventforthe separationof n-heptane andtoluene.
The examplespresentedare solelyintendedtoillustrate specificconceptsand principles. Theymay not
reflectan industrial application or real situation.
4. Problem Statement and Aspen HYSYS Solution
Problem Statement
Determine whetherconventional distillationorextractivedistillationwithphenol asasolventis a more efficient
methodtoseparate n-heptane andtoluene.
Aspen HYSYS Solution
4.01. We will buildmodelstosimulate the separationof n-heptane andtoluene. One modelhasa single
distillation columnandthe otheruses the extractivedistillationapproachwithtwocolumns. First we
will buildasimulationforasingle distillationcolumn. Starta new simulationusing inAspenHYSYSV8.0.
4.02. Create a componentlist. Inthe ComponentLists folderselectAdd. Addn-Heptane and Toluene tothe
componentlist.
Dist-012H Revised:Nov19,2012
2
4.03. Selectpropertypackage. Inthe FluidPackages folderselectAdd. SelectNRTLas the propertypackage
and selectRK as the Vapour Model.
4.04. Go to the simulationenvironmentbyclickingthe Simulationbuttoninthe bottomleftof the screen.
Dist-012H Revised:Nov19,2012
3
4.05. Place a DistillationColumnSub-Flowsheetonthe mainflowsheetfromthe Model Palette.
4.06. Double clickonthe column(T-100) to openthe DistillationColumnInput Expert. On Page 1 enterthe
followinginformationandclick Nextwhencomplete.
Dist-012H Revised:Nov19,2012
4
4.07. On Page 2 of the Input Expert leave the defaultselectionsfora Once-through,Regular Hysys reboiler.
ClickNext.
4.08. On Page 3 of the Input Expert enterCondenserandReboilerPressuresof 1 bar. Click Nextwhen
complete.
Dist-012H Revised:Nov19,2012
5
4.09. On Page 4 and 5 of the InputExpert leave all fieldsempty. Click Done onthe final page toconfigure the
column.
4.10. In the Column:T-100 windowgotothe Worksheettabto specifythe feedstream. Forthe Feedstream
entera Vapour Fraction of 0.5, a Pressure of 1 bar, and a Molar Flowof 100 kgmole/h.
4.11. In the Compositionformunderthe WorksheettabenterMole Fractions of 0.5 forboth components.
Thisstreamshouldsolve.
4.12. Nowwe must define the columndesignspecifications. Goto the SpecsSummary form underthe
Designtab. Uncheck the Active boxessothat there are noactive specifications.
Dist-012H Revised:Nov19,2012
6
4.13. Go to the Specsformunderthe Designtab. We want to add a specificationforthe mole purityof both
productstreams. Click Add and selectColumnComponentFraction. SelectStreamfor Target Type,
Heptane for Draw, enter0.99 for SpecValue,and selectn-Heptane forComponent.
4.14. Adda similarspecificationforthe mole fractionof tolueneinthe bottomsproductstream.
Dist-012H Revised:Nov19,2012
7
4.15. Afterenteringbothdesignspecificationsthe DegreesofFreedomshouldnow be 0. Click Run to begin
calculations. The columnshouldconverge.
4.16. Go to the Cond./Reboilerformunderthe Performance tab. Make a note of boththe Condenserand
Reboilerduties. The CondenserDutyis5.390e+006 kcal/h and the ReboilerDuty is5.388e+006 kcal/h.
Dist-012H Revised:Nov19,2012
8
4.17. Save thisfile as Dist-012H-Single_Column.hsc.
4.18. We will nowcreate asecondsimulation,thistimeusingextractive distillation. Create anew file in
AspenHYSYS V8.0.
4.19. Create a componentlist. Inthe ComponentLists folderselectAdd. Addn-Heptane,Toluene,and
Phenol to the componentlist.
4.20. Selectpropertypackage. Inthe FluidPackages folderselectAdd. SelectNRTLas the propertypackage
and selectRK as the Vapour Model.
Dist-012H Revised:Nov19,2012
9
4.21. Go to the simulationenvironmentbyclickingthe Simulationbuttoninthe bottomleftof the screen.
4.22. Adda DistillationColumnSub-Flowsheettothe mainflowsheetfromthe Model Palette.
Dist-012H Revised:Nov19,2012
10
4.23. Double clickonthe column(T-100) to openthe DistillationColumnInput Expert. Enter the following
informationon Page 1 and click Next whencomplete.
Dist-012H Revised:Nov19,2012
11
4.24. On Page 2 of the Input Expert leave the defaultselectionsfora Once-through,Regular Hysys reboiler.
ClickNextwhencomplete.
4.25. On Page 3 of the Input Expert enterCondenserandReboilerPressuresof 1 bar. Click Nextwhen
complete.
4.26. On Page 4 and 5 leave all fieldsempty. ClickDone onthe final page to configure the column.
4.27. Firstwe must define the feedstreams. Inthe Column:T-100 window goto the Worksheettab. For the
Feedstreamentera Vapour Fraction of 0.5, a Pressure of 1 bar, and a Molar Flow of 100 kgmole/h.
For the Solventstreamentera Temperature of 181°C, a Pressure of 1 bar, and a Molar Flow of 60
kgmole/h.
Dist-012H Revised:Nov19,2012
12
4.28. In the Compositionformunderthe WorksheettabenterMole Fractions of 0.5 forn-Heptane and
Toluene inthe Feedstream,and a Mole Fraction of 1 for Phenol inthe Solventstream. Bothstreams
shouldsolve.
4.29. We mustnowdefine ourdesignspecificationsforthe column. Goto the SpecsSummary sheetunder
the Designtab. We want to specifyadistillate productrate of 50 kgmole/h withamole fractionof 0.99
n-Heptane. Enter50 kgmole/h inthe fieldforVentRate and uncheckthe active box for RefluxRatio.
Dist-012H Revised:Nov19,2012
13
4.30. Go to the Specsformunderthe Designtab. Here we will adda specificationforthe mole fractionof
heptane inthe distillate stream. Click AddandselectColumnComponentFraction. SelectStreamfor
Target Type, Heptane for Draw, enter0.99 forSpec Value,and selectn-Heptane forComponent.
4.31. The Degreesof Freedomforthe columnshouldnow be 0. Click Run to begincalculations. The column
shouldsolve.
4.32. We mustnowadd a secondcolumnto separate the solventfromthe tolueneinthe Rich-Solvent
stream. Inserta second DistillationColumnSub-Flowsheetfromthe Model Palette.
Dist-012H Revised:Nov19,2012
14
4.33. Double clickonthe secondcolumn(T-101) to openthe DistillationColumnInput Expert. OnPage 1
enterthe followinginformationandclick Nextwhencomplete.
4.34. On Page 2 of the Input Expert leave the defaultselectionsforOnce-through,RegularHysys reboiler.
ClickNext.
4.35. On Page 3 of the Input Expert enterCondenserandReboilerPressuresof 1 bar. Click Nextwhen
complete.
Dist-012H Revised:Nov19,2012
15
4.36. On Page 4 and 5 of the InputExpert leave all fieldsblankandclick Done on the final page toconfigure
the column.
4.37. We mustdefine the designspecificationsforthissecondcolumn. Goto the Spec Summary formunder
the Designtab. Uncheck the active boxessothat there are no active specifications.
4.38. Go to the Specsformunderthe Designtab. Here we will create twospecificationsforthe mole
fractionsof toluene andphenol inthe productstreams. Click Addand selectColumnComponent
Fraction. SelectStreamfor Target Type,Toluene forDraw, enter0.99 for SpecValue,and select
Toluene forComponent.
Dist-012H Revised:Nov19,2012
16
4.39. Adda similarspecificationforthe mole fractionof phenol inthe bottomsproductstream. Enter.99999
for SpecValue.
4.40. The Degreesof Freedomforthe columnshouldnow be 0. Click Run to begincalculations. The column
shouldconverge.
Dist-012H Revised:Nov19,2012
17
4.41. We will nowrecycle the Lean-Solventstreambacktothe firstcolumn.Adda Recycle blockto the
flowsheetfromthe Model Palette.
Dist-012H Revised:Nov19,2012
18
4.42. Double clickonthe recycle block(RCY-1). SelectstreamLean-Solventasthe Inletandstream Solventas
the Outlet. The recycle blockshouldsolve.
4.43. Checkresults. Double clickonthe firstcolumn(T-100) andgo to the Cond./Reboilerformunderthe
Performance tab. Make note of the CondenserandReboilerDuties.
Dist-012H Revised:Nov19,2012
19
4.44. Double clickthe secondcolumn(T-101) and go to the Cond./Reboilerformunderthe Performance tab.
Make a note of the CondenserandReboilerDuties.
4.45. The followingtable will summarizethe energyrequirementsfromthe case with1 columnversus the
case usingextractive distillation.
Single Column Distillation Extractive Distillation
Total Heating Duty (kcal/h) 5,388,000 1,803,000
Total Cooling Duty (kcal/h) 5,390,000 1,410,000
5. Conclusions
For the separationof n-heptane andtoluene,extractive distillationhas asignificantadvantage intotal energy
requirements. Addingphenolasa solventincreasedthe relative volatilitiesof n-heptane andtolueneinthe
mixture andallowedforamuch easierseparation. However,extractive distillationrequiredmore equipmentin
thiscase.Therefore afurtheranalysisoncapital versusoperationalcostswouldhave tobe performedinorder
to make a decisionasto whichdesignisthe betteroption.
Dist-012H Revised:Nov19,2012
20
6. Copyright
Copyright© 2012 by AspenTechnology,Inc.(“AspenTech”). All rightsreserved. Thisworkmaynotbe
reproducedordistributedinanyformor byany meanswithoutthe priorwrittenconsentof
AspenTech. ASPENTECHMAKESNOWARRANTYOR REPRESENTATION,EITHER EXPRESSEDOR IMPLIED, WITH
RESPECT TO THIS WORK and assumesnoliabilityforanyerrorsor omissions. Innoeventwill AspenTechbe
liable toyoufordamages,includinganylossof profits,lostsavings,orotherincidental orconsequential
damagesarisingoutof the use of the informationcontainedin,orthe digital filessuppliedwithorforuse with,
thiswork. This workand itscontentsare providedforeducational purposesonly.
AspenTech®,aspenONE®,andthe Aspenleaf logo,are trademarksof AspenTechnology,Inc.. Brandsand
productnamesmentionedinthisdocumentationare trademarksorservice marksof theirrespective companies.
Dist-017H Revised:November6,2012
1
Sour Water Stripper with Aspen HYSYS® V8.0
1. Lesson Objectives
 Configure distillationcolumn
 Configure heatexchanger
 Optimize columnfeedtemperature
2. Prerequisites
 Aspen HYSYS V8.0
 Introductiontodistillation
3. Background
Many refineryoperationsproduce whatiscalledsourwater. Anyrefineryprocesswaterthatcontainssulfidesis
consideredtobe sourwater. Sour watertypicallycontainsammoniaandhydrogensulfide,whichmustbe
removedbefore the watercanbe repurposedorsenttoa wastewatersystem. Inthislessonwe willsimulate
thisprocessas well asanalyzingthe effectthatfeedtemperaturehasonthe column.
The examplespresentedare solelyintendedtoillustrate specificconceptsand principles. Theymay not
reflectan industrial application or real situation.
4. Problem Statement and Aspen HYSYS Solution
Problem Statement
Constructa simulationof asour waterstripperusing AspenHYSYS. A sour waterstream containingmass
fractionsof 0.988 water,0.005 ammonia,and0.007 hydrogensulfideisproducedfromacrude tower. This
streamis at 37.78°C, 2.758 bar, andhas a massflow of 328,900 kg/h. The goal isto produce a pure water
streamwitha maximumof 0.00005 mole % ammoniawhile recovering99% of the waterin the feedstream.
Dist-017H Revised:November6,2012
2
Aspen HYSYS Solution
4.01. Create a newsimulationin AspenHYSYSV8.0.
4.02. Create a componentlist. Inthe ComponentList folderselectAdd. AddWater, Ammonia,and
Hydrogen Sulfide tothe componentlist.
4.03. Define propertypackage. Inthe FluidPackagesfolderselectAdd. SelectSourPR as the property
package. The SourPR model combinesthe Peng-Robinsonequationof state andWilson’sAPI-Sour
Model for handlingsourwatersystems.
4.04. Enter the simulationenvironmentbyclickingthe Simulationbuttoninthe bottomleftof the screen.
4.05. Adda Material Stream to the flowsheetfromthe Model Palette. Thisstreamwill serve asoursour
waterfeed.
Dist-017H Revised:November6,2012
3
4.06. Double clickonthe material stream(1). In the Worksheettab,rename thisstream Sour Water. Entera
Temperature of 37.78°C, a Pressure of 2.758 bar, and a Mass Flow of 328,900 kg/h.
Dist-017H Revised:November6,2012
4
4.07. In the Compositionformunderthe Worksheettab,enterMass Fractions of 0.988 for H2O, 0.007 for
H2S, and0.005 for Ammonia. The streamshouldnow be fully definedandwill solve.
4.08. Adda Heaterto the flowsheetfromthe Model Palette. Thisheaterwillserve toheatthe sourwater
streambefore itentersthe column.
4.09. Double clickonthe heater(E-100). SelectstreamSour Wateras the Inlet,create an Outletstream
calledStripperFeed,andcreate an Energy streamcalled Q-Heat.
Dist-017H Revised:November6,2012
5
4.10. In the Parameters formunderthe Designtab, specifyaDelta P of 0.6895 bar.
4.11. In the Worksheettabenteran outlet Temperature of 100°C. The heatershouldsolve.
Dist-017H Revised:November6,2012
6
4.12. Adda DistillationColumnSub-Flowsheetfromthe Model Palette.
4.13. Double clickonthe column(T-100). The DistillationColumnInput Expertwill open. Onpage 1 of the
inputexpertenterthe followinginformationandclick Nextwhencomplete.
Dist-017H Revised:November6,2012
7
4.14. On Page 2 of the Input Expert,leave the defaultsettingsfora Once-through,Regular Hysys reboiler.
ClickNext.
4.15. On Page 3 of the Input Expert,entera CondenserPressure of 1.979 bar and a ReboilerPressure of
2.255 bar. Click Nextwhencomplete.
Dist-017H Revised:November6,2012
8
4.16. On Page 4 of the Input Expert leave all fieldsfortemperature estimatesblank. Click Next. Onthe final
page of the Input Expert leave all fieldsblankandclick Done toconfigure the column.
4.17. The Column: T-100 windowwill automaticallyappear. Goto the Specs formunderthe Designtab to
complete the columnspecifications. Firstwe will create aspecificationforthe mole fractionof
ammoniainthe reboiler. Click AddandselectColumnComponentFraction. SelectReboilerforStage,
enter0.00005 forSpec Value,andselectAmmoniafor Component.
4.18. We alsowouldlike torecover99% of the water fromthe feedstream. Create thisspecificationby
clickingAddand selectingColumnComponentRecovery. SelectWaterforDraw, enter0.99 forSpec
Value,and selectH2O forComponent.
Dist-017H Revised:November6,2012
9
4.19. Go to the SpecsSummary form and make sure that the onlyactive specificationsare CompFractionand
Comp Recovery. Once these twospecificationsare made active the columnwill attempttosolve. If the
solverfailstoconverge youmayneedtotake a lookat the Damping Factor.
4.20. Go to the Solverformunderthe Parameters tab. You will notice adefault DampingFactor of 1. The
dampingfactorservestoreduce the amplitude of oscillationsthatoccurinthe solver. Oftentimes
convergence canbecome cyclic,whichcanpreventthe solverfromfindingasolution. Thisiswhere a
dampingfactorbecomesuseful. If youclickthe Troubleshootingiconon the ribbonunderGetStarted
and searchfor ‘dampingfactor’youwill see the followingguidelines.
4.21. We are workingwitha sour waterstripper,therefore the recommendeddampingfactorisbetween0.25
and 0.5. Inthe Solverformunderthe Parameters tab, entera FixedDampingFactor of 0.4. After
clickingRun,the columnshouldsolve.
Dist-017H Revised:November6,2012
10
4.22. Save thisfile before continuing.
4.23. If you lookat the Water streamleavingthe reboiler,youwill notice thatthisstreamcontains
superheatedwater. We can potentiallyuse the energyof this streamtoheatthe columnfeedstream,
thusloweringthe energyinputrequiredforthisprocess. Delete the heaterblock(E-100) and place a
Heat Exchanger block onto the flowsheet. Note thatyoucan rightclickon the Heat Exchanger block
and selectChange Iconto selecta differenticontodisplay.
Dist-017H Revised:November6,2012
11
4.24. Double clickonthe heat exchanger(E-100). SelectstreamSourWater as the Tube Side Inlet,
StripperFeedasthe Tube Side Outlet,Water as the Shell Side Inlet,andcreate a streamcalled Water-
Cool for the Shell Side Outlet.
4.25. In the Parameters formunderthe Designtab entera Pressure Drop of 0.6895 bar for boththe Shell and
Tube side. Alsochange the numberof Tube Passesto 1. The heatexchangershouldsolve.
Dist-017H Revised:November6,2012
12
4.26. We will nowperformacase studyto determine the optimalcolumnfeedtemperature. Inthe
NavigationPane clickthe Case Studiesfolderandselect Add. In Case Study 1, addthe StripperFeed
Temperature and the Heat Flows of energy streamsQ-Condand Q-Reb.
4.27. For the IndependentVariable (StripperFeedTemperature),entera Low Bound of 80°C, a High Bound of
115°C, and a Step Size of 2°C.
4.28. ClickRun to beginthe calculations. Toview resultsgotothe Resultsor the Plotstab.
Dist-017H Revised:November6,2012
13
4.29. From the case study,you can see thatat higherfeedtemperatureswe have alowerreboilerdutybuta
highercondenserduty. Since the costof steamisgenerallyhigherthanthe cost of coolingwater,we
shouldincrease the temperature of the columnfeedstreamto115°C.
5. Conclusions
In thislessonwe learnedhowtosimulateasourwaterstrippingprocess. We configuredadistillationcolumnas
well asa heat exchanger. Itwasdeterminedthroughthe use of a case studythat a highercolumnfeed
temperature willleadtolowerenergycostsforthisseparation.
6. Copyright
Copyright© 2012 by AspenTechnology,Inc.(“AspenTech”). All rightsreserved. Thisworkmaynotbe
reproducedordistributedinanyformor byany meanswithoutthe priorwrittenconsentof
AspenTech. ASPENTECHMAKESNOWARRANTYOR REPRESENTATION,EITHER EXPRESSEDOR IMPLIED, WITH
RESPECT TO THIS WORK and assumesnoliabilityforanyerrorsor omissions. Innoeventwill AspenTechbe
liable toyoufordamages,includinganylossof profits,lostsavings,orotherincidental orconsequential
damagesarisingoutof the use of the informationcontainedin,orthe digital filessuppliedwithorforuse with,
thiswork. This workand itscontentsare providedforeducational purposesonly.
AspenTech®,aspenONE®,andthe Aspenleaf logo,are trademarksof AspenTechnology,Inc.. Brandsand
productnamesmentionedinthisdocumentationare trademarksorservice marksof theirrespective companies.
Dist-018H Revised:December3,2012
1
Atmospheric Crude Tower with Aspen HYSYS® V8.0
1. Lesson Objectives
 Assignpetroleumassaytostream
 Configure columnpre-heater
 Configure crude tower
2. Prerequisites
 Aspen HYSYS V8.0
 Introductiontodistillation
3. Background
Oil refineriestake crude oil andseparate itintomore useful/valuable productssuchasnaphtha,diesel,
kerosene,andgasoil. Anatmosphericdistillationcolumnisone of the manyunitoperationsthatcan be found
inan oil refinery. Crude oil isfed intothe atmosphericdistillationcolumnandseveral fractionsare produced
whichare thenfedtootherprocessunitssuch as hydrotreaters,hydrocrackers,reformers,andvacuum
distillationcolumns. Inthislessonwe will be focusingsolelyonthe atmosphericcrude unit.
The examplespresentedare solelyintendedtoillustrate specificconceptsand principles. Theymay not
reflectan industrial application or real situation.
4. Problem Statement and Aspen HYSYS Solution
Problem Statement
In thissimulation we wishtosimulate anatmosphericcrude fractionator. 100,000 barrel/dayof ArabianLight
crude is fed to a furnace that will vaporize aportionof the crude. Thiscrude streamis thenfed to an
atmosphericcrude column. The columnwill operate with three coupledside strippers andthree pumparound
circuits.
Aspen HYSYS Solution
4.01. Create a newsimulationin AspenHYSYSV8.0.
4.02. Create a componentlist. Inthe ComponentList folder, selectAdd. AddWater,Methane,Ethane,
Propane,i-Butane,and n-Butane to the componentlist.
Dist-018H Revised:December3,2012
2
4.03. Addhypotheticalstothe componentlist. Inthe ComponentList – 1 form, change the Selectoptionto
Hypothetical. Enter an Initial BoilingPoint of 30°C, a Final BoilingPointof 900°C, and an Interval of
10°C. ClickGenerate Hyposto generate ahypothetical group.
Dist-018H Revised:December3,2012
3
4.04. Aftergeneratingthe hypothetical group,click AddAll to add all generatedhypotheticalstothe
componentlist.
4.05. Define propertypackage. Inthe FluidPackagesfolderselectAdd. SelectPeng-Robinsonasthe
propertypackage.
Dist-018H Revised:December3,2012
4
4.06. We will nowcharacterize ourcrude oil. Go to the PetroleumAssaysfolder. Click Add. Enter Arabian
Light for Name,selectSpecifiedforAssaySource,and selectBasis-1for FluidPackage.
4.07. In the Arabian Light form,selectImport From. A window will appear,select AssayLibrary.
4.08. The Assay Library windowwill appear. Since we wishtomodel the ArabianLightcrude,we will select
Middle East for RegionName,and Saudi Arabia for Country Name. We can thenselect Arabian Light
and click Import SelectedAssay.
Dist-018H Revised:December3,2012
5
4.09. Aftera fewmomentsthe distillationcutdatafor the ArabianLightcrude will populate the Assay
Property form.
Dist-018H Revised:December3,2012
6
4.10. Go to the Light Ends formto enterdata forthe lightcomponentstobe includedinthe crude. Enterthe
followingVolume %foreachcomponent. Checkthe box for Inputand entera Total Percentage of 1.4.
Thismeansthat the specifiedlightendswill comprise1.4percentof the total crude.
4.11. Move backto the Assay Property formand click Calculate Assay. Aftera few momentsthe statusbar
shouldturngreenandsay OK. You can go to the Resultstab to view atrue boilingpoint(TBP) curve,
composition data,andbulkpropertiesof the crude,amongotherresults.
Dist-018H Revised:December3,2012
7
4.12. We are now readyto move tothe simulationenvironmenttobegincreatingourflowsheet. Clickthe
Simulationbuttoninthe bottomleftof the screen.
4.13. In the Home ribbon,change the unitsto Fieldunits.
4.14. Adda material streamtothe flowsheet. Thiswill be ourcrude feedwhichwill be heatedbyafurnace
and thenfedtothe distillationcolumn.
Dist-018H Revised:December3,2012
8
4.15. Double clickthe material streamandrename it Raw Crude. Entera Temperature of 77°F, a Pressure of
58.02 psia (4 bar),and a Std Ideal Liq Vol Flowof 100,000 barrels/day.
4.16. We mustnowattach the petroleumassaytothisstream. Go to the PetroleumAssay formand select
PetroleumAssay From Library. Next,selectArabianLight. You will notice thatthe streamcompositions
will populate andthe streamwill solve.
Dist-018H Revised:December3,2012
9
4.17. If you go to the Compositionformyouwill see thatthe compositionforall hypothetical components
and lightendsare complete.
Dist-018H Revised:December3,2012
10
4.18. We will nowadda Heater blockto the flowsheet. Thiswill serve topre-heatthe crude streamand
prepare itto enterthe distillationcolumn.
Dist-018H Revised:December3,2012
11
4.19. Double clickthe heaterblock(E-100). SelectRaw Crude as the Inletstream, create an Outlet stream
calledColumnFeed,andcreate anEnergystream called Q-Heat.
Dist-018H Revised:December3,2012
12
4.20. In the Parameters form,entera Delta P of 7.252 psi (0.5 bar).
4.21. In the Worksheettabenteran outlet Temperature of 626°F. The heatershouldsolve.
Dist-018H Revised:December3,2012
13
4.22. Before addingthe columntothe flowsheet,we mustfirstdefine the steamandenergystreamsthatwill
be usedby the column. Add 3 Material Streams to the flowsheet. Name them MainSteam, Diesel
Steam, andAGO Steam.
Dist-018H Revised:December3,2012
14
4.23. Double clickoneach steamstreamand enterthe followinginformation. Entera Mole Fraction of 1 for
Water foreach streamas well.
Stream Name Vapor Fraction Pressure (psia) Mass Flow (lb/hr)
Main Steam 1 145 6614
Ago Steam 1 145 2205
Diesel Steam 1 145 2205
4.24. Addan Energy streamcalled Q-Trim. This streamdoesnotrequire anyspecifications;itwill be
calculatedbythe column.
Dist-018H Revised:December3,2012
15
4.25. Adda Blank ColumnSub-Flowsheetfromthe Model Palette.
4.26. A windowwill appear,select Readan ExistingColumn Template.
4.27. Selecttemplate 3sscrude.col andclick Open.
Dist-018H Revised:December3,2012
16
4.28. The columnpropertywindowwill appear. Onthe Design| Connections form, youcan view all the
internal streamswithinthe columnsub-flowsheet. The firstthingwe mustdois connectthe Internal
and External Streams as shownbelow. Alsoenteratopstage pressure of 14.5 psia anda bottom
pressure of 20.31 psia.
Dist-018H Revised:December3,2012
17
4.29. We mustnowmodifythe stage locationsforthe side strippersandpumparounds. Go to the Side Ops
tab. In the Side Strippersform selectthe following LiqDraw andVap Return Stages.
4.30. In the Pump Arounds formselectthe following Drawand Return Stages.
4.31. We mustnowdefine the columnoperatingspecifications. Goto the Specs formunderthe Design tab.
You will notice thatinorderto run thiscolumnyoumustdefine 13 specifications. The table below
summarizesthe designspecificationschosenforthiscolumn.
Specification Spec Value
Reflux Ratio 1
Condenser Temp 110°F
Kerosene D86 95% Temperature 520°F
Diesel D86 95% Temperature 665°F
AGO TBP 95% Temperature 885°F
Pump Around 1 Return Temp 175°F
Pump Around 2 Return Temp 310°F
Pump Around 3 Return Temp 450°F
Vapour Flow off condenser 0 kgmole/h
Kerosene SS Duty 3.966 MMBtu/hr
Pump Around 1 Draw Rate 15,100 barrel/day
Pump Around 2 Draw Rate 15,100 barrel/day
Pump Around 3 Draw Rate 15,100 barrel/day
4.32. In the Specsform itmay be easiesttoinitiallydelete all of the defaultspecificationsforthe column.
Dist-018H Revised:December3,2012
18
4.33. ClickAdd to addeach designspecificationone byone. The followingpageswillinclude ascreenshotof
each individual specificationwindow.
Reflux Ratio
Condenser Temperature
Dist-018H Revised:December3,2012
19
Kerosene D86 95% Temperature
The D86 95% stream property is found under the Petroleum branch after clicking Select Property.
Dist-018H Revised:December3,2012
20
Diesel D86 95% Temperature
AGO TBP 95% Temperature
The TBP 95% stream property is found under the Petroleum branch after clicking Select Property.
Dist-018H Revised:December3,2012
21
Pump Around 1 Return Temperature
Pump Around 2 Return Temperature
Dist-018H Revised:December3,2012
22
Pump Around 3 Return Temperature
Vapour Flow off condenser
Dist-018H Revised:December3,2012
23
Kerosene SS Duty
Pump Around 1 Draw Rate
Dist-018H Revised:December3,2012
24
Pump Around 2 Draw Rate
Pump Around 3 Draw Rate
4.34. Once all 13 specificationsare enteredyoushouldnoticethatthe DegreesofFreedomisnow 0. This
meansthat the columnisreadyto begincalculations.
Dist-018H Revised:December3,2012
25
4.35. Before we runthe column,we will entertopandbottomstage temperature estimatestohelpthe
columnto converge. Goto the Profilesformunderthe Parameterstab. Enter a Condenser
temperature of 110°F and a Stage 29 temperature of 630°F. The bottom stage temperature estimate
was chosenbecause we knowthe columnfeedstreamisbeingfedinto stage 29, therefore the stage 29
temperature shouldbe aroundthe same temperature.
Dist-018H Revised:December3,2012
26
4.36. Clickthe Run buttonand the columnwill begincalculations. Afterafew momentsthe columnshould
converge.
Dist-018H Revised:December3,2012
27
4.37. Checkresults. Go to the Summary form underthe Performance tab. Here youcan view the flowrates
and compositionsforeachproductstream. Note thatArabianLightis a lightcrude,therefore there isa
large flowrate forthe lightproductsinthe napthastream, and lowerflowratesforkerosene,diesel,and
gas oil.
Dist-018H Revised:December3,2012
28
5. Conclusions
In thislessonwe learnedhowto model apetroleumassayandassignastreamto an assay. We also learnedhow
to insertandconfigure anatmosphericcrude towertoproduce petroleumproducts. A lightcrude,suchas
ArabianLight,will produce ahighquantityof lightproductssuchas gasoline andnaptha,while aheaviercrude
will produce ahigherquantityof heavierproductssuchaskerosene,diesel,andfuel oil.
6. Copyright
Copyright© 2012 by AspenTechnology,Inc.(“AspenTech”). All rightsreserved. Thisworkmaynotbe
reproducedordistributedinanyformor byany meanswithoutthe priorwrittenconsentof
AspenTech. ASPENTECHMAKESNOWARRANTYOR REPRESENTATION,EITHER EXPRESSEDOR IMPLIED, WITH
RESPECT TO THIS WORK and assumesnoliabilityforanyerrorsor omissions. Innoeventwill AspenTechbe
liable toyoufordamages,includinganylossof profits,lostsavings,orotherincidental orconsequential
damagesarisingoutof the use of the informationcontainedin,orthe digital filessuppliedwithorforuse with,
thiswork. This workand itscontentsare providedforeducational purposesonly.
AspenTech®,aspenONE®,andthe Aspenleaf logo,are trademarksof AspenTechnology,Inc.. Brandsand
productnamesmentionedinthisdocumentationare trademarksorservice marksof theirrespective companies.
Dist-019H Revised:Nov8,2012
1
Propylene Glycol Production with Aspen HYSYS® V8.0
1. Lesson Objectives
 Use Aspen HYSYSto simulate the productionprocessforpropylene glycol
2. Prerequisites
 Aspen HYSYS V8.0
3. Background
Propylene glycol(C3H8O2)isaverycommonorganic compoundthatis usedinmanyapplications. Itisusedas an
oil dispersant,asolventinpharmaceuticals,anantifreeze,andasa moisturizer, andmanyotherapplications.It
isproducedviathe hydrolysisof propylene oxide whichisusuallyacceleratedbyacidorbase catalysis. Reaction
productstypicallycontainaround20% of propylene glycol, andthereforefurtherseparation(distillation) is
requiredinordertoyieldaproduct streamwith99.5% propyleneglycol.
The examplespresentedare solelyintendedtoillustrate specificconceptsand principles. Theymay not
reflectan industrial application or real situation.
4. Problem Statement and Aspen HYSYS Solution
Problem Statement
Simulate the propylene glycol productionprocess,includingthe reactionandseparationprocesses. Assume a
propylene oxide feedstreamof 3952 kg/hand a waterfeedstreamof 4990 kg/h. Our goal is to produce a final
productcontaining99.5% propylene glycol. Assume aCSTRreactor witha volume of 8,000 L. The simplified
reactionkineticsare shownbelow.
Dist-019H Revised:Nov8,2012
2
( ) ( )
Designa distillationcolumnthatiscapable of producinga productwith99.5% puritywhile recovering100%of
the product fedtothe column.
Aspen HYSYS Solution
4.01. Create a newsimulationin AspenHYSYSV8.0.
4.02. Create a componentlist. Inthe ComponentLists folderselectAdd. Addwater, propylene oxide,and
propylene glycol to the componentlist.
4.03. Define propertymethods. Inthe FluidPackagesfolderselectAdd. SelectUNIQUACasthe property
package.
4.04. Define reaction. Goto the ReactionsfolderandselectAddto create a new reactionset. In Set-1 click
Add Reaction and selectKinetictoadda new kineticreaction.
Dist-019H Revised:Nov8,2012
3
4.05. Double click Rxn-1to specifythe kineticreaction. Selectthe reactantsandproductcomponentsand
enterthe stoichiometriccoefficients(-1forwaterand propylene oxide,and1 for propylene glycol).
Change the Fwd Order forwater to 0. Select12C3Oxide for Base Componentand CombinedLiquidfor
Rxn Phase. Change the Basis Unitsto kgmole/m3 and the Rate Units to kgmole/m3-h. Enter1.7e+13
for A, and75362 kJ/kgmole (18012 kcal/kgmole)forE.
4.06. Close the reactiondefinitionwindow whencomplete. Clickthe AddtoFP buttonand select Basis-1to
attach the reactionsetto a fluidpackage.
Dist-019H Revised:Nov8,2012
4
4.07. Enter the simulationenvironmentby clickingthe Simulationbuttoninthe bottomleftof the screen.
4.08. Adda Material Stream to the flowsheet. Thisstreamwill be the propylene oxidefeedstream. Double
clickon the streamonce yousuccessfullyplace itontothe flowsheet.
4.09. Change the name of thisstreamto Prop Oxide. Entera Temperature of 25°C, a Pressure of 1 bar, and a
Mass Flow of 3952 kg/h. Inthe Compositionformentera Mole Fraction of 1 for propylene oxide.
Dist-019H Revised:Nov8,2012
5
4.10. Adda second Material Stream to the flowsheet. Thisstreamwill be the waterfeedstream. Change the
name of thisstreamto WaterFeed. Enter a Temperature of 25°C, a Pressure of 1 bar, and a Mass Flow
of 4990 kg/h. In the Compositionformentera Mole Fraction of 1 for water.
Dist-019H Revised:Nov8,2012
6
4.11. Adda Mixerto the flowsheetinordertomix the twofeedstreamstogether.
4.12. Double clickonthe mixer(MIX-100). Selectbothfeedstreamsas Inletstreamsand create an Outlet
calledMixerOut. The mixershouldsolve.
Dist-019H Revised:Nov8,2012
7
4.13. We will nowaddthe reactor to the flowsheet. Adda ContinuousStirredTank Reactor to the flowsheet
fromthe Model Palette.
4.14. Double clickthe reactor(CSTR-100). Selectstream MixerOutas the Inlet,create a Vapour Outletcalled
Reactor Vent,create a LiquidOutlet calledReactor Products,and create an Energy streamcalled Q-
Cool.
Dist-019H Revised:Nov8,2012
8
4.15. In the Parameters formentera reactor Volume of 8000 L anda LiquidVolume % of 85.
4.16. In the Reactions tab selectSet-1asthe Reaction Set.
Dist-019H Revised:Nov8,2012
9
4.17. Since we addedan energystreamtothe reactor, we musteitherspecifythe dutyorthe outlet
temperature. Inthe Worksheettabenteranoutlet Temperature of 60°C. The reactor shouldsolve.
Dist-019H Revised:Nov8,2012
10
4.18. Adda DistillationColumnSub-Flowsheetfromthe Model Palette.
4.19. Double clickonthe column(T-100). This will launchthe DistillationColumnInputExpert. On the first
page of the inputexpertenterthe followinginformation. Enter 10 for # Stages, selectReactor Products
as the Inlet Stream onStage 5, create CondenserEnergyStream calledQ-Cond,an Ovhd LiquidOutlet
streamRecycle,and a Bottoms Liquid OutletcalledProduct. Click Nextwhencomplete.
Dist-019H Revised:Nov8,2012
11
4.20. On Page 2 of the inputexpertleave the defaultselectionsfora Once-through,Regular Hysys reboiler.
ClickNext.
4.21. On Page 3 of the inputexpertenterCondenserandReboilerPressures of 1 bar. Click Next.
Dist-019H Revised:Nov8,2012
12
4.22. On Page 4 of the inputexpertleave all fieldsblankfortemperature estimates. Click Next. OnPage 5
leave all fieldsblankandclick Done to configure the column.
4.23. The columnpropertywindowwill open. We mustdefine the desiredoperatingspecificationsof the
column. Go to the Specs formunderthe Design tab. We will firstadda specificationtohave a mole
fraction of 0.995 of propylene glycol inthe productstream. Click AddandselectColumnComponent
Fraction. SelectStreamfor Target Type,Product for Draw, 12-C3diol for Component,andentera Spec
Value of 0.995.
4.24. Go to the SpecsSummary form underthe Designtab. Enter a value of 1 forRefluxRatio. Make sure
that the onlyactive specificationsare CompFraction andRefluxRatio. Once these are checkedas
active the columnwill begintosolve.
Dist-019H Revised:Nov8,2012
13
4.25. Checkresults. Go to the Compositionformunderthe Worksheettab. Here you will see thatthe
productpurityspecificationhasbeenreached,andyoucan alsosee thatthe distillate streamcontains
no propylene glycol.
Dist-019H Revised:Nov8,2012
14
5. Conclusions
Thissimulationmodelsthe productionof propylene glycol. A continuousstirredtankreactorwasusedto create
a product streamcontainingroughly20%propylene glycol,andthenadistillationcolumnwasdesignedinorder
to produce a product streamwitha purityof 99.5% propylene glycol. The columnalsorecoversall of the
propylene glycolfedtothe column.
6. Copyright
Copyright© 2012 by AspenTechnology,Inc.(“AspenTech”).All rightsreserved. Thisworkmaynot be
reproducedordistributedinanyformor byany meanswithoutthe priorwrittenconsentof
AspenTech. ASPENTECHMAKESNOWARRANTYOR REPRESENTATION,EITHER EXPRESSEDOR IMPLIED, WITH
RESPECT TO THIS WORK and assumesnoliabilityforanyerrorsor omissions. Innoeventwill AspenTechbe
liable toyoufordamages,includinganylossof profits,lostsavings,orotherincidental orconsequential
damagesarisingoutof the use of the informationcontainedin,orthe digital filessuppliedwithorforuse with,
thiswork. This workand itscontentsare providedforeducational purposesonly.
AspenTech®,aspenONE®,andthe Aspenleaf logo,are trademarksof AspenTechnology,Inc.. Brandsand
productnamesmentionedinthisdocumentationare trademarksorservice marksof theirrespective companies.
Dist-020H Revised:Nov9,2012
1
Amine Scrubbing with Aspen HYSYS® V8.0
1. Lesson Objectives
 Use Aspen HYSYSto simulate aCO2 absorbercolumn
2. Prerequisites
 Aspen HYSYS V8.0
3. Background
In recenttimesthere hasbeenmuchinterestinthe recoveryof carbondioxidefromflue gasses. Recovering
carbon dioxide will leadtolowergreenhousegasemissions,andthe capturedcarbondioxide canbe soldfor
profit. Carbondioxide capture isalso gaininginterestfromenhancedoil capture processeswhere CO2 is
injectedundergroundintooil wells,whichreducesthe viscosityandsurface tensionof the oil andleads to
higheroil recoveryrates. Gas-liquidabsorption,alsoknownasgasstreamscrubbing, can be usedto remove
CO2 from a flue gasstreamusingMEA (monoethanolamine) asasolvent. MEA acts as a weakbase and
neutralizesacidiccompoundssuchasCO2. Thiswill cause CO2 to ionize intoHCO3
-
whichwill preventCO2 from
leavingthe solvent,resultinginagas stream largely free of carbondioxide.
The examplespresentedare solelyintendedtoillustrate specificconceptsand principles. Theymay not
reflectan industrial application or real situation.
Dist-020H Revised:Nov9,2012
2
4. Problem Statement and Aspen HYSYS Solution
Problem Statement
It isknownthat amine solventshave atheoretical loadingof 0.5 molesof CO2 for everymole of amine.
Calculate the amountof MEA requiredtosuccessfullyremove the CO2 fromaflue gasstream containing10
mol%carbondioxide withatotal flowrate of 1,000 tons/day. Use AspenHYSYS to simulate thisprocessand
confirmthe results. Assume anaqueoussolventstreamwithamassfractionof 0.25 MEA and a 20 stage
absorbercolumn.
Aspen HYSYS Solution
4.01. Create a newsimulationinAspenHYSYSV8.0.
4.02. Create a componentlist. Inthe ComponentLists folderselectAdd. Addwater, carbon dioxide,
nitrogen, monoethanolamine,andoxygentothe componentlist.
4.03. Define propertymethods. Inthe FluidPackagesfolderselectAdd. Selectthe Amine Pkgas the
propertypackage.
Dist-020H Revised:Nov9,2012
3
4.04. Go to the simulationenvironmentbyclickingthe Simulationbuttoninthe bottomleftof the screen.
4.05. Adda material streamtothe flowsheet. Thiswill be the fluegasstream. Double clickthe streamand
rename itFlue Gas. Entera Temperature of 65°C, a Pressure of 1.2 bar, and a Mass Flow of 1000
tonne/day (4.167E+004 kg/h). Inthe CompositionformenterMole Fractionsof 0.10 for CO2, 0.70 for
Nitrogen, 0.15 for Water,and 0.05 for Oxygen. The streamshouldsolve.
4.06. By lookingatthe Flue Gas stream, we can see that itcontains~150 kgmole/hof carbondioxide. This
meansthat we wouldneedaminimumof ~300 kgmole/hof MEA to remove all of the carbon dioxide. In
our simulationwe will create afeedwithslightlymore MEA thanthe calculatedminimumtoensure
Dist-020H Revised:Nov9,2012
4
successful removal of carbondioxide. Since oursolventfeedhasaMEA mass fractionof 0.25 thismeans
that our solventstreamwill needatotal massflow of approximately 80,000 kg/h.
4.07. Adda secondmaterial streamtothe flowsheet. Thiswillbe the solventstream. Double clickthe stream
and rename itSolvent. Entera Temperature of 25°C, a Pressure of 1 bar, and a Mass Flow of 80,000
kg/h. Inthe CompositionformenterMass Fractions of 0.25 for MEA and 0.75 forwater.The stream
shouldsolve.
4.08. Addan Absorber ColumnSub-Flowsheetfromthe Model Palette.
Dist-020H Revised:Nov9,2012
5
4.09. Double clickthe column(T-100). Thiswill openthe AbsorberColumnInput Expert. On the firstpage of
the inputexpertselectstream Solventasthe Top Stage Inletand streamFlue Gas as the Bottom Stage
Inlet. Create an Ovhd Vapour OutletcalledCleanAir and a Bottoms Liquid OutletcalledSolution.
Enter 20 for# Stages. ClickNextwhencomplete.
Dist-020H Revised:Nov9,2012
6
4.10. On the secondpage of the inputexpertenter aTop Stage Pressure of 1 bar anda Bottom Stage
Pressure of 1.2 bar. ClickNextwhencomplete.
4.11. On the final page of the inputexpertenter Topand Bottom Stage Temperature estimatesof 50°C. This
estimate doesnothave tobe extremelyaccurate,butwill helpthe solverconverge onasolution. Click
Done to configure the column.
Dist-020H Revised:Nov9,2012
7
4.12. The columnpropertywindowwill now appear. Click Runto begincalculations. The absorbercolumn
shouldconverge.
Dist-020H Revised:Nov9,2012
8
4.13. Checkresults. Double clickonstream CleanAir. Go to the Compositionformunderthe Worksheettab.
You will see thatthere isessentiallynocarbondioxide remaininginthe stream.
5. Conclusions
Thissimulation hasconfirmedthe calculatedamountof MEA that is requiredtoremove carbondioxide fromthe
flue gasstream. It was foundthata solventflow of 80,000 kg/hissufficienttoremove the carbondioxide from
a 1000 tonne/dayflue gasstream. The cleanair streamcan now be releasedtothe atmosphere andthe
capturedcarbon dioxide canbe removedfromthe solventandsoldorusedfor variousapplications.
6. Copyright
Copyright© 2012 by AspenTechnology,Inc.(“AspenTech”).All rightsreserved. Thisworkmaynot be
reproducedordistributedinanyformor byany meanswithoutthe priorwrittenconsentof
AspenTech. ASPENTECHMAKESNOWARRANTYOR REPRESENTATION,EITHER EXPRESSEDOR IMPLIED, WITH
RESPECT TO THIS WORK and assumesnoliabilityforanyerrorsor omissions. Innoeventwill AspenTechbe
liable toyoufordamages,includinganylossof profits,lostsavings,orotherincidental or consequential
Dist-020H Revised:Nov9,2012
9
damagesarisingoutof the use of the informationcontainedin,orthe digital filessuppliedwithorforuse with,
thiswork. This workand itscontentsare providedforeducational purposesonly.
AspenTech®,aspenONE®,andthe Aspenleaf logo,are trademarksof AspenTechnology,Inc.. Brandsand
productnamesmentionedinthisdocumentationare trademarksorservice marksof theirrespective companies.
Chemical Reaction Engineering
RX-003H Revised:Nov 6,2012
1
Isomerization in a CSTR with Aspen HYSYS® V8.0
1. Lesson Objectives
 Use componentmassbalancestocalculate the time requiredtoreacha desiredconversionina
continuousstirredtankreactor.
 Use Aspen HYSYSto confirmthe analytical solution
2. Prerequisites
 Aspen HYSYS V8.0
 Basic knowledgeof reactionrate laws andmassbalances
3. Background
2-Butene isa fourcarbon alkene thatexistsastwogeometricisomers: cis-2-buteneand trans-2-butene.The
irreversible liquidphase isomerizationreactionwith1st
orderreactionkineticsisshownbelow.Itisdesiredto
determine the residence time requiredtoreach90% reactionconversioninacontinuousstirredtankreactor.
Assume steadystate.
Homogeneousreaction
1st
orderreactionkinetics
The examplespresentedare solelyintendedtoillustrate specificconceptsand principles. Theymay not
reflectan industrial application or real situation.
RX-003H Revised:Nov 6,2012
2
4. Solution
Analytic Solution:
Component A Mole Balance
Conversion (Χ)
Residence Time (τ)
∴
Aspen HYSYS Solution:
4.01. Start AspenHYSYS V8.0. SelectNewtocreate a new simulation.
4.02. Beginby creatinga ComponentList. In the propertiesnavigationpane,goto ComponentLists and
selectAdd. Change the Search by criteriato Formula and searchfor C4H8. Selectcis2-Butene andtr2-
Butene and add themto the componentlist.
RX-003H Revised:Nov 6,2012
3
4.03. Adda FluidPackage. Goto FluidPackages in the navigationpane andselect Add.SelectNRTLas the
propertypackage.
RX-003H Revised:Nov 6,2012
4
4.04. Define reaction. Goto Reactionsin the navigationpane andclick Addto add a new reactionset. In
Reaction Set 1, clickAdd Reaction and selectaHYSYS,Kineticreaction.
4.05. Double clickon Rxn-1 to define kineticreaction. Inthe KineticReaction: Rxn-1 window, Addcis2-
Butene and tr2-Butene to the componentcolumn,andassign StoichCoeffsof -1 and1, respectively. In
the Forward Reactionsection,setA to be .23000 and both E and B to 0.00000. Make sure that the Base
Unitsand Rate Units are lbmole/ft3 andlbmole/ft3-min,respectively.
RX-003H Revised:Nov 6,2012
5
4.06. Attach the reactiontoa fluidpackage. Inthe Set-1 (ReactionSet) form, click Add to FP andselectBasis-
1.
4.07. Move to the simulationenvironment byclickingthe Simulationbuttononthe bottomleftof the screen.
RX-003H Revised:Nov 6,2012
6
4.08. Press F-12 to openthe UnitOpswindow. Selectthe Reactorsradiobuttonand add a Cont. Stirred Tank
Reactor to the flowsheet.
4.09. Upon clickingAdd,the Cont. StirredTank Reactor: CSTR-100 window will appear. Enteran Inletstream
calledFeed,aVapour Outletstream called VAP-Product,anda LiquidOutletstreamcalled LIQ-Product.
RX-003H Revised:Nov 6,2012
7
4.10. Go to the Reactionstab and selectSet-1forReaction Set.
RX-003H Revised:Nov 6,2012
8
4.11. Specify the feedstream. Goto the Worksheettab. For the Feedstreamentera Temperature of 25°C, a
Pressure of 10 bar (1000 kPa),anda Molar Flowof 1 kgmole/h.
4.12. Go to the Compositionformandentera Mole Fraction of 1 forcis2-Butene.
RX-003H Revised:Nov 6,2012
9
4.13. In the Design| Parameters form,entera volume of 0.005 m3
andspecifyaLiquid Volume of 100%. This
isjust a randomvolume,we will soonaddanadjustblockto determinethe volume requiredtoachieve
90% reactionconversion.
4.14. Addan Adjust blockto the flowsheetfromthe Model Palette.
RX-003H Revised:Nov 6,2012
10
4.15. Double clickthe adjustblock(ADJ-1). We wouldlike adjustthe reactorvolume inordertoachieve a
reactionconversionof 90%. Forthe AdjustedVariable selectthe Tank Volume of CSTR-100. For the
Targeted Variable selectAct.% Cvn. of CSTR-100. Enter a SpecifiedTargetValue of 90.
4.16. In the Parameters tab,change the MaximumIterations to 1000. Press Start to begincalculations. The
blockshouldsolve.
RX-003H Revised:Nov 6,2012
11
4.17. Create a spreadsheettocalculate the residence time. Adda Spreadsheettothe flowsheetfromthe
Model Palette.
4.18. Double clickthe spreadsheet(SPRDSHT-1). Inthe Spreadsheettab,enterthe followingtextincells A1,
A2, and A3.
RX-003H Revised:Nov 6,2012
12
4.19. Rightclickon cell B1 andselectImport Variable. Selectthe Tank Volume of CSTR-100. Rightclickon
cell B2 andselectImport Variable. Selectthe Actual Volume Flow of streamLIQ-Product.
4.20. In cell B3 enterthe followingformula: =(B1/B2)*60. Thiswill displaythe residence time inminutes.
4.21. The residence time is 39.13 minutes,identicaltothe analytical solution.
5. Conclusion
Both the analytical solutionanddesignspecinAspen HYSYSproducedthe same requiredresidence time of
39.13 min. to achieve 90%reactionconversioninaCSTR. The residence time foraCSTR islongerthan fora
RX-003H Revised:Nov 6,2012
13
batch reactor or PFRbecause of the back-mixing:productismixedinwiththe feed,slowingthe reaction. Using
reactor modelsinAspenHYSYS will allow youto model complex reactionsystemsincludingparallel andseries
reactionswhichleadtocoupledsystemsof ODEswhichwouldbe difficulttocalculate byhand.
6. Copyright
Copyright© 2012 by AspenTechnology,Inc.(“AspenTech”).All rightsreserved. Thisworkmaynot be
reproducedordistributedinanyformor byany meanswithoutthe priorwrittenconsentof
AspenTech. ASPENTECHMAKESNOWARRANTYOR REPRESENTATION,EITHER EXPRESSEDOR IMPLIED, WITH
RESPECT TO THIS WORK and assumesnoliabilityforanyerrorsor omissions. Innoeventwill AspenTechbe
liable toyoufordamages,includinganylossof profits,lostsavings,orotherincidental orconsequential
damagesarisingoutof the use of the informationcontainedin,orthe digital filessuppliedwithorforuse with,
thiswork. This workand itscontentsare providedforeducational purposesonly.
AspenTech®,aspenONE®,andthe Aspenleaf logo,are trademarksof AspenTechnology,Inc.. Brandsand
productnamesmentionedinthisdocumentationare trademarksorservice marksof theirrespective companies.
RX-004H Revised:Nov6,2012
1
Isomerization in CSTRs in Series with Aspen HYSYS® V8.0
1. Lesson Objectives
 Use componentmassbalancestocalculate the reactionconversionachievedwithtwocontinuous
stirredtankreactors inseries.
 Use Aspen HYSYSto confirmthe analytical solution
2. Prerequisites
 Aspen HYSYS V8.0
 Basic knowledgeof reactionrate lawsandmassbalances
3. Background
2-Butene isa fourcarbon alkene thatexistsastwogeometricisomers: cis-2-buteneand trans-2-butene.The
irreversible liquidphase isomerizationreactionwith1st
orderreactionkineticsisshownbelow.
Homogeneousreaction
1st
orderreactionkinetics
The examplespresentedare solelyintendedtoillustrate specificconceptsand principles. Theymay not
reflectan industrial application or real situation.
4. Problem Statement and Solutions
Problem #1
Determine the conversionachievedif twoCSTRsare usedinseries.EachCSTR has a residence time of 20min.
Assume steadystate.
RX-004H Revised:Nov6,2012
2
Analytic Solution:
First Reactor Component A Balance
Second Reactor Component A Balance
Conversion
( )
Aspen HYSYS Solution:
4.01. Start AspenHYSYS V8.0. Create a new simulation.
4.02. Create a componentlist. Inthe ComponentLists folderselectAdd.Change the Search by criteriato
Formula and searchfor C4H8. Selectcis2-Butene andtr2-Butene and addthemto the componentlist.
RX-004H Revised:Nov6,2012
3
4.03. Define propertypackage. Inthe FluidPackagesfolderselectAdd. SelectNRTLas the propertypackage.
4.04. Define reaction. Inthe ReactionsfolderselectAddtocreate a new reactionset. In the newlycreated
reactionsetselect AddReaction and selectKinetic.Close the Reactionswindow.
RX-004H Revised:Nov6,2012
4
4.05. Rxn-1 will be created. Double clickon Rxn-1to define the kineticreaction. Addcis2-Buteneandtr2-
Butene to the componentcolumn,andassign StoichCoeffsof -1 and1, respectively.Inthe Forward
Reaction section,setAto be .23000 and bothE and B to 0.00000. Make sure that the Base Units and
Rate Units are lbmole/ft3and lbmole/ft3-min,respectively.
4.06. Attach reactiontoa fluidpackage. Click Addto FP andselectBasis-1.
4.07. Go to the simulationenvironment. Selectthe Simulationbuttoninthe bottomleftof the screen.
RX-004H Revised:Nov6,2012
5
4.08. Addtwo CSTR blockstothe flowsheet. PressF12 to openthe UnitOpswindow. Selectthe Reactors
radiobuttonand add 2 Cont.Stirred Tank Reactors to the flowsheet.
RX-004H Revised:Nov6,2012
6
4.09. Double clickonthe firstreactor (CSTR-100). Create an Inletstreamcalled Feed,aVapour Outletcalled
Vap1, and a Liquid OutletcalledLiq1.
4.10. In the Reactions tab selectSet-1forReaction Set.
RX-004H Revised:Nov6,2012
7
4.11. Specify the feedstream. Goto the Worksheettaband entera Temperature of 25°C, a Pressure of 10
bar, and a Molar Flowof 1 kgmole/h.
4.12. In the Compositionformunderthe Worksheettab,entera Mole Fraction of 1 for cis-2-butene inthe
feedstream.
RX-004H Revised:Nov6,2012
8
4.13. In the Design| Parameters form,entera Volume of 0.005 m3
and a Liquid Volume % of 100%. We will
sooncreate an Adjustblockand a Spreadsheettofindthe volumerequiredforthe desiredresidence
time of 20 minutes.
4.14. Adda Spreadsheettothe flowsheetfromthe Model Palette.
RX-004H Revised:Nov6,2012
9
4.15. Double clickthe spreadsheet(SPRDSHT-1). Inthe Spreadsheettab enterthe followingtextincells A1,
A2, and A3.
RX-004H Revised:Nov6,2012
10
4.16. Rightclickon cell B1 andselectImport Variable. Selectthe Tank Volume of CSTR-100. Rightclickon
cell B2 andselectImport Variable. Selectthe Actual Volume Flow of streamLiq1. Clickoncell B3 and
enterthe following: =(B1/B2)*60. This will displaythe residence timeinminutesof CSTR-100.
4.17. We will nowcreate anadjustblockto vary the tank volume of CSTR-100 to achieve aresidence time of
20 minutes. Addan Adjust blockto the flowsheetfromthe Model Palette.
RX-004H Revised:Nov6,2012
11
4.18. Double click onthe adjustblock(ADJ-1). Specifythe AdjustedVariable tobe the Tank Volume of CSTR-
100. Specifythe TargetVariable to be cell B3 of SPRDSHT-1. Entera Target Value of 20.
RX-004H Revised:Nov6,2012
12
4.19. In the Parameters tab,change the MaximumIterations to 1000. Click Start to begincalculations. The
blockshouldsolve.
4.20. The firstCSTR is nowfullyspecifiedandhasresidence time of 20minutes. Note thatthe vapor outlet
streamhas a flowrate of zero.
RX-004H Revised:Nov6,2012
13
4.21. Double clickthe secondreactor(CSTR-101). SelectLiq1 as the Inletstream andcreate Outlet streams
calledVap2 and Liq2.
RX-004H Revised:Nov6,2012
14
4.22. In the Reactions tab selectSet-1asthe Reaction Set.
RX-004H Revised:Nov6,2012
15
4.23. Repeatsteps4.13 to 4.20 for the secondreactor. Whenfinishedthe secondreactorshouldsolveand
have a residence time of 20 minutes.
4.24. Checkthe resultsof streamLiq2. Double clickstream Liq2 and go to the Compositionformunderthe
Worksheettab.
RX-004H Revised:Nov6,2012
16
4.25. You can see that the mole fractionof trans-2-butene inthe outletstreamis 0.9681. You can add the
reactionextentsof eachreactiontoachieve the total reactionconversion. Tofindthe reactionextent,
double clickareactor and go to the Reactions | Resultspage. In thiscase the reactionextentof the first
CSTR is0.8214 and 0.1467 for the secondCSTR. Thistotalsto 0.9681, identical tothe analyticsolution.
RX-004H Revised:Nov6,2012
17
Problem #2
Considerthe same 1st
orderreaction, exceptthistime usingtwo CSTRsof differentsizes.Calculatethe
conversionachievedif the firstreactorhasa residence time of 30 min and the secondreactorhas a residence
time of 10 min.Assume steadystate.
Analytic Solution:
First Reactor Component A Balance
Second Reactor Component A Balance
Conversion
( )( )
Aspen HYSYS Solution:
4.26. The same procedure describedinthe case of two equal volume CSTRsinseriesshouldbe followed.The
onlydifference beingthe firstCSTRhasa residence timeof 30 min and the secondCSTR hasa residence
time of 10 min.
RX-004H Revised:Nov6,2012
18
4.27. Openthe file youcreatedforthe previousproblem. Inthe Adjustblockschange the Target Value to 30
for the firstreactor and 10 forthe secondreactor.
RX-004H Revised:Nov6,2012
19
4.28. Checkresults. Addupthe reactionextentforbothreactors. The firstreactor hasa reactionextentof
0.8734, and the secondreactor hasan extentof 0.08822. Thistotalsto 0.9616, whichisidentical tothe
analyticsolution.
5. Conclusion
The conversionisslightlyhigherwhenthe residence timesare the same. Whenbothare 20 min.,the conversion
is96.81%, and it isonly 96.16% whentheyare 30 and10 min.respectively. Thisisaresultof the decreasing
dependence of conversiononresidence time:the secondderivativeof conversionwithrespecttoresidence
time isnegative.
Total residence timeisnotsufficienttodescribe aseriessystemof CSTRs. Multiple CSTRsinseriesyieldhigher
conversionthana single CSTRthathas a residence time equaltothe sumof the seriesarrangement.
6. Copyright
Copyright© 2012 by AspenTechnology,Inc.(“AspenTech”).All rightsreserved. Thisworkmaynot be
reproducedordistributedinanyformor byany meanswithoutthe priorwrittenconsentof
AspenTech. ASPENTECHMAKESNOWARRANTYOR REPRESENTATION,EITHER EXPRESSEDOR IMPLIED, WITH
RESPECT TO THIS WORK and assumesnoliabilityforanyerrorsor omissions. Innoeventwill AspenTechbe
liable toyoufordamages,includinganylossof profits,lostsavings,orotherincidental orconsequential
damagesarisingoutof the use of the informationcontainedin,orthe digital filessuppliedwithorforuse with,
thiswork. This workand itscontentsare providedforeducational purposesonly.
AspenTech®,aspenONE®,andthe Aspenleaf logo,are trademarksof AspenTechnology,Inc.. Brandsand
productnamesmentionedinthisdocumentationare trademarksorservice marksof theirrespective companies.
RX-005H Revised:Oct15, 2012
1
Esterification in CSTRs in Series with Aspen HYSYS® V8.0
1. Lesson Objectives
 Use Aspen HYSYSto determine whetheragivenreactionistechnicallyfeasibleusingthree
continuousstirredtankreactorsinseries.
2. Prerequisites
 Aspen HYSYS V8.0
 Basic knowledgeof reactionrate laws
3. Background
Considerthe reversibleliquidphase esterificationof aceticacidshownbelow.
The examplespresentedare solelyintendedtoillustrate specificconceptsand principles. Theymay not
reflectan industrial application or real situation.
RX-005H Revised:Oct15, 2012
2
4. Problem Statement and Aspen HYSYS Solution
It isdesiredtoproduce 375 kg/h of ethyl acetate productfroma feedstreamconsistingof 13 mole % acetic acid,
35 mole %ethanol,and52 mole %water.This feedstreamisavailableat100,000 kg/day.Three 2,600 L CSTRs
are available touse forthisprocess.Determineif itispossibletoachieve the desiredproductionrate of ethyl
acetate by operatingthese three reactorsinseries.
4.01. Start AspenHYSYS V8.0. Create a new simulation.
4.02. Create a componentlist. Inthe ComponentLists folderselectAdd. AddAcetic-Acid,Ethanol,Ethyl-
Acetate,and Water tothe componentlist.
4.03. Define propertypackage. Inthe FluidPackagesfolderselectAdd.SelectNRTLas the propertypackage.
4.04. Define reaction. Inthe ReactionsfolderselectAddtocreate a new reactionset. In Set-1 selectAdd
Reaction and selectKinetic.
RX-005H Revised:Oct15, 2012
3
4.05. Double click Rxn-1to define the kineticreaction. Enterthe followinginformationandclose the window
whencomplete. Be sure to specifythe RxnPhase as AqueousPhase.
4.06. Attach reactiontofluidpackage. Click Addto FP and selectBasis-1.
RX-005H Revised:Oct15, 2012
4
4.07. Go to the simulationenvironmentbyclickingthe Simulationbuttoninthe bottomleftcornerof the
screen.
4.08. Place three CSTRblocksonto the flowsheet. Press F12to openthe UnitOpswindow. Selectthe
Reactors radio buttonandadd three ContinuousStirredTank Reactors to the flowsheet.
RX-005H Revised:Oct15, 2012
5
4.09. Double clickonthe firstreactor (CSTR-100). Create an Inletstreamcalled FeedandOutletstreams
calledVap1 and Liq1.
RX-005H Revised:Oct15, 2012
6
4.10. In the Parameters formunderthe Designtab entera Volume of 2.6 m3
(2600L), and entera Liquid
Volume % of 100%.
RX-005H Revised:Oct15, 2012
7
4.11. In the Reactions tab selectSet-1forReaction Set.
4.12. In the Worksheettab,for the Feedstream, enteraTemperature of 25°C, a Pressure of 1 bar, anda
Mass Flow of 100,000 kg/day.
RX-005H Revised:Oct15, 2012
8
4.13. In the CompositionformenterMole Fractions of 0.13 forAcetic Acid, 0.35 for Ethanol,0 for Ethyl
Acetate,and 0.52 forwater. Whencomplete,the reactorshouldsolve. Youshouldnote thatthe vapor
outlethasa mass flowof zerobecause the entire contentsof the reactorare liquid.
4.14. Double clickthe secondreactor(CSTR-101). SelectLiq1 as the Inletstream. Create Outletstreams
calledVap2 and Liq2.
RX-005H Revised:Oct15, 2012
9
4.15. In the Parameters tab entera Volume of 2.6 m3
and a LiquidVolume % of 100%.
4.16. In the Reactions tab,selectSet-1as the Reaction Set. The reactor shouldsolve.
RX-005H Revised:Oct15, 2012
10
4.17. Double clickthe thirdreactor(CSTR-102). SelectLiq2as the Inletstream, andcreate Outletscalled
Vap3 andLiq3.
4.18. In the Parameters formentera Volume of 2.6 m3
and a Liquid Volume % of 100%.
RX-005H Revised:Oct15, 2012
11
4.19. In the Reactions tab selectSet-1asthe Reaction Set. The reactorshouldsolve.
4.20. The flowsheetisnowcomplete.
4.21. To check resultsrightclickonstream Liq3 andselectShowTable. A table will appearonthe flowsheet
showingTemperature,Pressure,andMolarFlow. Double clickonthe table andselect AddVariable.
RX-005H Revised:Oct15, 2012
12
4.22. Selectthe MasterComp Mass Flow andselectE-Acetate. Click OK. The componentmassflowof ethyl
acetate will be addedtothe table.
4.23. The mass flowof ethyl acetate inthe final liquidstreamis 672.55 kg/h, whichisgreaterthan the desired
flowrate specifiedinthe problemstatement. Thisshowsthatthisreactor setupiscapable of producing
the desiredrate of product.
RX-005H Revised:Oct15, 2012
13
5. Conclusion
The CSTRs can be usedinseriestomake the target amountof product.Aspen HYSYS can be usedtomodel
existingequipmentinadditiontodesigningnew equipment. Modelingexistingequipmentletsengineersdecide
if theycan repurpose equipmentandimproveperformance bychangingstate variables.
6. Copyright
Copyright© 2012 by AspenTechnology,Inc.(“AspenTech”).All rightsreserved. Thisworkmaynot be
reproducedordistributedinanyformor byany meanswithoutthe priorwrittenconsentof
AspenTech. ASPENTECHMAKESNOWARRANTYOR REPRESENTATION,EITHER EXPRESSEDOR IMPLIED, WITH
RESPECT TO THIS WORK and assumesnoliabilityforanyerrorsor omissions. Innoeventwill AspenTechbe
liable toyoufordamages,includinganylossof profits,lostsavings,orotherincidental orconsequential
damagesarisingoutof the use of the informationcontainedin,orthe digital filessuppliedwithorforuse with,
thiswork. This workand itscontentsare providedforeducational purposesonly.
AspenTech®,aspenONE®,andthe Aspenleaf logo,are trademarksof AspenTechnology,Inc.. Brandsand
productnamesmentionedinthisdocumentationare trademarksorservice marksof theirrespective companies.
RX-006H Revised:Nov6,2012
1
Isomerization in a PFR with Aspen HYSYS® V8.0
1. Lesson Objectives
 Use chemical reactionkineticstocalculate the reactorlength requiredtoreacha desiredconversion
ina plugflowreactor
2. Prerequisites
 Aspen HYSYS V8.0
 Basic knowledgeof reactionrate lawsandplugflow reactors
3. Background/Problem
2-Butene isa fourcarbon alkene thatexistsastwogeometricisomers: cis-2-buteneand trans-2-butene.The
irreversible isomerizationreactionwith1st
orderreactionkineticsisshownbelow.
Homogeneousreaction
1st
orderreactionkinetics
The examplespresentedare solelyintendedtoillustrate specificconceptsand principles. Theymay not
reflectan industrial application or real situation.
4. Problem Statement and Aspen HYSYS Solution
Calculate the reactorlengthrequiredtoachieve 90% reactorconversion.Assumesteadystate operation, a
single tube reactorwitha diameterof 2 inches,anda feedstreamof 100% cis-2-butune withaflow rate 1
kgmole/hat10 bar and 25°C.
Aspen HYSYS Solution:
4.01. Start AspenHYSYS V8.0. Create a new simulation.
4.02. Create a componentlist. Inthe ComponentLists folderselectAdd. Change the Search by criteriato
Formula and searchfor C4H8. Selectcis2-Butene andtr2-Butene and addthemto the componentlist.
RX-006H Revised:Nov6,2012
2
4.03. Define propertypackage. Inthe FluidPackagesfolderselectAdd. SelectNRTLas the propertypackage.
4.04. Define reaction. Inthe ReactionsfolderselectAddtocreate a new reactionset. In Set-1 selectAdd
Reaction and click Kinetic.
4.05. Double click Rxn-1to define the kineticreaction. Addcis2-Butene andtr2-Butene tothe component
column,andassign Stoich Coeffsof -1 and 1, respectively. Inthe Forward Reactionsection,setA to be
.23000 and both E and B to 0.00000. Make sure that the Base Unitsand Rate Units are lbmole/ft3and
lbmole/ft3-min,respectively.
RX-006H Revised:Nov6,2012
3
4.06. Attach reactiontofluidpackage. Clickthe Addto PFbutton andselect Basis-1.
4.07. Go to the simulationenvironmentbyclickingthe Simulationbuttoninthe bottomleftof the screen.
RX-006H Revised:Nov6,2012
4
4.08. Adda plugflowreactorto the flowsheet. Press F12to openthe UnitOpswindow. Selectthe Reactors
radiobuttonand add a Plug FlowReactor to the flowsheet.
4.09. Double clickthe reactor(PFR-100). Create an Inletstreamcalled Feedandan Outletstream called
Product.
RX-006H Revised:Nov6,2012
5
4.10. In the Reactions tab selectSet-1forReaction Set.
RX-006H Revised:Nov6,2012
6
4.11. In the Rating tab entera Length of 1 m anda Diameterof 2 in (5.080e-002 m). Thistube lengthisan
initial guess;anadjustblockwill be usedtodetermine the lengthrequiredtoreachthe desiredreactor
conversion.
4.12. In the Parameters formunderthe Designtab entera Delta P of 0.
RX-006H Revised:Nov6,2012
7
4.13. Specify the feedStream. Goto the Worksheettaband entera Temperature of 25°C, a Pressure of 10
bar, and a Molar Flowof 1 kgmole/h.
4.14. In the Compositionformentera Mole Fraction of 1 for cis-2-butene. Whencomplete the reactor
shouldsolve.
4.15. Use an adjustblock to determinethe lengthrequiredtoachieve90% conversion. AddanAdjust blockto
the flowsheetfromthe Model Palette.
RX-006H Revised:Nov6,2012
8
4.16. Double clickthe adjustblock(ADJ-1). Specifythe AdjustedVariable tobe the Tube Length of PFR-100.
Specifythe TargetVariable to be the Act. % Cnv.of PFR-100. Entera Target Value of 90.
RX-006H Revised:Nov6,2012
9
4.17. In the Parameters tab,change the StepSize to 0.1 m andchange the MaximumIterations to 1000.
ClickStart to begincalculations,the blockshouldsolve afterseveral iterations..
RX-006H Revised:Nov6,2012
10
4.18. To viewthe reactorlength,double clickthe reactorandgo to the Rating tab. Here youwill see thatthe
requiredreactorlengthis 8.348 meters.
5. Conclusion
AspenHYSYS can be usedto calculate the requiredreactorlengthtoachieve adesiredreactionconversionina
plugflowreactor. The requiredreactorlengthwasdeterminedtobe 8.348 metersinorderto achieve 90%
reactor conversion. Thissame strategy canbe appliedformuchmore complex reactionsandmulti-tube
reactors,whichwouldbe muchmore difficulttoattempttosolve usinghandcalculations.
6. Copyright
Copyright© 2012 by AspenTechnology,Inc.(“AspenTech”).All rightsreserved. Thiswork maynot be
reproducedordistributedinanyformor byany meanswithoutthe priorwrittenconsentof
AspenTech. ASPENTECHMAKESNOWARRANTYOR REPRESENTATION,EITHER EXPRESSEDOR IMPLIED, WITH
RESPECT TO THIS WORK and assumesnoliabilityforanyerrors or omissions. Innoeventwill AspenTechbe
liable toyoufordamages,includinganylossof profits,lostsavings,orotherincidental orconsequential
damagesarisingoutof the use of the informationcontainedin,orthe digital filessuppliedwithor foruse with,
thiswork. This workand itscontentsare providedforeducational purposesonly.
RX-006H Revised:Nov6,2012
11
AspenTech®,aspenONE®,andthe Aspenleaf logo,are trademarksof AspenTechnology,Inc.. Brandsand
productnamesmentionedinthisdocumentationare trademarksorservice marksof theirrespective companies.
RX-007H Revised:Nov5,2012
1
Esterification in a PFR with Aspen HYSYS® V8.0
1. Lesson Objectives
 Use Aspen HYSYSto determine whetheragivenreactionistechnicallyfeasibleusingaplugflow
reactor.
2. Prerequisites
 AspenHYSYS V8.0
 Basic knowledgeof reactionrate laws
3. Background
Considerthe reversibleliquidphase esterificationof aceticacidshownbelow.
The examplespresentedare solelyintendedtoillustrate specificconceptsand principles. Theymay not
reflectan industrial application or real situation.
4. Problem Statement and Aspen HYSYS Solution
It isdesiredtoproduce 375 kg/h of ethyl acetate productfroma feedstreamconsistingof 13 mole % acetic acid,
35 mole %ethanol,and52 mole %water.This feedstreamisavailableat100,000 kg/day.A single tube plug
flowreactorwitha lengthof 10 metersanda diameterof 1 m isavailable foruse inan existingchemical plant.
Determine if itisfeasible toachieve the desiredproductusingthisreactor.
RX-007H Revised:Nov5,2012
2
Aspen HYSYS Solution:
4.01. Start a newcase in AspenHYSYS V8.0.
4.02. Create a componentlist. Inthe ComponentLists folderselectAdd. Addaceticacid, ethanol,ethyl
acetate,andwater to the componentlist.
4.03. Define the propertypackage. Inthe FluidPackagesfolderselectAdd. SelectNRTLas the property
package.
4.04. Define reaction. Inthe ReactionsfolderselectAddtoadd a new Reaction Set. In Set-1 clickAdd
Reaction and selectKinetictoadda new kineticreaction.
RX-007H Revised:Nov5,2012
3
4.05. Double click Rxn-1to define the kineticreaction. Enterthe followinginformationandclose the window
whencomplete. Be sure to select AqueousPhase as the Rxn Phase.
4.06. Attach reactionsetto fluidpackage. Clickthe Addto FP buttonand select Basis-1.
4.07. Create the flowsheet. Enterthe simulationenvironmentbyclickingthe Simulationbuttoninthe bottom
leftof the screen.
RX-007H Revised:Nov5,2012
4
4.08. Place a Plug FlowReactor blockontothe flowsheetfromthe Model Palette.
4.09. Double clickthe reactor(PFR-100). Create an Inletstreamcalled Feedandan Outletstream called
Product.
RX-007H Revised:Nov5,2012
5
4.10. In the Reactions tab selectSet-1asthe Reaction Set.
RX-007H Revised:Nov5,2012
6
4.11. In the Rating tab, specifyaLength of 10 meters anda Diameterof 1 meter.
4.12. In the Parameters formunderthe Designtab, entera Delta P of 0.
RX-007H Revised:Nov5,2012
7
4.13. We mustnowdefine the Feedstream. Goto the Worksheettab. For the Feedstream, entera
Temperature of 25°C, a Pressure of 1 bar, and a Mass flow of 100,000 kg/day (4167 kg/h).
4.14. In the CompositionformenterMole Fractions of 0.13 foracetic acid, 0.35 for ethanol, 0 forethyl
acetate,and 0.52 for water. The feedstreamshouldnow be fullydefinedandthe reactorshouldsolve.
RX-007H Revised:Nov5,2012
8
4.15. Checkresults. Rightclickonthe Product streamand selectShowTable. A table will appearonthe
flowsheet. Double clickthe table andselect AddVariable.
4.16. Selectthe MasterComp Mass Flow andselectcomponent E-Acetate.
RX-007H Revised:Nov5,2012
9
4.17. The mass flowrate of ethyl acetate will now be addedtothe table.
4.18. The mass flowrate of ethyl acetate inthe productstreamis 453.4 kg/h.
5. Conclusion
The use of the 10 meterreactorand providedfeedstocktoproduce 375 kg/h isfeasible.Aspen HYSYScanbe
usedto model existingequipmentinadditiontodesigningnew equipment. Modelingexistingequipmentlets
engineersdecide if theycanrepurpose equipmentand improve performance bychangingstate variables.
6. Copyright
Copyright© 2012 by AspenTechnology,Inc.(“AspenTech”).All rightsreserved. Thisworkmaynot be
reproducedordistributedinanyformor byany meanswithoutthe priorwrittenconsentof
AspenTech. ASPENTECHMAKESNOWARRANTYOR REPRESENTATION,EITHER EXPRESSEDOR IMPLIED, WITH
RESPECT TO THIS WORK and assumesnoliabilityforanyerrorsor omissions. Innoeventwill AspenTechbe
liable toyoufordamages,includinganylossof profits,lostsavings,orotherincidental orconsequential
damagesarisingoutof the use of the informationcontainedin,orthe digital filessuppliedwithorforuse with,
thiswork. This workand itscontentsare providedforeducational purposesonly.
AspenTech®,aspenONE®,andthe Aspenleaf logo,are trademarksof AspenTechnology,Inc.. Brandsand
productnamesmentionedinthisdocumentationare trademarksorservice marksof theirrespective companies.
RX-008H Revised:Nov6,2012
1
Simple Combustion Reactor with Aspen HYSYS® V8.0
1. Lesson Objectives
 Use conversionreactorblock
 Determine airflowrate neededforacleanburn
 Determine heatavailablefromafuel stream
2. Prerequisites
 Aspen HYSYS V8.0
 Understandingof enthalpyof combustion
3. Background
Natural gas, whichisprimarilymethane,isdistributedinundergroundpipes. The pressure inthese pipesvaries
dependingonwhere inthe pipe itis:the closertothe pumpingstation,the higherthe pressure. Anindustrial
customercan expecttoget natural gas at around60 psig,andis typically chargedpercubicfootof natural gas
used. Methane burnsinthe followingreaction:
CH4 + 2 O2  CO2 + 2 H2O
The examplespresentedare solelyintendedtoillustrate specificconceptsand principles. Theymay not
reflectan industrial application or real situation.
4. Problem Statement and Aspen HYSYS Solution
Problem
Determine howmuchenergyisavailable froma5 ft3
/h(0.472 kg/h) fuel streamthatconsistsof onlymethane at
60 psig. The air feedshouldbe approximatedwith80mol-% nitrogenand20 mol-% oxygen. There shouldbe
10% excessoxygeninthe airstreamsothe fuel-airmixtureisnottoorich. Assume the exhaustis182 °C. Report
the air flowrate in mol/handft3
/h(at1 atm) inadditiontothe available heat inkW.
Mole Balance
Two molesof oxygenare requiredtocombusteachmole of methane. Oxygenisone fifthof the molesinair.
Therefore there will needtobe tenmolesof air foreach mole of methane fora stoichiometricmixture. A 10%
excessrequiresa10% increase inthe relative amountof air,or11 molesof air foreach mole of methane.
RX-008H Revised:Nov6,2012
2
Aspen HYSYS Solution
4.01. Start AspenHYSYS V8.0. SelectNewtocreate a new simulation.
4.02. Create a componentlist. Inthe navigation pane find ComponentListsandselectAddto create a new
HYSYS componentlist. Add Oxygen,Nitrogen, Methane,CarbonDioxide,andWaterto the component
list.
4.03. Adda fluidpackage. Goto FluidPackages and selectAdd. SelectPeng-Robinsonasthe property
package.
4.04. Define reaction. Goto Reactionsand click Newto create a new reactionset. Inthe formfor the newly
createdreactionset,click Add Reactionand selectHysys,Conversion.
RX-008H Revised:Nov6,2012
3
4.05. Double click Rxn-1to openthe ConversionReaction: Rnx-1 window. Enterthe followinginformation.
Notice thatthe Reaction Heat isautomaticallycalculatedtobe -8.0e+05 kJ/kgmole.
4.06. Attach reactiontofluidpackage. Inthe Reaction Set 1 form, clickthe Add to FP button. SelectBasis-1.
RX-008H Revised:Nov6,2012
4
4.07. At thispoint,youare readyto move to the simulationenvironment. Todo so,clickthe Simulation
buttonat the bottomleftof the screen.
4.08. On the mainflowsheetcreate amaterial streamusingthe Model Palette.Selectthe iconformaterial
streamand place itonto the flowsheet.
RX-008H Revised:Nov6,2012
5
4.09. Double clickthe streamto openthe streampropertywindow.Change the streamname to Methane,
and entera Temperature of 25°C, a Pressure of 515 kPa, anda Mass Flowof 0.472 kg/h.
4.10. Go to the Compositionformandentera Mole Fraction of 1 forMethane. You will notice thatafter
enteringthe streamcomposition,the statusbarwill turngreenandsay OK. This indicatesthatstreamis
fullydefinedandsolvedforall parameters.
RX-008H Revised:Nov6,2012
6
4.11. Create a secondmaterial streamtobe the air streamthat isrequiredforcombustion.Double clickon
the new material streamandenterthe followinginformation. Boldblue fontindicatesauser-entered
value. Fromthe solved Methane stream, we know there are 0.02942 kgmole/hr of Methane. We
wouldlike there tobe 11 molesof airfor eachmole of methane,therefore we willenteramolar
flowrate of 0.324 kgmole/hr forthe air stream. Entera Mole Fraction of 0.2 for Oxygenand mole
fractionof 0.8 forNitrogen. The streamshouldthensolve.
RX-008H Revised:Nov6,2012
7
4.12. The flowsheetshouldnowlooklikethe following.
RX-008H Revised:Nov6,2012
8
4.13. We will nowplace avalve inorderto reduce the pressure of the methane streamtoambientpressure.
SelectaControl Valve from the Model Palette and place itontothe flowsheet.
4.14. Double clickthe valve toopenthe valve propertywindow. Inthe Connectionspage selectMethane as
the Inletstream andcreate an OutletcalledMethane-LP.
RX-008H Revised:Nov6,2012
9
4.15. Specifyvalve outletpressure. Goto the Worksheettaband entera Pressure of 101.3 kPa forthe
Methane-LPstream. The valve shouldsolve.
RX-008H Revised:Nov6,2012
10
4.16. Insertreactor. PressF12 to openthe UnitOpswindow.Selectthe Reactorsradiobuttonand add a
ConversionReactor to the flowsheet.
4.17. In the ConversionReactor propertywindow selectstreams AirandMethane-LPas Inletstreams.
Create a Vapour Outlet streamcalled VAP-Outanda LiquidOutlet calledLIQ-Out.
RX-008H Revised:Nov6,2012
11
4.18. Go to the Reactionstab. SelectSet-1for ReactionSet. The reactor shouldsolve andthe statusshould
turn greenandsay OK.
RX-008H Revised:Nov6,2012
12
4.19. The flowsheetshouldnowlooklikethe following.
4.20. To check resultsgoto Worksheettabof the ConversionReactor. You can see that the streamVAP-Out
isleavingthe reactorat an extremelyhightemperature. Thisisdue tothe highheatof reaction. To
calculate exactlyhowmuchenergyisreleasedfromthisreactionsimplytake the heatof reactionfound
inthe Reactionstab and multiplyitbythe methane molarflowrate. Inthiscase,burning5 ft3
/hof
methane releases 6.5kW.
RX-008H Revised:Nov6,2012
13
5. Conclusions
5 ft3
/hof methane produces6.5 kW of heat. To runa quality,leanmixture there mustbe 280 ft3
/hof air (that is
20 mol-%oxygen) whichis0.324 kgmole/h. The conversionreactorblockisuseful forquicksimulationswith
well understoodreactions. Reactions withslow kinetics,orcomplex systemswithseriesorparallelreactionsare
outside the scope of thisreactormodel.
Thissimulationcouldalsobe createdusingaGibbsreactor block. The Gibbsreactor isunique inthat itcan
functionwithoutadefinedreactionset. Thisreactorblockwill minimizethe Gibbsfree energyof the reacting
systemtocalculate the productcomposition. Thisreactorblockisuseful whenthe exactreactionsorkinetics
are unknown,andthe reactionreachesequilibriumveryquickly. Itmaybe a useful exercise torepeatthis
module usingaGibbsreactor and compare results.
6. Copyright
Copyright© 2012 by AspenTechnology,Inc.(“AspenTech”).All rightsreserved. Thisworkmaynot be
reproducedordistributedinanyformor by any meanswithoutthe priorwrittenconsentof
AspenTech. ASPENTECHMAKESNOWARRANTYOR REPRESENTATION,EITHER EXPRESSEDOR IMPLIED, WITH
RESPECT TO THIS WORK and assumesnoliabilityforanyerrorsor omissions. Innoeventwill AspenTechbe
liable toyoufordamages,includinganylossof profits,lostsavings,orotherincidental orconsequential
damagesarisingoutof the use of the informationcontainedin,orthe digital filessuppliedwithorforuse with,
thiswork. This workand itscontentsare providedforeducational purposesonly.
AspenTech®,aspenONE®,andthe Aspenleaf logo,are trademarksof AspenTechnology,Inc.. Brandsand
productnamesmentionedinthisdocumentationare trademarksorservice marksof theirrespective companies.
Instrumentation and Process Control
Dyn-001H Revised:Nov 13,2012
1
Dynamic Analysis of a CSTR with Aspen HYSYS® V8.0
1. Lesson Objective:
 Understand the basicworkflowtocreate and runa dynamicsimulationusingAspen HYSYSDynamics
 Setup a simple dynamicsimulation of aCSTR
 Observe the effectof perturbationsthrough changesinthe controllersettings
2. Prerequisites
 Aspen HYSYS V8.0
 File Dyn-001_CSTR_Start.hsc
 Basic knowledgeof controllers
3. Background
Dynamic Simulation in Chemical Engineering
Dynamic simulation is an extension of steady-state process simulation whereby time-dependence is built into
the models via derivative terms i.e. accumulation of mass and energy. The advent of dynamic simulation means
that the time-dependent description and control of real processes in real or simulated time are possible. This
includes the description of starting up and shutting down a plant, changes of conditions during a reaction,
holdups, thermal changes and more. Dynamic simulations require increased calculation time and are
mathematically more complex than steady-state simulations. They can be seen as repeatedly calculated steady-
state simulations (based on a fixed time step) with constantly changing parameters. Dynamic simulation can be
used in both an online and offline fashion. The online case being model predictive control, where the real-time
simulation results are used to predict the changes that would occur for a control input change, and the control
parameters are optimized based on the results. Offline process simulation can be used in the design,
troubleshooting and optimization of process plant as well as the conduction of case studies to assess the
impactsof processmodifications.
4. Problem Statement and Aspen HYSYS Solution
Problem: Use the provided Aspen HYSYS file Dyn_001_CSTR_Start.hsc, prepare a dynamic simulation flowsheet
and performthe followingstudiestoinvestigatehow the reactorsystembehavesdynamically when:
 Manipulate the level controllersetpoint
 Varythe reactorfeedflowrate
Dyn-001H Revised:Nov 13,2012
2
Aspen HYSYS Solution:
4.01. Start AspenHYSYS V8.0. OpenDyn_001H_CSTR_Start.hsc
4.02. Observe the flowsheet.Thisscenariosimulatesthe productionof propylene glycol fromwaterand
propylene oxide.The controllers FIC-100,TIC-100, and LIC-100, control the feedflow,reactor
temperature,andreactorliquidlevel,respectively.Clickonthe Dynamics tab inthe Ribbon. Notice that
the simulationisalreadyin DynamicsMode.
4.03. Press SHIFT + P. Thiswill displaythe pressuresof all the streams. Notice thatinputandoutputstreams
(PreFeed, ReactorVent,PRODUCT) have stars nextto theirvalues. Thisindicatesthatthere isa
pressure specificationonthe streams. These specificationsare neededforthe dynamicsimulationtobe
Pressure Driven,as the dynamicflowratesare determinedbypressure drops. The specificationscanbe
observedbydouble clickingonastreamand goingto the Dynamics tab. ClickSHIFT + N to displaythe
streamnames.
Dyn-001H Revised:Nov 13,2012
3
(FAQ) Types of DynamicSimulations
 Flowdriven
 Feedflowrate andpressuresare specified
 Flowrate isnotcontrolledbypressure differences
 Useful fora firstapproach of the dynamicbehaviorof the process
 Good forliquidprocesses(usuallygoodflow controllability)
 Pressure driven
 Feedandproduct pressuresare specified
 Flowrate resultsfrompressure difference
 A bitmore complex tospecify(because youneedtobalance the pressuresinAspen
HYSYS withvalves,pumps,...) butmore rigorous
4.04. The PRODUCT stream will be observed to determine the effects on the changing system. Double click
on the PRODUCT, and go to the Dynamics | Stripchart page. In the Variable Set dropdown menu, select
T, P, and F. ClickCreate Stripchart. This will create anew stripchartcalled PRODUCT-DL1.
Dyn-001H Revised:Nov 13,2012
4
4.05. We will runfollowingscenario toinvestigate the reactordynamics:
 Run the dynamicsimulationfor2hours (Note:thisis insimulationtime,notin real time)
 Change the Level Controller(LIC-100) setpointto 60%
 Run the dynamic simulation for 3 additional hours; find how the product stream results are
beingaffected
4.06. In the NavigationPane, clickon the Strip Charts folderandpressthe Display button.
4.07. Right click on the chart and select Graph Control. In the Axes tab check Automatic Auto Scale in the
Auto Scale sectionand Show All in the AxisDisplay section.
Dyn-001H Revised:Nov 13,2012
5
4.08. In the Time Axis tab, click the Set-up Logger button. This allows you to change the number of samples
the logger will keep on the plot. The full simulation takes 5 hours, which is equal to 900 20-second
intervals.Enter900 in the Logger Size field.
4.09. In the Dynamics tab in the Ribbon,clickon the Integrator button.
4.10. In the Integrator menu, enter an end time of 120 minutes. Click the Start button to run the first 2 hours
of the simulation.
Dyn-001H Revised:Nov 13,2012
6
4.11. On the Flowsheet, double click on LIC-100, and change the set point to 60%. This specifies a tank level
that is60% full.
Dyn-001H Revised:Nov 13,2012
7
4.12. Change the End Time of the Integrator to 300 minutes, and press Continue to finish the remaining 3
hours of the simulation.
4.13. When the simulation finishes, right click on the strip chart PRODUCT-DL1 and select Graph Control. In
the Time Axistab, change Low Time to 0 minutes.
4.14. Resize PRODUCT-DL1 by dragging the corner. Observe the effect that changing the tank height had on
the product stream.
Dyn-001H Revised:Nov 13,2012
8
4.15. Change in feedrate. We will nowexperiment withanotherscenariotoinvestigatethe reactordynamics.
(1) Run simulationfor2hours
(2) Linearramp up the feedrate from 2.064e+4 lb/hr to 2.8e+4 lb/hr in2 hours
(3) Linearramp downthe feedrate from 2.8e+4 lb/hr to 0 lb/hr in1 hour
4.16. Click the Integrator button in the Dynamics tab on the Ribbon. Clear the value for End Time so that it
reads<Non-stop> and pressthe Resetbutton. ClickYeson the subsequentwindow thatappears.
Dyn-001H Revised:Nov 13,2012
9
4.17. Change the SP of LIC-100 back to 87.22 and run the simulation until the PRODUCT stream stabilizes. This
will returnthe simulationtoitsoriginal state. Resetthe Integratoragain.
4.18. Under ModelingOptionsinthe Dynamics tab of the Ribbon,clickon Event Scheduler.
4.19. The Event Schedulerallowsusto setup a seriesof eventsthatcantake place at differenttimesordue
to specifictriggers.Click AddunderSchedule Optionstocreate a new schedule. ClickAddonthe right-
handside of the windowtocreate a new Sequence withinthe schedule.
Dyn-001H Revised:Nov 13,2012
10
4.20. Click View to open Sequence A. This sequence will consist of three events. Ramping up the controller
set point, ramping down the set point, and terminating the sequence. Click the Add button three times
to create three events.
4.21. Double click on Event 1 to specify the first event. In the Condition tab, click the A Specific Simulation
Time radiobuttonand enter2 hours for WaitUntil.
Dyn-001H Revised:Nov 13,2012
11
4.22. In the Action List tab, click Add to create a new Action. In the Type dropdown menu, select Ramp
Controller. Click Select Target and choose FIC-100 for Controller. Enter 28000 lb/hr for the Target SP,
and 2 hours forRamp Duration. Close the window.
4.23. In the window titled Sequence A of Schedule 1, double click on Event 2. This is the step where the
controller ramps down, and it occurs 4 hours into the simulation. Once again, click the A Specific
Simulation Time radio button, and this time enter 4 hours in the Wait Until field. Add a new Action in
the Action List tab, and select Ramp Controller for Type. Select FIC-100 for Controller, 0 for Target SP,
and 1 hour forRamp Duration.
4.24. Double click on Event 3 in the Sequence A of Schedule 1 to specify the final event. Select the A Specific
Simulation Time radio button and enter 5 hours in the Wait Until Field in the Condition tab. In the
Action tab, Add a new Action,and selectStopIntegrator for Type.
4.25. In the Sequence Aof Schedule 1 window,click Start underSequence Options.
Dyn-001H Revised:Nov 13,2012
12
4.26. The simulationisreadytobegin.Click Runinthe Dynamics tab of the Ribbon.
4.27. View stripchartPRODUCT-DL1 to see the effectsof changingthe flow rate.
5. Conclusion
You shouldnowbe familiarwith the basicsetupof a dynamicsimulationinHYSYS. You should alsobe familiar
withhowto initialize asimulation,create customplots,displayresults,andmake changesinprocessconditions.
Changesincontrollersetpointsorotherprocessconditionscanhave large effectsonthe overall processandit
isimportantto understandthese effectswhendesigningoroperatingaprocess.
Dyn-001H Revised:Nov 13,2012
13
6. Copyright
Copyright © 2012 by Aspen Technology, Inc. (“AspenTech”). All rights reserved. This work may not be
reproduced or distributed in any form or by any means without the prior written consent of
AspenTech. ASPENTECH MAKES NO WARRANTY OR REPRESENTATION, EITHER EXPRESSED OR IMPLIED, WITH
RESPECT TO THIS WORK and assumes no liability for any errors or omissions. In no event will AspenTech be
liable to you for damages, including any loss of profits, lost savings, or other incidental or consequential
damages arising out of the use of the information contained in, or the digital files supplied with or for use with,
thiswork. This workand itscontentsare providedforeducational purposesonly.
AspenTech®, aspenONE®, and the Aspen leaf logo, are trademarks of Aspen Technology, Inc.. Brands and
productnamesmentionedinthisdocumentationare trademarksorservice marksof theirrespective companies.
Dyn-002H Revised:Nov9,2012
1
Dynamic Analysis of a PFR with Aspen HYSYS® V8.0
1. Lesson Objective:
 To understandbasicworkflowtocreate andrun dynamicsimulationusingAspen HYSYS
 To setupa simple dynamicsimulationof PFR
 To setupa basic controller
 To observe the effectof perturbationsonthe controllersettings
2. Prerequisites
 Aspen HYSYS V8.0
 File Dyn-002_PFR_Start.hsc
3. Background
Dynamic Simulation in Chemical Engineering
Dynamic simulation is an extension of steady-state process simulation whereby time-dependence is built into
the models via derivative terms i.e. accumulation of mass and energy. The advent of dynamic simulation means
that the time-dependent description and control of real processes in real or simulated time are possible. This
includes the description of starting up and shutting down a plant, changes of conditions during a reaction,
holdups, thermal changes and more. Dynamic simulations require increased calculation time and are
mathematically more complex than steady-state simulations. They can be seen as repeatedly calculated steady-
state simulations (based on a fixed time step) with constantly changing parameters. Dynamic simulation can be
used in both an online and offline fashion. The online case being model predictive control, where the real-time
simulation results are used to predict the changes that would occur for a control input change, and the control
parameters are optimized based on the results. Offline process simulation can be used in the design,
troubleshooting and optimization of process plant as well as the conduction of case studies to assess the
impactsof processmodifications.
The examplespresentedare solelyintendedtoillustrate specificconceptsand principles. Theymay not
reflectan industrial application or real situation.
Dyn-002H Revised:Nov9,2012
2
4. Problem Statement and Solution
Problem: Using the provided Aspen HYSYS file Dyn-002H_PFR_Start.hsc, prepare a dynamic simulation
flowsheet by adding the required dynamic data. Then perform the following study to investigate how the
reactor systembehaves dynamically inresponse tochangesinfeedtemperature.
Descriptionof the providedAspen HYSYSfile “Dyn-002_PFR_Start.hsc”:
- PFR reactor
- Reaction activation energy E = 5000 cal/mol; which will allow a temperature sensitivity to the reactor
duringthe course of the dynamicsimulation
- Reactor type = Adiabatic
- Pressure drop= 0.1bar
Aspen HYSYS Solution:
4.01. Start AspenHYSYS V8.0. OpenDyn-002_PFR_Start.hsc.
4.02. The systemconsistsof a PFR witha Heater that preheatsthe FEED stream.
4.03. Inserta controller.A controllerwillbe usedtocontrol the FEED Temperature.In the Model Palette,
clickon the Dynamics tab and double clickon PID Controller.
Dyn-002H Revised:Nov9,2012
3
4.04. A windowcalled IC-100will appear.Click the SelectPVbuttontospecifythe ProcessVariable.Thisisthe
variable thatwill be controlled.Inthiscase,the PVis FEED Temperature.
Dyn-002H Revised:Nov9,2012
4
4.05. The output(OP) is the variable thatis variedinorderto control the PV.Clickthe SelectOP button,and
choose Q for Objectand Control Valve forVariable. Thisisthe heatflow tothe heater.
Dyn-002H Revised:Nov9,2012
5
4.06. Clickthe Control Valve… buttontospecifythe range of valuesforthe OP. In the Direct Q section,enter
1e+04 kcal/h for Min.Available and 1e+07 kcal/h for Max. Available.
Dyn-002H Revised:Nov9,2012
6
4.07. Back in the TIC-100 window,move tothe Parameterstab. In the Range section,setPVMinimumto
10°C and PV Maximumto 80°C. The setsthe range of valuesforthe FEED Temperature. In the
Operational Parameters section,make sure that Action: isset to Reverse. A Reverse actioncontroller
meansthat whenthe erroris positive (i.e.the temperature ishigherthanthe setpoint),the OPwill
decrease (reduce heatflow). SetMode toAuto, whichwill varythe OPto reachthe SP. Manual Mode
allowsyoutoadjustthe OPmanually. Finally,underTuningParameters,enter0.1 for Kc and 0.2 for Ti.
The Parameters tab shouldlooklike the image shownbelow.
Dyn-002H Revised:Nov9,2012
7
4.08. Go to the Dynamics tab,press the Dynamic Mode button.
4.09. A dialogbox will warnyouthatthere are itemsthatneedattention.Click Yestobringup the Dynamics
Assistant.
Dyn-002H Revised:Nov9,2012
8
4.10. In order for Dynamics to run properly, either the pressure or the flow must be specified in the input and
output streams. Move to the Streams tab, and the Assistant will show which streams need
specificationsandwhichdonot.
Dyn-002H Revised:Nov9,2012
9
4.11. Double click on the stream FEED, and move to the Dynamics tab. Uncheck the Active box under Flow
SpecificationandPressure Specification.
Dyn-002H Revised:Nov9,2012
10
4.12. Close the window. Double click on both PREFEED and PRODUCT streams, and make sure the Pressure
Specifications are Active and the Flow Specifications are not. Click the Analyze Again button in the
Dynamics Assistant window. Inthe Streams tab,there should now be no streamsineitherbox.
4.13. In the checklist in the General tab, there are now only two entries. A way to expedite the setup process
is to use the Make Changes button, which will automatically resolve the issues. This button can be
useful, but may make changes that are undesired. In this case, we will click Make Changes. Click Finish
whencomplete.
Dyn-002H Revised:Nov9,2012
11
4.14. We are now ready to enter Dynamics mode. Click the Dynamics Mode button in the Dynamics tab, and
clickYeswhenprompted.
4.15. Strip charts can be used to monitor the changes that take place. Double click on the Product stream and
move to the Dynamics tab. On the left-hand side of the window, click Stripchart. The dropdown menu
next to Variable Set has many premade strip charts that can be used. Select the T, P, and F chart, which
containsthe variables Temperature,Pressure,andMolar Flow.
Dyn-002H Revised:Nov9,2012
12
4.16. Click on Create Stripchart to create a strip chart called Product-DL1. Click on Display to bring up the
actual plot.
Dyn-002H Revised:Nov9,2012
13
4.17. Right now, the only label on the Y-axis is Molar Flow. Right click on the plot and select Graph Control.
In the Axes tab, check the Show All box in Axis Display for all three variables to be displayed. Also check
the Automatic Auto Scale box underAuto Scale.
Dyn-002H Revised:Nov9,2012
14
4.18. We also want to change the timeframe that the chart will observe. In the Time Axis tab of the Strip
Chart Configuration window, click the Set-up Logger button. Change the Logger Size to 900. This means
that the loggerwill take 900 samplesat20 secondintervals,givingatotal observationtime of 5hours.
4.19. Strip charts can also be created from scratch. Click on the Strip Charts folder in the Navigation Pane,
and clickthe Add buttonto create a new StripChart. Name thischart PRODUCT-COMP.
Dyn-002H Revised:Nov9,2012
15
4.20. Double click on PRODUCT-COMP. Click on the Add button to add variables to the strip chart. Add the
Master Comp Mole Flowfor AceticAcid and E-Acetate in the Product stream.
Dyn-002H Revised:Nov9,2012
16
4.21. In the PRODUCT-COMP window, click on Display to bring up the plot. Once again, right click on the
graph and open up Graph Control to display all variables on the Y-Axis. Also check the Automatic Auto
Scale box and setthe Logger Size to 900.
4.22. We will create the followingscenario toinvestigatethe reactordynamics.
 Run the dynamic simulation for 1 hour at 10°C (Note: this is in simulated time, not in actual time)
 Ramp upthe feedtemperaturefrom 10 to 60°C overthe course of 1 hour
 Continue the dynamicrunforanotherhour
 Ramp the feed temperature downfrom60 to 10°C over1 hour.
 Continue the dynamicrunforan additional hour
 Look at the impacton the product streamresults (componentflows,temperature,etc.)
4.23. In the Dynamics tab of the Ribbon,clickon Event SchedulerinModelingOptions.
Dyn-002H Revised:Nov9,2012
17
4.24. ClickAdd underSchedule Optionstocreate a new schedule.Click Addonthe right-handside of the
windowtocreate a new Sequence inthe schedule.
4.25. Double clickon Sequence Ato bring upthe Sequence Aof Schedule 1 window. ClickAdd3 timesto
create 3 Events.Double clickon Event 1 to configure the conditionsforthe firsteventinthe scenario.
Dyn-002H Revised:Nov9,2012
18
4.26. The firststepin the scenarioisto run the simulationfor 1hour. Selectthe A SpecificSimulationTime
radiobuttonunderWait For…,and enter1 hour in the Wait Until field.
Dyn-002H Revised:Nov9,2012
19
4.27. Move to the Action List tab.Click Add inList of Actions For This Event to create Action 1. Make sure
that the Type isRamp Controller.InConfiguration,click SelectTarget, and selectthe TIC-100 as the
variable.Enter60°C inthe Target SP box and 1 hour inthe Ramp Duration box.
Dyn-002H Revised:Nov9,2012
20
4.28. Close the window.Backinthe Sequence Awindow, double clickon Event2. Afterthe temperature is
elevatedto 60°C,the simulationistorunfor an additional hourbefore the temperature is reducedto
10°C. Therefore,the eventshouldoccuratthe 3 hour mark. Selectthe radiobuttonforA Specific
SimulationTime and entera Wait Until value of 3 hours. Inthe ActionList tab, add a new action.
SelectRamp ControllerforType and TIC-100 for Target, andenter10°C for Target SP and1 hour for
Ramp Duration.
Dyn-002H Revised:Nov9,2012
21
4.29. Finally, double clickon Event3. The simulationistorunfor anotherhourbefore ending,meaningthe
total processwill runfor 5 hours. Selectthe radiobuttonfor A SpecificSimulationTime and enter5
hours for the WaitUntil value. Inthe Action List tab adda new actionand select StopIntegrator for
Type.
4.30. The Scenario is readyto start.In the Sequence A of Schedule 1 window,click StartunderSequence
Options.
Dyn-002H Revised:Nov9,2012
22
4.31. Both stripcharts can be viewedbygoingtotheirrespective foldersinthe NavigationPane and clicking
Display.
4.32. In the Dynamics Tab inthe Ribbon, clickRun.
4.33. The changesin productflowandstream conditionscanbe monitoredinthe stripchartsas the
simulationtakesplace.Whenitisfinished,rightclickonthe charts andselect GraphControl. The Axes
and Time Axis tabscan be usedto change the axissize andobserve the entire simulation.The charts
shouldlooklike those presentedbelow.
Dyn-002H Revised:Nov9,2012
23
Dyn-002H Revised:Nov9,2012
24
4.34. If you wishtorerun the simulationor runa difference sequence,youmust resetthe integratorand
restartthe sequence.
5. Conclusion
You shouldnowbe familiarwithhowtotake a simple Aspen HYSYSsimulationandconvertittoa HYSYS
Dynamicssimulation,aswell ashowto setup controllersanduse the DynamicsAssistantutility. Changesin
controllersetpointsorotherprocessconditionscanhave large effectsonthe overall processanditisimportant
to understandthese effectswhendesigningoroperatingaprocess.
6. Copyright
Copyright © 2012 by Aspen Technology, Inc. (“AspenTech”). All rights reserved. This work may not be
reproduced or distributed in any form or by any means without the prior written consent of
AspenTech. ASPENTECH MAKES NO WARRANTY OR REPRESENTATION, EITHER EXPRESSED OR IMPLIED, WITH
RESPECT TO THIS WORK and assumes no liability for any errors or omissions. In no event will AspenTech be
liable to you for damages, including any loss of profits, lost savings, or other incidental or consequential
damages arising out of the use of the information contained in, or the digital files supplied with or for use with,
thiswork. This workand itscontentsare providedforeducational purposesonly.
AspenTech®, aspenONE®, and the Aspen leaf logo, are trademarks of Aspen Technology, Inc.. Brands and
productnamesmentioned inthisdocumentationare trademarksorservice marksof theirrespective companies.
Dyn-003H Revised:Nov20,2012
1
Dynamic Analysis of Cyclohexane Production
with Aspen HYSYS® V8.0
1. Objectives
 Convertpreviouslycreated AspenHYSYS processsimulationtoAspen HYSYSDynamics simulation
 Become familiarwithAspen HYSYSDynamicsV8.0 userinterface
 Investigate the effectsof asudden changes inhydrogenfeedrate onproductcompositionand
flowrate
2. Prerequisites
 Aspen HYSYS V8.0
 File Dyn_003H_Cyclohexane_Start.hsc
3. Background
Aspen HYSYS is used to design new plants or model existing ones at what is considered to be the nominal
process operating conditions at steady-state. However, real processes operate at steady-states that may be very
different from the nominal one assumed by the static simulator. In particular, HYSYS Dynamics allows users to
observe how the system switches from one steady-state condition to another one, or how the process responds
to all sort of disturbances—reactant stream flowrate or purity changes, pressure or temperature variations at
different locations—and finally, the prediction of worst case scenarios in case of power loss, fires, deactivated
catalystbedin reactorsor reactors inrunawayconditions, etc.
Aspen HYSYS Dynamics is also used to design the right control scheme that would minimize or better “reject”
the effect of severe disturbances on the plant performance and, as you may expect, process dynamics and
processcontrol can hardlybe conceivedwithoutone another.
The examples presented are solely intended to illustrate specific concepts and principles. They may not
reflectan industrial application or real situation.
Dyn-003H Revised:Nov20,2012
2
4. Aspen HYSYS Solution
In thisexample we will investigatethe dynamicresponse of asmall sectionof a cyclohexaneplanttochangesin
feedrate to the reactor.
4.01. Openthe Aspen HYSYS file called Dyn_003H_Cyclohexane_Start.hsc.
4.02. Modify the simulation in order to enable dynamics mode in Aspen HYSYS. In the Dynamics tab of the
Ribbon,clickon the Dynamics Assistantbutton. This will bringupthe Dynamics Assistant window.
4.03. The window shows information that needs to be specified in order for the simulation to be converted to
a dynamiccase. Double clickonthe firstentry, Enable stream pressure specifications.
Dyn-003H Revised:Nov20,2012
3
4.04. The Pressure Specs form under the Streams tab will appear. There are three streams that are listed
under Set pressure specifications in these streams. These are the input and output streams. If you
double click on a stream, it will bring up the corresponding window. Move to the Dynamics tab of the
window, and check the Pressure Specification box. Activate the pressure specifications for each listed
stream.
Dyn-003H Revised:Nov20,2012
4
4.05. In the General tabof the Dynamics Assistant window,clickon Analyze Again. Notice that the firstitem
on the listis removed.
4.06. The nextitemonthe listis Valvesnot sized. Close the window,anddouble clickon VLV-101on the flow
sheet. Inthe Rating tab of the VLV-101 window,clickthe Size Valve button,andHYSYS will
automaticallysize VLV-101. The parametersthatHYSYS determinesare agoodstarting point,butthey
may needtobe modifiedonce the simulationisactuallyrun. If the tunerindicatesthatthe valve is
completelyopen,butthe flowisnotreachingthe setpoint,then Cv,the conductance,mayneedtobe
increased. Conductance isameasure of how much flow canpass throughthe valve.Repeatthisstep
withvalve VLV-100.
Dyn-003H Revised:Nov20,2012
5
4.07. If you try to click the Size Valve button for VLV-102, you will be given a message that HYSYS is unable to
size the valve because there is no flow across it. In the Sizing Methods block of the Sizing tab, make
sure the Cv radio button is selected. This valve controls the flow out the bottom of the reactor.
However, the reaction takes place almost entirely in the vapor phase, so only a negligible amount of
liquid flow is expected. Therefore, a small conductance, such as 5, is acceptable. Enter 5 in the Cv entry
of the table.
Dyn-003H Revised:Nov20,2012
6
4.08. Clickon the Dynamic Assistant buttonagain. If youclickon Miscellaneousspecification changes,you
will be broughttothe Othertab. The Dynamics Assistant recommendsthatthe pressure dropover
CRV-100 be setto 0. However,we are settingupa pressure drivensimulation,where flowis
determinedfrompressure differences. Inorderto avoidreverse flows,we willnotremove the pressure
drop fromthe reactor.
Dyn-003H Revised:Nov20,2012
7
4.09. The final entryon the inthe General tab of the Dynamics Assistantindicatesthata volume needstobe
specified. Thisisreferringtothe conversionreactor, CRV-100. Double clickonthe reactor inthe flow
sheet,andmove tothe Rating tab. The Vertical andCylinderradiobuttonsshouldbe selected.
Heuristicsexist thatcandetermine whatvolume isnecessaryfora reactiontotake place. We will use
1080 ft3
.
Dyn-003H Revised:Nov20,2012
8
4.10. The Dynamics Assistant should now only display the Miscellaneous change. We are now ready to move
to Dynamics mode. Click the Dynamics Mode button in the Dynamics tab of the Ribbon, and click No
whenaskedwhetheryouwouldlike toresolveidentifieditemsinneedof attention.
4.11. The controllers are currently set to manual. Double click on H2-TUNE and move to the Parameters
window. Select Auto for Mode, and make sure that SP is set to 310 lbmole/hr. Do the same for BZ-
TUNE, butmake sure SP issetto 100.
Dyn-003H Revised:Nov20,2012
9
4.12. Click on the flowsheet and type Shift+F on the keyboard. This will display the molar flow of every
stream. Click the Run button in the Dynamics tab on the Ribbon, and again choose not to resolve the
items the Dynamics Assistant identified. Allow the simulation to run until the flows have stabilized, then
clickthe Stop buttonnextto the Run button. The flow sheetshouldlookasdisplayedbelow.
Dyn-003H Revised:Nov20,2012
10
4.13. The goal of thissimulationistoobserve the effectthata suddenchangesinthe hydrogenfeedwill have
on the reaction. We will nowconstructa strip chart for thatpurpose. Clickonthe Strip Charts folderin
the Navigation Pane,and click Add to create a stripchart named DataLogger1.
Dyn-003H Revised:Nov20,2012
11
4.14. Double clickon DataLogger1, and thenclick Add to selectthe variablesthatwillbe displayedonthe
chart. Add the Molar Flowand Master Comp Mole Frac (Cyclohexane) forthe FLASH-INstream. Click
the Display buttonto create the plot.
4.15. Rightclickon the black plotareaof DataLogger1 and selectGraphControl. Inthe Axeswindow,check
the Automatic Auto Scale and Show All boxes.
4.16. Move to the Time Axis tab. Clickthe Set-upLogger button,andenter900 in the Logger Size field. This
will cause the loggertokeep 900 points,takenat20 secondintervals,whichtranslatesto 5 hoursof
runtime.
Dyn-003H Revised:Nov20,2012
12
4.17. We will be runningthe followingsequence:
 Run the simulationfor1hour.
 Overthe course of 1 hour, ramp the hydrogenfeedfrom 310 lbmole/hrto 300 lbmole/hour.
 Run the simulationfor1hour.
 Overthe course of 1 hour, ramp the hydrogenfeedupto 320 lbmole/hr.
 Run the simulationof anadditional hour.
4.18. Clickon the Integrator buttoninthe Dynamics tab of the Ribbon.
4.19. The first step in the sequence is to run the simulation for 1 hour. In the End Time field, enter 1 hour (60
minutes). First hit the Reset button in the Dynamics ribbon to reset the integrator, then click Run to run
the simulation.
Dyn-003H Revised:Nov20,2012
13
4.20. DataLogger1 should show constant flow and mole fraction, as shown as shown below. The scale of the
time axiscan be changedby draggingthe red arrow at the bottomof the window.
4.21. The next step is to ramp the hydrogen feed down to 300 lbmole/hr over an hour. Double click on H2-
TUNE and move to the Parameters | Advanced page. In the Set Point Ramping section, click Enable to
enable ramping of the tuner. Change the Target SP to 300 lbmole/hr and Ramp Duration to 1 hour (60
minutes).
Dyn-003H Revised:Nov20,2012
14
4.22. Openthe Integrator windowagain,andchange the End Time to 2 hours. Run the simulation. Right
clickon DataLogger1 and selectGraphControl. Inthe Axestab,uncheckthe Automatic Auto Scale box.
Axis2-Mole Fractionshouldbe selectedinthe listontothe left.UnderScaling,enter.9 forLow Range
Value and .95 for High Range value. Tothe left,selectAxis1-MolarFlow,andenter94 forthe Low
Range and 103 for the High. DataLogger1 shouldnow be easiertoread.
4.23. The simulationmustnowbe runfor 1 hour. Openthe Integrator,and change End Time to 3 hours. Run
the simulation.
Dyn-003H Revised:Nov20,2012
15
4.24. Next,we will Rampupthe hydrogenfeedto 320 lbmole/hroveran hour. Setthe SP of H2-TUNER to
Ramp up to 320 lbmole/hrin 1 hour. Openthe Integrator window,andchange EndTime to 4 hours,
thenRun the simulation. Resizethe axesonDataLogger1 so that youcan observe the full range of
values.
Dyn-003H Revised:Nov20,2012
16
4.25. The simluationneedstorunfor 1 hour. Setthe Integrator to endafter 5 hours. Run the simulationand
resize DataLogger1.
Dyn-003H Revised:Nov20,2012
17
5. Conclusion
You can see that when the hydrogen flowrate decreases, the mole fraction of cyclohexane in the product stream
significantly decreases. This is because there is not enough hydrogen in the feed to convert all the benzene,
which results in unreacted benzene in the product stream. From a business standpoint, this is not good for
several reasons. There is money being lost by throwing away benzene in the product stream, and the product
stream may not even meet composition specifications anymore. This means you will be forced to recycle and
process the product stream which leads to extra costs, or you may be forced to sell the product at a much lower
price than desired. When the flowrate of hydrogen was increased, all the benzene was reacted and excess
hydrogen was being fed into the system. This is the reason for the increased product flowrate and decreased
fraction of cyclohexane when the hydrogen feed increased. The excess hydrogen represents another cost, as
largerequipmentwill be neededtotransport and separate the stream.
6. Copyright
Copyright © 2012 by Aspen Technology, Inc. (“AspenTech”). All rights reserved. This work may not be
reproduced or distributed in any form or by any means without the prior written consent of
AspenTech. ASPENTECH MAKES NO WARRANTY OR REPRESENTATION, EITHER EXPRESSED OR IMPLIED, WITH
Dyn-003H Revised:Nov20,2012
18
RESPECT TO THIS WORK and assumes no liability for any errors or omissions. In no event will AspenTech be
liable to you for damages, including any loss of profits, lost savings, or other incidental or consequential
damages arising out of the use of the information contained in, or the digital files supplied with or for use with,
thiswork. This workand itscontentsare providedforeducational purposesonly.
AspenTech®, aspenONE®, and the Aspen leaf logo, are trademarks of Aspen Technology, Inc.. Brands and
productnamesmentionedinthisdocumentationare trademarksorservice marksof theirrespective companies.
Dyn-004H Revised:Nov14,2012
1
Tank Filling and Draining with Aspen HYSYS® V8.0
1. Lesson Objective:
 To observe the interactionbetweensetpointsandprocessvariablesinadynamicsystem
 To understandbasicsof a dynamicsimulation inAspenHYSYS
2. Prerequisites
 Aspen HYSYS V8.0
 File Dyn-004H_Tank_Start.hsc
3. Background
Dynamic Simulation in Chemical Engineering
Dynamic simulation is an extension of steady-state process simulation whereby time-dependence is built into
the models via derivative terms i.e. accumulation of mass and energy. The advent of dynamic simulation means
that the time-dependent description and control of real processes in real or simulated time are possible. This
includes the description of starting up and shutting down a plant, changes of conditions during a reaction,
holdups, thermal changes, and more. Dynamic simulations require increased calculation time and are
mathematically more complex than steady-state simulations. They can be seen as repeatedly calculated steady-
state simulations (based on a fixed time step) with constantly changing parameters. Dynamic simulation can be
used in both an online and offline fashion. The online case utilizes model predictive control, where the real-time
simulation results are used to predict the changes that would occur for a control input change, and the control
parameters are optimized based on the results. Offline process simulation can be used in the design,
troubleshooting and optimization of process plant as well as the conduction of case studies to assess the
impactsof processmodifications.
The examplespresentedare solelyintendedtoillustrate specificconceptsand principles. Theymay not
reflectan industrial application or real situation.
4. Problem Statement and Solution
Problem Statement
An inletstreamwith the followingspecificationsisfedtoa 3 m3
tank:
 Pressure:3 bar
 Temperature:25 °C
 Mass flowrate:4000 kg/hr
Dyn-004H Revised:Nov14,2012
2
 Composition:80%waterand 20% air
The outletstreamsare dischargedat 1 bar. Using the providedAspen HYSYSfile Dyn-004H_Tank_Start.hsc,
prepare a dynamicsimulation flowsheetandobserve the dynamicresponseof changingthe liquidlevel setpoint
for the tank.
Aspen HYSYS Solution
4.01. Start AspenHYSYS V8.0. OpenDyn-004H_Tank_Start.hsc.
4.02. Before a transition fromsteadystate todynamicoccurs,the simulationflowsheetshouldbe setupso
that a high-to-lowpressure gradientexistsacrossthe flowsheet.The pressuregradientis necessaryas
no pressure gradient meansnoflow. Addthree valvestothe flowsheet andconnectandrename the
streamsas showninthe screenshotbelow.
4.03. Openthe material stream Feedandgo to the Worksheet| Conditions page.Enter25°C for
Temperature, 3 bar_g forPressure,and 4000 kg/h for Mass Flow.
Dyn-004H Revised:Nov14,2012
3
4.04. Go to the Worksheet|Compositionpage.Clickthe Edit buttonand enter0.8, 0.04, and 0.16 for H2O,
Oxygen,and Nitrogen,respectively.Clickthe OKbuttonwhenfinished.
4.05. Go to the Dynamics tab.Confirmthat onlythe Pressure SpecificationisActive inthe Dynamic
Specificationsframe.
Dyn-004H Revised:Nov14,2012
4
4.06. Openthe material stream Airand go to the Dynamics tab. Enter 1 bar_g for Pressure and checkthe
Active checkbox inthe Pressure Specificationframe.
4.07. Openthe material stream Waterand go to the Dynamics tab. Enter1 bar_g forPressure and check the
Active checkbox inthe Pressure Specificationframe.
4.08. Openthe material stream 3 and go to the Dynamics tab. Enter2 bar_g for Pressure anduncheckthe
Active checkbox inthe Pressure Specificationframe.This will solvethe steadystate solutionandaidthe
transitiontodynamics.
Dyn-004H Revised:Nov14,2012
5
4.09. Openthe valve VLV-100 and go to the Dynamics | Specs page.Enter70 forConductance (Cv) and check
the checkbox forPressure FlowRelation.
4.10. Openthe valve VLV-101 and go to the Dynamics | Specs page.Enter50 forConductance (Cv) and check
the checkbox forPressure FlowRelation.
4.11. Openthe valve VLV-102 and go to the Dynamics | Specs page.Enter50 forConductance (Cv) and check
the checkbox forPressure FlowRelation.
4.12. Openthe tank V-100 and go to the Dynamics | Specspage. Enter the Vessel Volume of 3 m3
and 0 %for
LiquidVolume Percent.Clickthe Add/Configure Level Controllerbutton.
Dyn-004H Revised:Nov14,2012
6
4.13. Openthe addedcontrollerLIC-100 andgo to the Connectionstab.Confirmthe processvariable and
controlleroutputare selectedasshowninthe screenshotbelow.
Dyn-004H Revised:Nov14,2012
7
4.14. Go to the Parameters| Configuration page.SelectAutoforMode and enter50% forSP in the
Operational Parameters frame.Change the Kc and Ti to 0.5 and 5 minutesrespectively.Clickthe Face
Plate buttonto viewthe face plate forthe controller.
Dyn-004H Revised:Nov14,2012
8
4.15. Adda new PID Controllerto the flowsheet fromthe Dynamicstab inthe Model Palette.Go to the
Connectionstab of thiscontroller.Clickthe SelectPV buttonandselect FeedandMass Flowfor the
Objectand Variable.
4.16. Clickthe SelectOP buttonand select VLV-100 andActuator DesiredPositionforthe Objectand
Variable.The Connectionstab shouldappearasthe screenshotbelow.
Dyn-004H Revised:Nov14,2012
9
4.17. Go to Parameters | Configuration page. Enter 0 kg/hr and 5000 kg/hr forPV Minimumand PV
Maximum,respectively. SelectReverse forAction,Auto forMode,and enter4000 kg/hr forSP. Change
the Kc andTi to 0.5 and 1.0 minute,respectively.Clickthe Face Plate buttontodisplaythe face plate of
thiscontroller.
Dyn-004H Revised:Nov14,2012
10
4.18. Nowthe flowsheetshouldappearasthe followingscreenshot. FIC-100will allow aconstantflowrate
intothe tank and we will use LIC-100 to control the drainingof the tank.
Dyn-004H Revised:Nov14,2012
11
4.19. Go to the Dynamics tab of the ribbon.Clickthe Dynamics Mode buttonand click Yesto the dialogue.
4.20. From the Dynamics tab of the ribbon,clickthe Integrator button.
4.21. Change the Accelerationto 0.50. This will allow aslowerintegrationinordertoobserve the changesin
the system. Enteran End Time of 90 minutes topause the integrationafter1.5 hours.
Dyn-004H Revised:Nov14,2012
12
4.22. From the Dynamics tab of the ribbon, click the Strip Charts button. In the new window, click Add button.
Then,highlightthe DataLogger1 andclickthe Edit button.
4.23. Clickthe Add buttoninthe DataLogger1 window.Addthe followingvariablestothe stripchart:
 V-100 | LiquidPercent Level
 LIC-100 | SP
4.24. The DataLogger1 windowshouldappearasthe screenshotbelow.Clickthe Displaybuttontodisplaythe
chart.
Dyn-004H Revised:Nov14,2012
13
4.25. The bottom of the stripchart has the logcontrollerbarwhichcontrolsthe time axis.Clickanddrag the
redmarker to the lefttoexpandthe range of display.
4.26. From the Dynamics tab of the ribbon,clickthe Run buttonto initialize the dynamicsystem.
4.27. Whenthe run is complete,the stripchart DataLogger1 shouldlooklike the followingscreenshot. The
controllerLIC-100 reachedthe setpointwith some overshootandoscillation.
Dyn-004H Revised:Nov14,2012
14
4.28. Openthe integrator fromthe Dynamics tab of the ribbon. Change the End time to 180 minutes.
4.29. From the face plate,change the setpointfor LIC-100 to 75 %.The setpointindicatorwill be moved.
Dyn-004H Revised:Nov14,2012
15
4.30. Clickthe Run buttonfrom the Dynamics tab of the ribbon.Whenthe runis complete,the stripchart
shouldlooklike the followingscreenshot.Some overshootandoscillationsare observedandthe offsetis
minimal.
4.31. Openthe Integrator from the Dynamics tab of the ribbon.Change the Endtime to 270 minutes.
4.32. From the face plate,change the setpointfor LIC-100 to 25 %.
4.33. Clickthe Run buttonfrom the Dynamics tab of the ribbon.Whenthe runis complete,the stripchart
shouldlooklike the followingscreenshot. Some overshootandoscillationsare observedandthe offset
isminimal.
Dyn-004H Revised:Nov14,2012
16
5. Conclusion
Withthe tuningparametersusedinthisprocess,the level controllerproducedsome overshootandoscillation
withminimal offset.We observedthe effectof changingthe setpointsonthe processvariables. Inorderto
eliminatethe overshootoroscillationinthe controller,one cantune the controllerparametersfurthervia
several differentmethods. We will investigatethe tuningmethodsin Dyn-005H_ControllerTuning. You should
nowbe familiarwithhowtotake a simple Aspen HYSYSsimulationandconvertittoa HYSYS Dynamics
simulation. InHYSYS Dynamics, youshouldbe familiarwithhow toinitializeasimulation,create customplots,
displayresults,andmake changesinprocessconditions. Changesincontroller setpointsorotherprocess
conditionscanhave large effectsonthe overall processanditisimportantto understandthese effectswhen
designingoroperatingaprocess.
6. Copyright
Copyright © 2012 by Aspen Technology, Inc. (“AspenTech”). All rights reserved. This work may not be
reproduced or distributed in any form or by any means without the prior written consent of
AspenTech. ASPENTECH MAKES NO WARRANTY OR REPRESENTATION, EITHER EXPRESSED OR IMPLIED, WITH
RESPECT TO THIS WORK and assumes no liability for any errors or omissions. In no event will AspenTech be
liable to you for damages, including any loss of profits, lost savings, or other incidental or consequential
damages arising out of the use of the information contained in, or the digital files supplied with or for use with,
thiswork. This workand itscontentsare providedforeducational purposesonly.
Dyn-004H Revised:Nov14,2012
17
AspenTech®, aspenONE®, and the Aspen leaf logo, are trademarks of Aspen Technology, Inc.. Brands and
productnamesmentioned inthisdocumentationare trademarksorservice marksof theirrespective companies.
Dyn-005H Revised:Nov16,2012
1
Controller Parameter Tuning with Aspen HYSYS® V8.0
1. Lesson Objective:
 Use Ziegler-Nichols, Cohen-Coon, and time integral tuning methods to determine the optimal
controllertuningparameters
 To understandbasicsof dynamicsimulation inAspenHYSYS
2. Prerequisites
 Aspen HYSYS V8.0
 File Dyn-005H_Controller_Tuning_Start.hsc
3. Background
There are several methodsfortuningacontroller,includingZiegler-Nichols,Cohen-Coon,andthe ITAEtuning
method.Inthistutorial,we will utilizethesemethodstodeterminethe tuningparametersfora secondorder
system. Most processescanbe well approximatedbyafirstorderresponse withtime delay. Analysisof this
response canthenbe usedto determine tuningparametersforthe process.
A processreactioncurve can be obtainedfromthe controlledprocesswith the controllerdisconnected. From
the processreactioncurve,one can acquire valuesof K,τ, andα, whichallowsapproximationof the process
reactioncurve viaa first-ordersystemwithtime delay:
( )
Giventhis, several tuningmethodscanbe used toobtainapproximate tuningparameters.Inthistutorial,we will
use a PID controller,whichhasthe following tuningrules:
Tuning Method
Ziegler-Nichols
( )
Cohen-Coon ( ) ( ( ))
[
( )
( )
] [
( )
]
ITAE
( )
[ ( )]
( )
Dyn-005H Revised:Nov16,2012
2
The examplespresentedare solely intendedtoillustrate specificconceptsand principles. They may not
reflectan industrial application or real situation.
4. Problem Statement and Solution
Problem Statement
There are twotanksin serieswithwaterflowingintoandoutof each tank.There are twowaterstreamsbeing
fedintothe firsttank,a hotwater streamanda coldwaterstream. We wouldlike tocontrol the temperature of
the secondtank byvaryingthe flowrate of the hotand cold streamsflowingintothe firsttank. Thissetupis
shownbelow.
In thisflowsheetwe have several controllers. Eachtank has a controllertokeep itsliquidlevelconstant. The
coldwater streamhasa controllerthatmaintainsa constantcombinedwaterstreamflowrate. So,if the hot
watervalve opens,the coldwatervalve will closeaccordingly. We have installedacontrollerattachedtothe
hot watervalve thatwe wishto use to control the temperature of the secondtank. Inthislessonwe will
determine the tuningparametersforthiscontroller.
In orderto determine the tuningparametersforthe temperaturecontroller,we mustfirstobtainaprocess
reactioncurve. We have disconnectedthe controllerfromthe valve andimplementeda15% increase inthe
valve opening. We have recordedthe resultingresponse inthe temperature of the secondtank. Thisplotis
shownbelow.
Dyn-005H Revised:Nov16,2012
3
A tangentline canbe drawn at the inflextionpointonthe curve and the valuesforthe keyparamterscan be
estimatedfromthe graph:

 α =20 seconds = 0.33 minutes
 τ = 200 seconds = 3.33 minutes
0
2
4
6
8
10
12
14
16
0 100 200 300 400 500 600
VesselTemperature%Change
Time (seconds)
0
2
4
6
8
10
12
14
16
0 100 200 300 400 500 600
VesselTemperature%Change
Time (seconds)
Dyn-005H Revised:Nov16,2012
4
Usingthe Zieglar-NicholsPIDtuningrules we canobtainthe followingtuningparameters:
( )
( )
( )
Usingthe Cohen-CoonPIDtuningruleswe canobtainthe followingtuningparameters:
( )( ( ))
[
( )
( )
]
[
( )
]
Usingthe MinimumITAEPID tuningruleswe canobtainthe followingtuning parameters:
( )
[ ( )]
( ) ( )
We can thenuse a simulatorsuchas AspenHYSYS to model the processanddeterminethe optimal tuning
parametersforthissystem.
Aspen HYSYS Solution
4.01. Start AspenHYSYS V8.0. OpenDyn-005_Controller_Tuning_Start.hsc.
4.02. On the face plate for the temperature controller(TIC-100),selectAutotoactivate the controller.
Dyn-005H Revised:Nov16,2012
5
4.03. In the Dynamics tab in the ribbon,clickthe StripCharts button. Thiswill openthe StripChartwindow.
ClickDisplay.
4.04. The DataLogger1 windowwillappear. Close the StripChartwindow.
Dyn-005H Revised:Nov16,2012
6
4.05. Clickthe Run buttonfrom the Dynamic tab of the ribbon.
4.06. You will see twolinesonthe stripchart. The blue line isthe controllersetpointandthe purple line is
the vessel temperature. Youshouldnotice immediatelythatthere isanoffsetbetweenthe setpoint
and the actual value. Thisisbecause the controlleriscurrentlyonlyactingasa proportional controller.
If you clickthe Tuning buttonon the temperature controlleryouwill seethe tuningparameters.
Dyn-005H Revised:Nov16,2012
7
4.07. Change the setpoint(SP) for the temperature controllerto 60°C.
Dyn-005H Revised:Nov16,2012
8
4.08. You shouldsee the followingresponseonthe stripchart. Notice thatthere are oscillationsanda
significantsteadystate offset.
Dyn-005H Revised:Nov16,2012
9
4.09. Change the setpoint(SP) to 75°C. The response shouldlooklikethe following.
Dyn-005H Revised:Nov16,2012
10
4.10. Clickthe Stop buttonin the Dynamics tab of the ribbon.
4.11. We will nowenterthe tuningparametersthatwe calculatedusingthe Ziegler-Nicholstuningrules. Click
the Tuning buttonon the temperature control face plate. Enterthe new tuningparametersasshown
below.
Dyn-005H Revised:Nov16,2012
11
4.12. Change the setpoint(SP) to 65°C and clickthe Run buttonin the ribbon. The response shouldlooklike
the stripchart shownbelow. Youcan see thatthe new tuningparametershave eliminatedthe steady
state offset,howeverwe still have significantoscillations. The Ziegler-Nicholstuningmethodoftenleads
to veryaggressive parameters,whichwouldexplainthe large overshootseeninthe response.
4.13. Change the tuningparameterstothe valuescalculatedusingthe Cohen-Coontuningmethod.
Dyn-005H Revised:Nov16,2012
12
4.14. Run the dynamicsimulationagain. Startingfrom 75°C, change the set pointto 65°C. The response
shouldlooklike the stripchartbelow. These tuningparametersare alsoquite aggressive andleadtoa
large overshootof the setpoint.
Dyn-005H Revised:Nov16,2012
13
4.15. Lastly,change the tuningparameterstothe valuescalculatedusingthe ITAEmethod. Note thatthese
particularcorrelationsforthe tuningparametersare designedforaset-pointresponse andare meantto
be lessaggressive than othermethods.
Dyn-005H Revised:Nov16,2012
14
4.16. Run the simulationindynamicmode andmake asetpointchange to 65°C startingfrom a temperature
of 75°C. The response shouldlooklike the stripchartbelow. Youcan see thatwiththese parameters
the tank reachesthe setpointveryquicklywithlittleovershootandoscillations.
Dyn-005H Revised:Nov16,2012
15
5. Conclusion
In thislessonwe learnedhowtodetermine tuningparametersusing three differentmethods. UsingAspen
HYSYS we couldobserve howthe systemrespondstodifferenttuningparametersandcontrollerstepchanges.
Tuningparametersfoundfromthe methodsusedinthislessonare oftenastartingpointwhichisfollowedby
manual tuning. Manual tuningallowsthe operatortomodifythe tuningparametersasisneeded,butoften
requiresexperience toknowhowtomanipulate the controllercorrectly. AspenHYSYSallowsusersto
manipulate tuningparameterstoobserve how the systemrespondstochanges.
6. Copyright
Copyright © 2012 by Aspen Technology, Inc. (“AspenTech”). All rights reserved. This work may not be
reproduced or distributed in any form or by any means without the prior written consent of
AspenTech. ASPENTECH MAKES NO WARRANTY OR REPRESENTATION, EITHER EXPRESSED OR IMPLIED, WITH
RESPECT TO THIS WORK and assumes no liability for any errors or omissions. In no event will AspenTech be
liable to you for damages, including any loss of profits, lost savings, or other incidental or consequential
damages arising out of the use of the information contained in, or the digital files supplied with or for use with,
thiswork. This workand itscontentsare providedforeducational purposesonly.
Dyn-005H Revised:Nov16,2012
16
AspenTech®, aspenONE®, and the Aspen leaf logo, are trademarks of Aspen Technology, Inc.. Brands and
productnamesmentionedinthisdocumentationare trademarksorservice marksof theirrespective companies.
Dyn-006H Revised:Nov 28,2012
1
Depressuring with Aspen HYSYS® V8.0
1. Lesson Objective:
 To construct a simple case usingthe Depressuring Analysis inAspenHYSYS.
2. Prerequisites
 Aspen HYSYS V8.0
3. Background
Any process dealing with gasses has the potential for unsafe pressure buildup. This can happen because of
instrument failure, loss of power, or an unforeseen heat source such as a fire. If pressure does build up, there
must be a depressuring system in place to depressurize in a safe manner. The pressure is bled through a valve
until it reaches a safe level. The excess gas can also be sent to a pressure vessel, but these vessels are also
equipped with valves to prevent overpressure. Gas blowdown valves are common in oil wells. When the wells
are not in use, the pressure can build up. A blowdown valve vents the excess gas to a flare, where the
hydrocarbonscan be burnedbefore beingreleasedintothe atmosphere.
The examplespresentedare solelyintendedtoillustrate specificconceptsand principles. Theymay not
reflectan industrial application or real situation.
4. Problem Statement and Solution
Problem Statement
A nitrogenstreamthathas builtupan excesspressure
 Pressure:2161 psia
 Temperature:62.6 °F
 Molar flowrate:2.205 lbmole/hr
Use the AspenHYSYS DepressuringUtilityto determine the behaviorof the gas ina depressuringprocessthat
takes100 seconds. Assume anadiabaticcase withnoexternal heatsource.
Dyn-006H Revised:Nov 28,2012
2
Aspen HYSYS Solution
4.01. Start AspenHYSYS V8.0. Opena Newcase.
4.02. The ComponentLists windowwill be displayed. ClickAddtocreate ComponentList-1 and add Nitrogen
to the list.
4.03. Clickthe FluidPackages folderinthe NavigationPane,thenclick Add to create Basis-1. Selectthe
Peng-Robinsonpropertypackage.
Dyn-006H Revised:Nov 28,2012
3
4.04. Move to the simulation environmentbyclickingon the Simulationbuttoninthe bottomrightcorner of
the screen.
4.05. Inserta Material Stream fromthe Model Palette.
4.06. Double clickonthe stream.In the Worksheettab,entera Temperature of 62.6° F, a Pressure of 2161
psia, anda Molar Flowof 2.205 lbmole/hr. If necessary,change the UnitSet to Fieldinorderto match
the unitsbeingused. Inthe Worksheet| Compositionframe,enteraMole Frac of 1 for Nitrogen.
4.07. In the Home tab of the Ribbon,clickon Analysis| Depressuring.
Dyn-006H Revised:Nov 28,2012
4
4.08. ClickAdd to create Depressuring-Dynamics-1,thenclick Editto enterinvaluesforthe Depressuring
utility.
4.09. Selectstream1 for Inlets. HYSYS will automaticallysize the vessel. However,we will choose different
values. Make sure the Vertical radiobuttonisselectedunder VesselParameters,thendelete the entry
for Flat End Vessel Volume. Entera Heightof 5 ft and a Diameter of 0.8957 ft,and the rest of the
valuesshouldbe calculated. The page shouldresemble the image below.
Dyn-006H Revised:Nov 28,2012
5
4.10. ClickHeat Flux in the leftside of the window,andchange the AmbientTemperature to62.33° F under
Heat Loss Parameters.
Dyn-006H Revised:Nov 28,2012
6
4.11. Notice that Unknown Vessel Metal Thickness is displayed in the status bar at the bottom of the window.
To addressthis,selectthe Conductionradiobutton. Inthe table under Metal,entera Thicknessof
0.9843 inches. Also,underinsulationentera Thicknessof 0 inches.
Dyn-006H Revised:Nov 28,2012
7
4.12. Click on Valve Parameters on the left side of the window. Change the Vapour Flow Equation to General,
thenendera Cd of 0.7 and an Area of 4.907e-2 in2
. A Cd that is lessthan1 signifiesthatthe effective
orifice flowareaislessthanthe physical area,whichisa commonoccurrence.
4.13. Clickon OperatingConditions inthe leftside of the window. UnderOperatingParameters,change the
Time StepSize to 0.05 secondsand the DepressuringTime to 100 seconds.
Dyn-006H Revised:Nov 28,2012
8
4.14. The Depressuringutilityshouldbe readytocalculate. Move tothe Performance tab andselectStrip
Charts on the leftside of the window. There isapremade chart named Depressuring-Dynamics-1-DL.
However,thischarthas over20 variables,andwill be difficulttoread. We will create a new plotthat
onlycontainsthe mostrelevantinformation. Clickonthe Create Plot buttonto create DataLogger1,
thenclick Add Variable… to selectthe variablesforthe plot.
4.15. We are onlyconcernedwiththe vapourflow,aswe downnot anticipate anyliquid. Depressuring-
Dynamics-1 shouldbe selected underFlowsheet. Underthe Objectcolumn,select Vapour@TPL1 and
Mass Flow underVariable. Alsoadd Vapour@TPL1, Pressure andVapour@TPL1, Temperature.
Dyn-006H Revised:Nov 28,2012
9
4.16. In the Performance tab, change the SamplingInterval of DataLogger1 to 0.05 seconds,thenclick View
Strip Chart….
Dyn-006H Revised:Nov 28,2012
10
4.17. ClickDisplayin the DataLogger1 window todisplaythe plot. Rightclick on the plotand select Graph
Control. Inthe Axestab,check the boxesmarked AutomaticAuto Scale inthe Auto Scale sectionand
Show All in the AxisDisplay section.
4.18. Move to the Time Axis tab,and clickon Set-upLogger. Change the Logger Size to 2003, and make sure
the Sample Interval is 0.05 seconds.
4.19. We are now readyto run the simulation.Close the StripChart Configuration window andreturntothe
Depressuring-Dynamics-1window. The sub-flowsheetwill runindynamicsuntil the depressuringtime
iscomplete,andthenthe systemwill returntosteadystate. Clickthe Runbuttonat the bottomof the
Depressuring-Dynamics-1window,andwaitforthe simulationtocomplete.
Dyn-006H Revised:Nov 28,2012
11
4.20. View DataLogger1 to see howthe Vapour Mass Flow,Pressure,and Temperature behaved. The Time
Axiscan be adjustedbyusingthe redtriangle atthe bottomof the chart.
4.21. Additional informationcanbe foundinthe Summary page of the Performance tab.
4.22. In the Main Flowsheet,doubleclickon Depressuring-Dynamics-1(Flowsheet), andclickthe Sub-
FlowsheetEnvironment… button. Thiswill enterthe depressuringsub-flowsheet.
Dyn-006H Revised:Nov 28,2012
12
4.23. The sub-flowsheetcontainsinformationforthe vessel,aswell asspreadsheetsthatcanexportdata.
Dyn-006H Revised:Nov 28,2012
13
5. Conclusion
In thislessonwe examinedabasiccase of an adiabaticdepressuring. The adiabaticcase describesasystemsuch
as an oil well where excesspressure hasbuiltupbutthere isnoexternal heat.Pressure buildupcanalsobe the
resultof an accidentsuchas a fire. Inthiscase, the OperatingMode can be changedto Fire Mode,whichallows
youto specifyaheat flux. The Use Spreadsheetoptionisalsoavailable,whichallowsausertoeditthe duty
spreadsheetwithoutthe valuesbeingoverwrittenwhenthe utilityruns. Depressuringisimportant inassuring
the safetyof a process.
6. Copyright
Copyright © 2012 by Aspen Technology, Inc. (“AspenTech”). All rights reserved. This work may not be
reproduced or distributed in any form or by any means without the prior written consent of
AspenTech. ASPENTECH MAKES NO WARRANTY OR REPRESENTATION, EITHER EXPRESSED OR IMPLIED, WITH
RESPECT TO THIS WORK and assumes no liability for any errors or omissions. In no event will AspenTech be
liable to you for damages, including any loss of profits, lost savings, or other incidental or consequential
damages arising out of the use of the information contained in, or the digital files supplied with or for use with,
thiswork. This workand itscontentsare providedforeducational purposesonly.
Dyn-006H Revised:Nov 28,2012
14
AspenTech®, aspenONE®, and the Aspen leaf logo, are trademarks of Aspen Technology, Inc.. Brands and
productnamesmentioned inthisdocumentationare trademarksorservice marksof theirrespective companies.
Chemical Engineering Plant Design
Design-001H Revised:Nov7,2012
1
Ammonia Synthesis with Aspen HYSYS® V8.0
Part 1 Open Loop Simulation of Ammonia Synthesis
1. Lesson Objectives
 Become comfortable andfamiliarwiththe Aspen HYSYSgraphical userinterface
 Explore Aspen HYSYSflowsheethandlingtechniques
 Understandthe basicinputrequiredtorunan Aspen HYSYSsimulation
 Determinationof Physical Propertiesmethod forAmmoniaSynthesis
 Applyacquiredskill tobuildan openloopAmmoniaSynthesisprocess simulation
 Enter the minimuminputrequiredforansimplifiedAmmoniaSynthesismodel
 Examine the openloopsimulationresults
2. Prerequisites
 Aspen HYSYS V8.0
3. Background
Ammoniaisone of the most highlyproducedchemicalsinthe worldandismostlyused infertilizers. In1913
FritzHaber and Carl Bosch developedaprocessforthe manufacture of ammoniaonan industrial scale (Haber-
Bosch process). Thisprocessisknownforextremelyhighpressureswhichare requiredtomaintainareasonable
equilibriumconstant. Today,thisprocessproduces500 milliontonsof nitrogenfertilizerperyearandis
responsible forsustainingone-thirdof the Earth’spopulation.
Ammoniaisproducedbyreactingnitrogenfromairwithhydrogen. Hydrogenisusuallyobtainedfromsteam
reformationof methane,andnitrogenisobtainedfromdeoxygenatedair. The chemical reactionisshown
below:
Our goal is to produce a simulationforthe productionof ammoniausingAspen HYSYS. We will create avery
simplified versionof thisprocessinordertolearnthe basicsof how to create a flowsheetinthe Aspen HYSYS
V8.0 userinterface. A diagramfor thisprocessisshownbelow.
Design-001H Revised:Nov7,2012
2
Knowledge Base: Physical Properties for Ammonia Process
Equation-of-state modelsprovide anaccurate descriptionof the thermodynamicpropertiesof the high-
temperature,high-pressureconditionsencounteredinammoniaplants. The Peng-Robinsonequationof state
was chosenforthisapplication.
The examplespresentedare solelyintendedtoillustrate specificconceptsand principles. Theymay not
reflectan industrial application or real situation.
Design-001H Revised:Nov7,2012
3
4. Aspen HYSYS Solution
Build a Process Simulation for Ammonia Synthesis
4.01. Start AspenHYSYS V8.0. SelectNewon the Start Page to create a new simulation.
4.02. Create a componentlist. Inthe ComponentLists folder,selectAdd.Addthe followingcomponentsto
the componentlist.
4.03. Create a fluidpackage. Inthe FluidPackages folder,selectAdd. Selectthe Peng-Robinsonproperty
package.
4.04. Define reactions. Goto the Reactions folder,andclick Add. Thiswill create anew reactionsetcalled
Set-1. InSet-1, selectAddReaction andselectHysys,Conversion.Thiswill create anew reactioncalled
Rxn-1.
Design-001H Revised:Nov7,2012
4
4.05. Double clickon Rxn-1 to openthe Rxn-1window. Enterthe followinginformation. Close thiswindow
whencomplete.
4.06. In Set-1,we must nowattach the reactionsetto a fluidpackage. Clickthe Add to FP buttonandselect
Basis-1. The reactionset shouldnow be ready.
Design-001H Revised:Nov7,2012
5
4.07. Go to the simulationenvironment. Clickonthe Simulationbutton inthe bottom leftof the screen.Then
findthe FlowsheetMaintab. The FlowsheetMainisthe mainsimulationflowsheetwhere youwill
create a simulation.
4.08. From the Model Palette,adda Compressor to the mainflowsheet.
Design-001H Revised:Nov7,2012
6
4.09. Double clickthe compressor(K-100) to openthe propertywindow. Create an Inletstreamcalled
SynGas,an Outlet streamcalled S2,and an Energy streamcalled Q-Comp1.
Design-001H Revised:Nov7,2012
7
4.10. We mustdefine ourSynGasfeedstream. In K-100, go to the Worksheettab. For the stream SynGas,
entera Temperature of 280°C, a Pressure of 25.5 bar_g, anda Molar Flowof 7000 kgmole/h. In the
Compositionformenterthe followingmole fractions. StreamSynGasshouldnow solve.
4.11. Specifythe compressoroutletpressure. Inthe Worksheettabof K-100, entera Pressure of 274 bar_g
for streamS2. The compressorshouldnow solve.
Design-001H Revised:Nov7,2012
8
4.12. The flowsheetshouldlooklike the following.
4.13. Next,we will addamixer. Adda Mixerto the flowsheetfromthe Model Palette.
Design-001H Revised:Nov7,2012
9
4.14. Double clickonthe mixer(MIX-100) to openthe mixerwindow. Selectstream S2as the Inletand create
an Outletstreamcalled S3. The mixershouldsolve. We will eventuallyuse thismixertoconnecta
recycle streamto the process.
Design-001H Revised:Nov7,2012
10
4.15. Next,adda heaterto the flowsheet.
4.16. Double clickonthe heater(E-100) to openthe heaterwindow. SelectS3 as the Inletstream, create an
Outletstreamcalled S4, and create an Energy streamcalled Q-Heater. In the Parameters formin the
Designtab, entera Delta P of 0. In the Worksheettab,specifyanoutlet Temperature of 775 K
(481.9°C). Note thatthisheateriscurrentlyactingas a cooler,butonce we connectthe recycle stream
thisblockwill infactadd heatand raise the temperature of the stream.
Design-001H Revised:Nov7,2012
11
4.17. Next,we will addareactor to the flowsheet. Thisprocessusesplugflow reactorstoaccomplish
synthesisreaction,butforthissimplifiedsimulationwe willuse aconversionreactor. Touse a plugflow
reactor,we wouldneedtohave detailedkineticsdescribingthe reaction. Press F12to openthe UnitOps
window. Selectthe Reactorsradiobuttonand select ConversionReactor. Click Add.
Design-001H Revised:Nov7,2012
12
4.18. AfterclickingAdd,the conversionreactorwindow will open. Selectan Inletstreamof S4 and create a
Vapour Outletstream of S5V, a Liquid Outletstreamof S5L, and an Energy streamcalledQ-Reac.
4.19. In the conversionreactorwindow(CRV-100),gotothe Reactionstab. SelectSet-1for Reaction Set. In
the Worksheettab enteranoutlet Temperature of 481.9°C for streamS5L. Thisvalue will copyoverto
S5V. The reactor shouldthen solve. Notice thatthe contentsof the reactorare entirelyvapor;
therefore the liquidoutletstreamhasa flowrate of zero.
Design-001H Revised:Nov7,2012
13
4.20. The flowsheetshouldnowlooklikethe following.
4.21. We will nowadda coolerto cool the vapor streamleavingthe reactor.
Design-001H Revised:Nov7,2012
14
4.22. Double clickthe cooler(E-101) toopenthe coolerwindow. Selectstream S5Vas the Inletstream,
create an Outlet streamcalled S6,and create an Energy streamcalled Q-Cooler.
Design-001H Revised:Nov7,2012
15
4.23. In the Parameters formunderthe Designtab, entera Delta P of 100 bar. We wantto lowerthe
pressure inorderto allowaneasierseparationof ammonia. Inthe Worksheettab,specifyanoutlet
streamTemperature of 300 K (26.85°C). The coolershouldsolve.
Design-001H Revised:Nov7,2012
16
4.24. Adda separatorblockto the flowsheet.
4.25. Double click onthe separator(V-100). Selectan Inletstream of S6, create a Vapour OutletcalledS7,
and create a Liquid OutletcalledNH3. The separatorshouldsolve.
Design-001H Revised:Nov7,2012
17
4.26. The flowsheetshouldnowlooklikethe following.
4.27. Reviewsimulationresults. Double clickstream NH3. Inthe Conditionsformunderthe Worksheettab
youcan viewthe streamflowrate andconditions. Inthe Compositionformyoucan view the stream
composition. Here youcansee that the mole fractionof ammonia isequal to 0.9754.
Design-001H Revised:Nov7,2012
18
4.28. Aftercompletingthissimulation,youshouldsave the fileasa .hscfile. Itis alsogoodpractice to save
periodicallyasyoucreate a simulationsoyoudonot risklosinganywork. The openloopsimulationis
nowready to add a recycle stream,whichwe will thencall aclosedloopsimulation. See module Design-
002H for the closedloopdesign.
5. Copyright
Copyright © 2012 by Aspen Technology, Inc. (“AspenTech”). All rights reserved. This work may not be
reproduced or distributed in any form or by any means without the prior written consent of
AspenTech. ASPENTECH MAKES NO WARRANTY OR REPRESENTATION, EITHER EXPRESSED OR IMPLIED, WITH
RESPECT TO THIS WORK and assumes no liability for any errors or omissions. In no event will AspenTech be
liable to you for damages, including any loss of profits, lost savings, or other incidental or consequential
damages arising out of the use of the information contained in, or the digital files supplied with or for use with,
thiswork. This workand itscontentsare providedforeducational purposesonly.
AspenTech®, aspenONE®, and the Aspen leaf logo, are trademarks of Aspen Technology, Inc.. Brands and
productnamesmentioned inthisdocumentationare trademarksorservice marksof theirrespective companies.
Design-002H Revised:Nov7,2012
1
Ammonia Synthesis with Aspen HYSYS® V8.0
Part 2 Closed Loop Simulation of Ammonia Synthesis
1. Lesson Objectives
 Builduponthe openloopAmmoniaSynthesisprocesssimulation
 Inserta purge stream
 Learn howto close recycle loops
 Explore closedloop convergence methods
 Optimize processoperatingconditionstomaximize productcompositionandflowrate
 Learn howto utilize the modelanalysistoolsbuiltintoAspenHYSYS
 Findthe optimal purge fractiontomeetdesiredproductspecifications
 Determine the effectonproductcompositionof adecrease incoolingefficiencyof the pre-flash
coolingunit
2. Prerequisites
 Aspen HYSYS V8.0
 Design-001Module (Part1 of thisseries)
3. Background; Recap of Ammonia Process
Design-002H Revised:Nov7,2012
2
The examplespresentedare solelyintendedto illustrate specificconceptsand principles. Theymay not
reflectan industrial application or real situation.
4. Aspen HYSYS Solution:
In Part 1 of thisseries (Design-001H),the followingflowsheet wasdevelopedforanopenloopAmmonia
Synthesisprocess.
This process produces two outlet streams; a liquid stream containing the ammonia product and a vapor stream
containing mostly unreacted hydrogen and nitrogen. It is desired to capture and recycle these unreacted
materialstominimize costsandmaximize productyield.
Add Recycle Loop to Ammonia Synthesis Process
Beginning with the open loop flowsheet constructed in Part 1 of this series, a recycle loop will be constructed to
recoverunreactedhydrogenandnitrogencontainedinthe vaporstreamnamed S7,shownbelow.
4.01. The firststepwill be to adda tee to separate the vaporstreamS7 intotwostreams;a purge streamand
a recycle stream. As a rule of thumb,wheneverarecycle streamexists, there mustbe anassociated
purge streamto create an exitroute forimpuritiesorbyproductscontainedinthe process. Oftentimes
if an exitroute doesnotexist,impuritieswillbuildupinthe processandthe simulationwill fail to
converge due toa massbalance error.
Design-002H Revised:Nov7,2012
3
4.02. On the mainflowsheetadda Tee block fromthe Model Palette.The tee blockwill fractionallysplita
streamintoseveral streamsaccordingtouserspecifications. Note thatyoucan rotate the tee usingthe
Rotate buttonon the Flowsheet/Modifytabof the ribbon.
4.03. Double clickthe tee (TEE-100) to openthe propertywindow. Select S7as the Inletstreamand create
twoOutlet streamscalled Rec1and Purge.
Design-002H Revised:Nov7,2012
4
4.04. In the Parameters formunderthe Designtab, entera value of 0.01 for the Flow Ratio of the purge
stream.Thismeansthat 1% of the S7 streamwill be divergedtothe purge stream. The tee shouldsolve.
Design-002H Revised:Nov7,2012
5
4.05. In orderto recycle stream Rec1 back to the mixer,we mustadda Recycle blockto the flowsheet. The
recycle blockisa theoretical blockwhichactstocompare andmodifythe valuesof the outletstream
until the inletandoutletstreamsare equal toa specifiedtolerance.
4.06. Double clickthe recycle block(RCY-1). SelectRec1as the Inletstreamand create an Outletstream
calledRec2. The flowsheetshouldnow looklike the following.
Design-002H Revised:Nov7,2012
6
4.07. We needtoadd a compressorto raise the pressure of the recycle streambefore we canconnectitback
to the mixer. Adda Compressorto the flowsheet. Select Rec2as the Inletstream, create an Oulet
streamcalled Rec3, andcreate an Energy streamcalled Q-Comp2. Specifyanoutletstream Pressure of
274 bar_g inthe Worksheettab. The compressorshouldsolve andthe flowsheetshouldlook likethe
following.
4.08. The recycle streamisnow readyto be connectedbackto the mixerblockto close the loop. Double click
on the mixer(MIX-100) to openthe propertywindow. Addstream Rec3to the Inletstreams.The
flowsheetshouldsolve.
Design-002H Revised:Nov7,2012
7
4.09. Checkresults. Double clickonstream NH3. In the Compositionformunderthe Worksheettabyoucan
see that the mole fractionof ammoniaisnow 0.9581. This isbelow ourdesiredmole fractionof 0.96.
Optimize the Purge Rate to Deliver Desired Product
4.10. We nowwishdeterminethe purge rate requiredtodelivera productwitha mole fractionof 0.96
ammonia. Addan adjustblockto the flowsheet.
Design-002H Revised:Nov7,2012
8
4.11. Double clickthe adjustblock(ADJ-1) to openthe adjustwindow. We mustdefine ouradjustedand
targetedvariables. Forthe AdjustedVariable selectFlowRatio_2 of objectTEE-100. To do this,click
the SelectVar… buttonand selectthe followingoptions. Whenfinishedselect OK.
Design-002H Revised:Nov7,2012
9
4.12. Next,selectthe targetedvariable. Choose MasterCompMole Frac of Ammonia instreamNH3. Thisis
shownbelow. Whenfinishedclick OK.
Design-002H Revised:Nov7,2012
10
4.13. Next,we will specifythe targetof 0.96 forthe Mole Fraction of Ammonia inthe productstream. The
adjustwindowshouldnowlooklikethe following.
4.14. Go to the Parameterstab and entera Step Size of 0.001, and a MaximumIterations of 1000. ClickStart
to begincalculations. The adjustblockshouldsolve. Goto the Monitor tab to view results. Youcansee
that the mole fractionof ammoniainthe product streamreached0.96 at a purge fractionof 0.019.
Design-002H Revised:Nov7,2012
11
Design-002H Revised:Nov7,2012
12
4.15. The flowsheetshouldnowlooklikethe following.
Investigate the Effect of Flash Feed Temperature on Product Composition
4.16. We wouldnowlike todetermine how fluctuationsinflashfeedtemperature will affectthe product
composition.Changesincoolingefficiencyorutilityfluidtemperature canchange the temperature of
the flashfeedstream.Thischange intemperature will change the vaporfractionof the stream,thus
changingthe compositionof the productandrecycle streams. First,we needtodeactivate the adjust
block. Double clickthe adjustblockandcheck Ignored.
4.17. In the navigationpane goto Case Studiesand click Add.
4.18. A newcase studycalled Case Study 1 will be created. In Case Study 1 clickAdd to add variablestothe
study. Firstwe will selectthe Mole Fractionof Ammonia inthe productstream NH3.
Design-002H Revised:Nov7,2012
13
4.19. Next,we will addthe Temperature of streamS6.
Design-002H Revised:Nov7,2012
14
4.20. We will varythe Temperature of streamS6 from25°C to 100°C witha Step Size of 5°C.
4.21. Clickthe Run button,and thengo to the Plotstab to view the results.
4.22. You will see thatastemperature increases, the ammoniamole fraction decreaseswhichmeansthat
whenoperatingthisprocessitwill be veryimportanttomonitorthe flashfeedtemperature inorderto
deliverhighqualityproduct.
Design-002H Revised:Nov7,2012
15
5. Conclusion
This simulation has proved the feasibility of this design by solving the mass and energy balances. It is now ready
to begin to analyze this process for its economic feasibility. See module Design-003H to being the economic
analysis.
6. Copyright
Copyright © 2012 by Aspen Technology, Inc. (“AspenTech”). All rights reserved. This work may not be
reproduced or distributed in any form or by any means without the prior written consent of
AspenTech. ASPENTECH MAKES NO WARRANTY OR REPRESENTATION, EITHER EXPRESSED OR IMPLIED, WITH
RESPECT TO THIS WORK and assumes no liability for any errors or omissions. In no event will AspenTech be
liable to you for damages, including any loss of profits, lost savings, or other incidental or consequential
damages arising out of the use of the information contained in, or the digital files supplied with or for use with,
thiswork. This workand itscontentsare providedforeducational purposesonly.
AspenTech®, aspenONE®, and the Aspen leaf logo, are trademarks of Aspen Technology, Inc.. Brands and
productnamesmentioned inthisdocumentationare trademarksorservice marksof theirrespective companies.
Design-003H Revised:Nov7,2012
1
Ammonia Synthesis with Aspen HYSYS® V8.0
Part 3 Process Economic Analysis
1. Lesson Objectives
 Acquire basicknowledge onthe evaluationof the economicsof achemical process
 Builduponthe closedloopAmmoniaSynthesisprocesssimulation
 Addprocessstream pricesinfeedandproducts
 Addutilitycostsinthe equipment
 Learn howto perform economicevaluation withinAspen HYSYS.
 Transformsimplifiedprocessintoamore realisticdesign
 EconomicAnalysis of followings:
 Capital Cost
 OperatingCost
 Raw MaterialsCost
 ProductSales and UtilitiesCost
 Estimationof ‘PayOff’period
2. Prerequisites
 Aspen HYSYS V8.0
 MicrosoftExcel
 CompleteddesignmodulesDesign-001Hand Design-002H
Design-003H Revised:Nov7,2012
2
3. Background, Recap of Ammonia Process
The examplespresentedare solelyintended toillustrate specificconceptsand principles. Theymay not
reflectan industrial application or real situation.
4. Brief Introduction to Process Economic Analysis
During the conceptual design phase 80% of capital costs are determined and 95% of your operating costs are
determined at this phase. Operating costs are typically 2-3 times the amount of capital costs. Decisions made
during the conceptual design process have a major impact on the final project – so it is important to make the
right decisions based on rigorous cost estimates instead of guesswork. The typical workflow of the cost
estimationprocessisshownbelow.
Design-003H Revised:Nov7,2012
3
Typical Workflow of Cost Estimation
5. Aspen HYSYS Solution
The followingflowsheetwasdevelopedfora closed loopAmmoniaSynthesisprocess.
5.01. Openthe solution.hscfile forthe closedloopAmmoniaSynthesis.
(Design_002_AmmoniaSynthesis_ClosedLoop.hsc)
Design-003H Revised:Nov7,2012
4
5.02. The final stepof Design_002 was to run a Case Study. This alteredthe Temperature of streamS6, and
thuschangedthe purityof stream NH3. Double clickonstream S6. In the Worksheet| Conditions page,
change the Temperature back to 26.85°C.
5.03. Next,double clickon TEE-100 and set the FlowRatio of Purge to .019. We are now readyto evaluate
cost.
5.04. Firstwe will enterthe buyingandsellingpricesof ourfeedandproductstreamsinorderto determine if
our processiscapable of makingmoney. Double clickthe SynGasfeedstreamandgo to the Cost
Parameters formunderthe Worksheettab.SelectMassFlow for FlowBasis and enter0.26 Cost/kg for
Cost Factor.
Design-003H Revised:Nov7,2012
5
5.05. Next,double clickthe productstream NH3. Inthe Cost Parameters form,selectMassFlow forFlow
Basis and enter500 Cost/ton for Cost Factor.
Design-003H Revised:Nov7,2012
6
5.06. To viewthe total stream costs,go to the Economics tab in the ribbonandselect Stream Price.
5.07. Thiswill openupthe Model Summary Grid.Here youcan view the total cost foreach material stream.
SynGas hasa total cost of $15,941/hr, while the productstream NH3 has a value of $28,794.7/hr. In
thiscase the productstreamis roughlytwice asvaluable asthe feedstream.Thisisa goodsignand
indicates thatthisprocess maybe profitable.
Design-003H Revised:Nov7,2012
7
5.08. Nextwe will estimate costsfor utilities. Double clickonenergystream Q-Comp1. SelectPowerfor
UtilityType.
Design-003H Revised:Nov7,2012
8
5.09. Double clickonenergystream Q-Comp2and selectPowerforUtilityType.
5.10. Double clickonenergystream Q-Heaterand selectFiredHeat(1000) forUtilityType.
Design-003H Revised:Nov7,2012
9
5.11. Double click energystreamQ-CoolerandselectCoolingWaterforUtilityType.
5.12. Double click Q-Reacand selectCoolingWaterforUtilityType.
Design-003H Revised:Nov7,2012
10
5.13. To viewthe utilitysummary,click FlowsheetSummaryinthe Home tab of the ribbon.
5.14. The FlowsheetSummary windowwill appear. Goto the UtilitySummary tab. Here youcan viewthe
cost of each utilityandthe total costs of utilities. The Total Costs of Hot Utilitiesare $2792/hr, andthe
Total Costs of ColdUtilitiesare $25.47/hr.
5.15. The operatingprofitof thisprocessisequal to:
Design-003H Revised:Nov7,2012
11
The operatingprofitof thisprocessis $10,036.23 perhour. The nextstepisto evaluate the capital costs
of the process.
5.16. Thissimulationhassofar takenintoaccount the massand energybalancesbutithas yetto consider
realisticequipmentdesignconstraints.Thissimulationishighlysimplifiedandhasservedtoprove this
processhas potential tobe profitable.The next stepistotransformthishighlysimplifieddesignintoa
‘real-life’designwhichwillprovide more accurate estimationsforcapital andoperatingcosts. Thisis
done usingthe builtin economics inAspen HYSYS.
Transformsimplified design using built in Economic Analyzer
5.17. Go to the Economicstab, and selectActivate Economics. This will enablethe EconomicAnalysis
functionalityinAspen HYSYS.
5.18. Whenthe economicanalysisis Activated, the IntegratedEconomicsbuttonsare enabled andreadyto
applyeconomiccalculations. Next,clickthe Mapbutton.
5.19. The map functionisa keystepindeterminingprojectscope and cost.Thisfunctionenablesunit
operationsfromthe simulation modeltobe mappedto“real-world”equipmentsothatpreliminary
equipmentsizingcanbe performed. This mappingprocessisanalogoustoequipmentselectionand
sizingandwill serve asthe basisindeterminingcosts. Whenthe Mapbuttonis clicked,the following
windowwill appear.Press OKto continue.
Design-003H Revised:Nov7,2012
12
5.20. The followingwindow titledMapPreviewwillallow youtochange the mappingforcertainunit
operations. The EconomicAnalysis haspre-defineddefaultmappings forunitoperations. However,
these maybe changedto create a more realistic costevaluation. Forexample,the defaultmappingfor
heatersare floating headshell andtube exchangers,but heaterblock E-100 isa furnace whichburns
natural gas.
SelectE-100 and click the dropdownmenuunder EquipmentType.
Design-003H Revised:Nov7,2012
13
5.21. A newwindowwillappear,select Heatexchangers,heaters and press OK.
5.22. Next,choose Furnace andclick OK.
Design-003H Revised:Nov7,2012
14
5.23. Lastly,selectVertical cylindrical process furnace andclick OK.
Design-003H Revised:Nov7,2012
15
5.24. You have nowsuccessfullychangedthe mappingof E-100 and itscost will be evaluatedaccordingly. We
mustalso change the mappingof the reactor froman agitatedtank to a plugflow reactor. For this
processitis sufficienttomodel the reactoras a shell andtube heatexchanger,because the reactorwill
be a vessel containingtubes.Selectthe CRV-100 andclick the dropdownmenuto change equipment
type. SelectHeatexchangers,heaters | Heat Exchanger | Fixedtube sheetshell and tube exchanger.
ClickOK inthe mappingwindowtocompletethe mappingprocess.
5.25. Next,clickon Size. The sizingprocesswill complete.
5.26. SelectViewEquipmenttoviewthe resultsof the sizing.
Design-003H Revised:Nov7,2012
16
5.27. The Economic Evaluation EquipmentSummary Grid will open. Goto the Equipmenttab. You may
encounteranerror forCRV-10 involvingboth the shell andtube streamsbeingheated.Thiscanbe
addressedbychangingthe outlettemperature (stream S5V) fromCRV-10to 481.8 °C, whichassures
that the shell streamwill decrease intemperature.
5.28. We are ready to evaluate. Clickthe Evaluate buttoninthe ribbon. The economicengine will perform
the analysis,itmaytake a fewmoments.
Design-003H Revised:Nov7,2012
17
5.29. ClickViewEquipment,andgo to the Equipmenttab to view anyerrorsthat occurred duringevaluation.
These errorswill tell youwhatinputsorchangesare requiredinorderto cost the simulationmore
realistically.
5.30. The evaluation error for compressor E-100 states that the material specified is inadequate for design
conditions. To fix this, go to the EFU VERTICAL tab and select a suitable material for construction.
Select304S (stainlesssteel) forMaterial.
Design-003H Revised:Nov7,2012
18
5.31. The error for K-100 is that the inlet temperature is too high. To fix this we will had a cooler before the
compressortocool downthe inletstream.
5.32. Double click K-100 and remove streamSynGasas an Inletstream. Create an Inlet streamcalled
SynGas2. Adda Coolerblockto the flowsheetandselectSynGasasthe Inletstream, SynGas2 as the
Outletstream,and create an Energy streamcalled Q-Cooler2. SpecifyaDeltaP of 0 and an outlet
Temperature of 300 K. Double clickstream Q-Cooler2andspecify CoolingWaterasthe UtilityType.
The flowsheetshouldnowlooklikethe following.
5.33. The errors for both E-101 and CRV-100 are thatthere are no materialsinthe database thatare suited
for sucha hightemperature andpressure combination. These materialswill likelyhave tobe custom
made for thisspecificprocessandpricedaccordingly. Howeverforthissimplifiedsimulation,we cantry
loweringthe operatingpressure inordertogeta cost estimate. Inreal life itmaynotbe plausable to
Design-003H Revised:Nov7,2012
19
change the operatingconditions,asthe reaction kineticsmaybe verydependentontemperatureand
pressure. However,forthissimulationwe are notusingkinetics. Therefore the reactionwillnotbe
affected.
5.34. Double clickeachcompressorandchange the outletpressure to 190 bar_g. The processwill now
operate at lowerpressures,allowingeconomicevaluationtoproduce acost estimate.
5.35. Repeatthe mappingandsizingprocesssince anew piece of equipmentnow existsonthe flowsheet.
Whenready,click Evaluate. The equipmentresultswillnow looklikethe followinginthe Economic
Evaluation EquipmentEquipmentGrid.There shouldnotbe any errors.
5.36. Go the Summary tab to viewresults.
5.37. Thistable displaysthe differentcostsassociatedwithconstructingandoperatingthisprocessaswell as
the total productsalesperyear. This processappearstohave the potential of beingahighlyprofitable
investment,withapayoff periodof only 3.64 years.
5.38. Clickon the InvestmentAnalysisbutton.
Design-003H Revised:Nov7,2012
20
5.39. Thiswill openupa MicrosoftExcel spreadsheetthat summarizesthe results. Inthe Excel spreadsheet
there will be the followingsheets: RunSummary, Executive Summary, Cash Flow,ProjectSummary,
Equipment,UtilitySummary, UtilityResource Summary, Raw Material Summary, and Product
Summary.
5.40. The Executive Summary sheetisa veryuseful sheetwhichdisplaysthe projectname,capacity,plant
location,description,scheduling,andinvestmentinformation.Thisisshownbelow.
5.41. The Cash Flowsheetisalso useful anddisplaysvariouscostsandassumptionsthatwentintomakingthe
economicestimations.
Design-003H Revised:Nov7,2012
21
6. Conclusion
Aspen HYSYS along with the economic analyzer tool can quickly create first approximations of process sizing and
costs. This is very useful when attempting to compare several process designs to decide which design will have
the best potential to be profitable. If a process has proven to be profitable at this level of analysis, costing
engineers will then take this preliminary design and fine tune it in a more detailed costing application such as
Aspen Capital Cost Estimator. Taking a conceptual design from a process simulator and being able to accurately
estimate the associated costs is extremely valuable and can be the difference between a successful investment
and a companygoingout of business.
Design-003H Revised:Nov7,2012
22
7. Copyright
Copyright © 2012 by Aspen Technology, Inc. (“AspenTech”). All rights reserved. This work may not be
reproduced or distributed in any form or by any means without the prior written consent of
AspenTech. ASPENTECH MAKES NO WARRANTY OR REPRESENTATION, EITHER EXPRESSED OR IMPLIED, WITH
RESPECT TO THIS WORK and assumes no liability for any errors or omissions. In no event will AspenTech be
liable to you for damages, including any loss of profits, lost savings, or other incidental or consequential
damages arising out of the use of the information contained in, or the digital files supplied with or for use with,
thiswork. This workand itscontentsare providedforeducational purposesonly.
AspenTech®, aspenONE®, and the Aspen leaf logo, are trademarks of Aspen Technology, Inc.. Brands and
productnamesmentionedinthisdocumentationare trademarksorservice marksof theirrespective companies.
Petroleum Refinery Engineering
PET-001H Revised:Nov6,2012
1
Gas Oil Separation Process with Aspen HYSYS® V8.0
1. Lesson Objectives
 Understand the gas oil separationprocess(GOSP)
 Understandhowto utilize Conceptual DesignBuilderinAspenHYSYS
2. Prerequisites
 Aspen HYSYS V8.0
3. Background
An oil well commonlyproducesthe crude consistingof gas,oil,water,andcontaminants. A gasoil separation
process(GOSP) handles the crude fromthe well and separatesoil,gas,water,andcontaminants.The processed
oil and gas can thenbe sentto oil refineriesandgasprocessingplants,respectively.
For fielddevelopmentresearchandassessment,anumberof processscenariosmustbe quicklygeneratedand
assignedwithdifferentprobabilities. AspenHYSYS andthe Conceptual DesignBuilderallow youtoquickly
generate the necessaryiterated,individual scenariosnecessaryforfielddevelopmentresearchandassessment.
The examplespresentedare solelyintendedtoillustrate specificconceptsand principles. Theymay not
reflectan industrial application or real situation.
4. Problem Statement and Aspen HYSYS Solution
Problem Statement
An oil field produces crude oil withthe followingspecificationsthatisprocessedinagas oil separationplant:
 Gas/oil ratio(GOR):200
 Water/oil ratio(WOR):0.02
 Production rate:2000 barrels/day
UsingAspenHYSYS and the Conceptual DesignBuilder,determinethe oil,gas,andwater productionrate from
thisprocess.
Aspen HYSYS Solution
4.01. Start AspenHYSYS V8.0. Clickthe Conceptual DesignBuilderbuttonfrom the GetStarted tab of the
ribbonto initialize ConceptualDesignBuilder (CDB).
PET-001H Revised:Nov6,2012
2
4.02. From the ProjectSetup tab of the CDB window,selectOil FieldforFieldType,Highfor both
Environmental SensitivityandPolitical Risk Sensitivity,andLow for PopulationDensity.The latter
three specificationsare forreportingpurposes.
4.03. Go to the ProjectSpecificationtab.Enter a Production Rate of 2000 barrels/day, GORof 200, andWOR
of 0.02 vol/vol.
PET-001H Revised:Nov6,2012
3
4.04. Go to the DesignPreferences tab.Inthe Separation frame,select3Stages for the Numberof Stages.
Thiswill provide athree-stageseparationtrainforthe process. Clickthe Run DesignCase button from
the Home tab of the ribbon.
PET-001H Revised:Nov6,2012
4
4.05. The Conceptual DesignBuilderwill now automaticallyconstructthe flowsheetin HYSYSaccordingthe
specificationsandpreferences.Navigatebackto AspenHYSYS, anda flowsheetshouldbe constructed
like the screenshot below.The generatedprocessconsistsof GOSP(Gas-oil separation),gas
compression,gassweetening,anddehydrationsections.
4.06. Openthe stream WellFluid2andgoto the Worksheet| Conditions page.Confirmthe Temperature and
Pressure is40 °C and48.99 bar_g, respectively.
PET-001H Revised:Nov6,2012
5
4.07. Go to the Worksheet|Oil & Gas Feed page.Confirmthatthe Total GORand Total WORis 200 and
0.02, respectively,asspecifiedinthe CDB.
PET-001H Revised:Nov6,2012
6
4.08. The GOSP unitutilizesathree-stageseparationprocesstoseparate the oil,gas,andwater.Openthe
GOSP_1 and clickthe Sub-FlowsheetEnvironmentbuttontoenterthe sub-flowsheetenvironment.
4.09. From the sub-flowsheet,threestagesof 3Phase Separatorsare includedin GOSP_1.The gas,oil,and
waterexitthe separatorsas vapor,lightliquid,andheavyliquid,respectively.
4.10. In orderto returnto the main flowsheet,clickthe ViewParentbuttonfromthe Flowsheet/Modifytab
of the ribbon.
PET-001H Revised:Nov6,2012
7
4.11. Openthe stream Produced_Water.The waterproductionrate from the processis 297.9 kg/hr.
4.12. Openthe stream Export_Oil. The oil productionrate fromthe processis 11152 kg/hr.
PET-001H Revised:Nov6,2012
8
4.13. Openthe stream ExportGas. The gas productionrate fromthe processis 1987 kg/hr.
5. Conclusions
An oil fieldproduces 13510 kg/hrof crude from the well andisprocessedviaagas oil separationprocess
(GOSP). The GOSP produced11152 kg/hr,1987 kg/hr,and 297.9 kg/hr of oil,gas,and water,respectively. The
detailedAspenHYSYSsimulationcase wasgeneratedfromthe preliminaryfielddata,reducingthe financial risk
whendevelopingasuitable engineeringdesign.
6. Copyright
Copyright© 2012 by AspenTechnology,Inc.(“AspenTech”).All rightsreserved. Thisworkmaynot be
reproducedordistributedinanyformor byany meanswithoutthe priorwrittenconsentof
AspenTech. ASPENTECHMAKESNOWARRANTYOR REPRESENTATION,EITHER EXPRESSEDOR IMPLIED, WITH
RESPECT TO THIS WORK and assumesnoliabilityforanyerrorsor omissions. Innoeventwill AspenTechbe
liable toyoufordamages,includinganylossof profits,lostsavings,orotherincidental orconsequential
damagesarisingoutof the use of the informationcontainedin,orthe digital filessuppliedwithorforuse with,
thiswork. This workand itscontentsare providedforeducational purposesonly.
AspenTech®,aspenONE®,andthe Aspenleaf logo,are trademarksof AspenTechnology,Inc.. Brandsand
productnamesmentionedinthisdocumentationare trademarksorservice marksof theirrespective companies.
PET-002H Revised:Nov 30,2012
1
Hydrate Formation in Gas Pipelines
with Aspen HYSYS® V8.0
1. Lesson Objectives
 Understand the hydrate formationcalculationwithinapipeline modelinAspenHYSYS
2. Prerequisites
 Aspen HYSYS V8.0
3. Background
Hydratesare commonlyformedinnatural gaspipelineswhenwateriscondensedinthe presence of methaneat
highpressures. Natural gashydratesare basicallymodifiedice structuresthatenclose methane andother
hydrocarbons. The issue withhydratesis thatat highpressurestheyhave highermeltingpointsthanice andcan
cause blockagesinpipelinesandotherprocessingequipment.
There are several methodsusedtopreventhydrate formationinpipelinessuchasheatingor reducingthe
pressure. A commonmethodusedisto adda hydrate inhibitor(anti-freeze) suchasethyleneglycol whichwill
decrease the temperature thathydrateswill form. Inthisdemowe will be simulatingthe pipingnetworkthat
mixesstreamsfrom3 gas wells beforetheyare senttoa gas-oil separator. The ambienttemperatureis0°C,and
as the gas streamscool due to heatlossinthe pipeline,the riskof hyrdate formationincreases.
The examplespresentedare solelyintendedtoillustrate specificconceptsand principles. Theymay not
reflectan industrial application or real situation.
4. Problem Statement and Aspen HYSYS Solution
Problem Statement
Usingthe pre-builtAspenHYSYSflowsheet PET-002H_Hydrate_Formation_Start.hsc, determinethe flowrateof
ethylene glycol thatis requiredtopreventanyhydratesfrom beingformedinthe gaspipeline.
Aspen HYSYS Solution
4.01. Start AspenHYSYS V8.0. Openthe file named PET-002H_Hydrate_Formation_Start.hsc.
4.02. Once the case file loads andsolves,youwillsee thatthere are three gaswell streamsandan ethylene
glycol inhibitorstreambeingfedintoan AspenHydraulicsSub-Flowsheet(AH-100).
PET-002H Revised:Nov 30,2012
2
4.03. The Aspen Hydraulics Sub-Flowsheetallowsforsimulationof pipes,junctions,mixers,swages,and
valves. Pipeline andhydraulicnetworksimulationscanbe solvedinSteadyState mode orDynamic
mode. Rightclickon AH-100 and selectOpenFlowsheetasNewTab.
PET-002H Revised:Nov 30,2012
3
4.04. FlowsheetTPL1 will appear. Here youwill see the pipingnetworkusedtomix the gaswell streamsand
the ethylene glycolinhibitor.
4.05. If you place the mouse overthe EG Inhibitorstream, a tool tip will appearshowingyouthe temperature,
pressure,andflowof the stream. The ethylene glycolstreamcurrentlyhasaflow rate of 0.1 kg/h.
4.06. We wouldnowlike tocheckif any hydratesare beingformedwiththe currentflow rate of inhibitor.
Double clickonthe pipe segment Pipe-104. Go to the FlowAssurance tab and selectthe Hydratesform.
In the plotyouwill see ablue line anda redline. The redline representsthe temperatureateachpoint
alongthe pipe andthe blue line representsthe temperature atwhichhydrateswill begintoform. With
the current flowof ethyleneglycol youcansee thathydrateswill begintoformatapproximately40
metersintothe pipe. Thissuggeststhatinorderto preventhydrate formationwe will needtoaddmore
inhibitortothe pipeline.
PET-002H Revised:Nov 30,2012
4
4.07. Move backto the mainflowsheet(FlowsheetMain). Double clickonthe EG Inhibitorstream and
change the flowrate to 50 kg/h. The flowsheetwill solve afterafew moments.
PET-002H Revised:Nov 30,2012
5
4.08. Nowif you go backto the AspenHydraulics Sub-Flowsheetandview the HydratesformforPipe-104
youwill see the following. The hydrate formationtemperature isnow lowerbuthydratesstill beginto
formin the pipe.
PET-002H Revised:Nov 30,2012
6
4.09. We will nowincrease the ethylene glycolflow again. Goto the mainflowsheetandchange the mass
flowof stream EG Inhibitorto 100 kg/h. The flowsheetwill solve afterafew moments.
PET-002H Revised:Nov 30,2012
7
4.10. The hydrate formationplotnowlookslike the following.
PET-002H Revised:Nov 30,2012
8
4.11. The blue line (hydrate formationtemperature) isnow completelybelowthe redline (temperature
profile). Thisindicatesthathydrate formationisunlikelyforthispipelinewithaninhibitorflowrateof
100 kg/h.
5. Conclusions
UsingAspenHYSYS V8.0 we were able to determinethe amountof ethylene glycolisrequiredtoprevent
hydrate formationina pipeline network. Itwas determinedthatanethylene glycol flowrate of 100 kg/his
sufficientforthisgaspipeline.
6. Copyright
Copyright© 2012 by Aspen Technology,Inc.(“AspenTech”).All rightsreserved. Thisworkmaynot be
reproducedordistributedinanyformor byany meanswithoutthe priorwrittenconsentof
AspenTech. ASPENTECHMAKESNOWARRANTYOR REPRESENTATION,EITHER EXPRESSEDOR IMPLIED, WITH
RESPECT TO THIS WORK and assumesnoliabilityforanyerrorsor omissions. Innoeventwill AspenTechbe
liable toyoufordamages,includinganylossof profits,lostsavings,orotherincidental orconsequential
damagesarisingoutof the use of the informationcontainedin,orthe digital filessuppliedwithorforuse with,
thiswork. This workand itscontentsare providedforeducational purposesonly.
PET-002H Revised:Nov 30,2012
9
AspenTech®,aspenONE®,andthe Aspenleaf logo,are trademarksof AspenTechnology,Inc.. Brandsand
productnamesmentionedinthisdocumentationare trademarksorservice marksof theirrespective companies.

Chemical engineering simulations

  • 1.
    AspenTech Incorporations Aspen HysysV8.8 Cases Solved in Hysys Version 8.0 are same as Version 8.8
  • 2.
  • 3.
    Matbal-001H Revised:Nov7,2012 1 Cyclohexane Productionwith Aspen HYSYS® V8.0 Lesson Objectives1.  Constructan Aspen HYSYS flowsheetsimulationof the productionof cyclohexane viabenzene hydrogenation  Become familiarwithuserinterface and toolsassociatedwithAspenHYSYS Prerequisites2.  Aspen HYSYS V8.0  Knowledgeof chemical processoperations Background/Problem3. Construct an Aspen HYSYS simulation to model the production of cyclohexane via benzene hydrogenation. The simplified flowsheet for this process is shown below. Fresh benzene and hydrogen feed streams are first fed through a heater to bring the streams up to reactor feed temperature and pressure conditions. This feed mixture is then sent to a fixed-bed catalytic reactor where 3 hydrogen molecules react with 1 benzene molecule to form cyclohexane. This simulation will use a conversion reactor block to model this reaction. The reactor effluent stream is then sent to a flash tank to separate the light and heavy components of the mixture. The vapor stream coming off the flash tank is recycled back to the feed mixture after a small purge stream is removed to preventimpurities from building upin the system. The majority of the liquid streamleaving the flash tank goes to a distillation column to purify the cyclohexane product, while a small portion of the liquid stream is recycled back to the feed mixture to minimize losses of benzene. Process operating specifications are listed on the followingpage.
  • 4.
    Matbal-001H Revised:Nov7,2012 2 FeedStreams Benzene Feed(BZFEED) Composition (mole fraction) Hydrogen - Nitrogen - Methane - Benzene 1 Total Flow (lbmol/hr) 100 Temperature(°F) 100 Pressure (psia) 15 Hydrogen Feed (H2FEED) Hydrogen 97.5 Nitrogen 0.5 Methane 2.0 Benzene - Total Flow (lbmol/hr) 310 Temperature(°F) 120 Pressure (psia) 335 DistillationColumn Number of stages 15 Feed stage 8 Reflux Ratio 1.2 Cyclohexane recovery 99.99 mole % inbottoms Condenser Pressure 200 psia ReboilerPressure 210 psia FeedPreheater Outlet Temperature 300 °F Outlet Pressure 330 psia Reactor Stoichiometry Benzene +3H2  Cyclohexane Conversion 99.8% ofbenzene Outlet temperature 400°F Pressure drop 15psi Flash Tank Temperature 120°F Pressure drop 5psi Purge Stream Purge rateis 8% ofvaporrecyclestream LiquidSplit 70% ofliquidstreamgoes todistillationcolumn The examplespresentedare solely intendedtoillustrate specificconceptsand principles. Theymay not reflectan industrial application or real situation.
  • 5.
    Matbal-001H Revised:Nov7,2012 3 Aspen HYSYSSolution4. 4.01. Start AspenHYSYS V8.0, selectNewon the Start Page to start a new simulation. 4.02. Create a componentlist. Inthe ComponentLists folder,selectthe Addbuttonto create a newHYSYS componentlist. 4.03. Define components. Use the Find button to select the following components: Hydrogen, Nitrogen, Methane, Benzene,andCyclohexane. 4.04. Select a property package. In the Fluid Packages folder in the navigation pane click Add. Select SRK as the propertypackage.
  • 6.
    Matbal-001H Revised:Nov7,2012 4 4.05. Wemust now specify the reaction involved in this process. Go to Reactions folder in the navigation pane and click Add to add a reactionset. 4.06. In Reactions | Set-1 select Add Reaction. Select the Hysys radio button and select Conversion. Then click Add Reaction. Once a new reaction (Rxn-1) can be seen on the reaction set page, close the Reactions windowshownbelow. 4.07. Double click on Rxn-1 to define the reaction. In the reaction property window, add components Benzene, Hydrogen, and Cyclohexane to the Stoichiometry Info grid. Enter -1, -3, and 1, respectively, for stoichiometry coefficients. In the Basis grid select Benzene as Base Component, Overall for Rxn Phase, 99.8 for Co, and 0 for both C1 and C2. This indicates that the reaction will convert 99.8% of benzene regardlessof temperature. Close thiswindow whencomplete.
  • 7.
    Matbal-001H Revised:Nov7,2012 5 4.08. Attachthis reaction set to a fluid package by clicking the Add to FP button. Select Basis-1 and click Add Set to FluidPackage. The reactionsetshouldnow be ready. 4.09. We are now ready to enter the simulation environment. Click the Simulation button in the bottom left of the screen.
  • 8.
    Matbal-001H Revised:Nov7,2012 6 4.10. Firstwewill place aMixer anda Heater blockontothe flowsheet. 4.11. Double click on the mixer (MIX-100) to open the mixer property window. Create 2 inlet streams: H2FEED, BZFEED; and 1 outletstream: ToPreHeat.
  • 9.
    Matbal-001H Revised:Nov7,2012 7 4.12. Goto the Worksheet tab to define streams H2FEED and BZFEED. First we will define the Conditions of each stream. For H2FEED, enter a Temperature of 120°F, a Pressure of 335 psia, and a Molar Flow of 310 lbmole/hr. For BZFEED, enter a Temperature of 100°F, a Pressure of 15 psia, and a Molar Flow of 100 lbmole/hr. Note that you can change the global unit set to Field if the units are different than those displayedbelow.
  • 10.
    Matbal-001H Revised:Nov7,2012 8 4.13. Nextwe will define the Composition of the two feed streams. In the Worksheet tab go to the Composition form. Enter the compositions shown below. You will notice that after inputting the composition, the mixerwillsuccessfullysolve forall properties. 4.14. Double click on the heater block (E-100) to configure the heater. Select stream ToPreHeat as the inlet and create an outletstreamcalled R-IN. Addan energystreamcalled PreHeatQ.
  • 11.
    Matbal-001H Revised:Nov7,2012 9 4.15. Goto the Worksheet tab and specify the outlet stream R-IN temperature and pressure. Enter 300°F for Temperature and 330 psiafor Pressure.
  • 12.
    Matbal-001H Revised:Nov7,2012 10 4.16. Theflowsheetshouldlooklike the followingatthispoint. 4.17. We will now add a Conversion Reactor to the flowsheet. Press F12 on the keyboard to open the UnitOpswindow. Selectthe Reactorsradiobuttonand select ConversionReactor. Press Add. 4.18. In the Conversion Reactor property window, select the inlet stream to be R-IN, and create a Liquid OutletcalledLIQ and a Vapour Outlet calledVAP. Inthe Parametersform, entera Delta P of 15 psi.
  • 13.
  • 14.
    Matbal-001H Revised:Nov7,2012 12 4.19. Inthe Reactions tab, select Set-1 for Reaction Set. Notice that when the reactor solves, the contents of the reactor are entirely in the vapor phase, therefore there is no liquid flow leaving the bottom of the reactor.
  • 15.
    Matbal-001H Revised:Nov7,2012 13 4.20. Nextwewill addaCooler to the mainflowsheettocool downthe vaporstreamleavingthe reactor. 4.21. Double click on the cooler block (E-101) to open the cooler property window. Select VAP as the inlet stream and create an outlet stream called COOL. Also add an energy stream called COOLQ. In the Parameters formentera Delta P of 5 psi.
  • 16.
    Matbal-001H Revised:Nov7,2012 14 4.22. Goto the Worksheet tab to specify the outlet stream temperature. Enter 120°F for the Temperature of streamCOOL. The coolerwill solve.
  • 17.
    Matbal-001H Revised:Nov7,2012 15 4.23. Wewill now add a Separator block to separate the vapor and liquid phases of stream COOL. From the model palette addaSeparator to the flowsheet. 4.24. Double click on the separator block(V-100). Select COOL as the inlet stream and create liquid and vapor outletstreamscalled LIQ1and VAP1. The separatorshouldsolve.
  • 18.
    Matbal-001H Revised:Nov7,2012 16 4.25. Theflowsheetshouldnowlooklikethe following. 4.26. We will now add 2 Tee blocks, 1 for each of the separator outlet streams. One tee will be used to purge a portion of the vapor stream to prevent impurities from building up in the system. The other tee will be used to recycle a portion of the liquid back to the mixer and the rest of the liquid will be fed to a distillationcolumn.
  • 19.
    Matbal-001H Revised:Nov7,2012 17 4.27. Doubleclick on the first Tee block (TEE-100). Select stream VAP1 as the inlet, and create 2 outlet streamsVAPREC,and PURGE.
  • 20.
    Matbal-001H Revised:Nov7,2012 18 4.28. Goto the Parameterspage and enter0.08 for the Flow Ratio for streamPURGE. 4.29. You can rotate the icon for a block by selecting the icon and clicking the Rotate button in the Flowsheet/Modifytabinthe ribbon.
  • 21.
    Matbal-001H Revised:Nov7,2012 19 4.30. Doubleclick the second Tee block (TEE-101). Select LIQ1 for the inlet stream and create 2 outlet streamsLIQREC, and ToColumn. 4.31. In the Parameters tab entera FlowRatio of 0.7 for streamToColumn.
  • 22.
    Matbal-001H Revised:Nov7,2012 20 4.32. Theflowsheetshouldnow looklikethe following. (FAQ) UsefulOption To Know:Saving Checkpoints Save “checkpoints” as you go. Once you have a working section of the flowsheet, save as a new file name, so you can revert to an earlier checkpoint if the current one becomes too complex to troubleshootorconvergence errorsbecomepersistent.
  • 23.
    Matbal-001H Revised:Nov7,2012 21 4.33. Weare now ready to connect the recycle streams back to the mixer. On the main flowsheet, add 2 Recycle blocks.
  • 24.
    Matbal-001H Revised:Nov7,2012 22 4.34. Doubleclick on the first recycle block (RCY-1). Select stream VAPREC as the inlet stream and create an outletstreamcalled VAPToMixer. 4.35. Double click the second recycle block (RCY-2). Select LIQREC as the inlet stream and create an outlet streamcalled LIQToMixer.
  • 25.
    Matbal-001H Revised:Nov7,2012 23 4.36. Connectthe recycle streams back to the mixer. Double click the mixer block (MX-100). On the Design | Connectionssheetadd LIQToMixerand VAPToMixeras inletstreams. The flowsheetshouldconverge. 4.37. The flowsheetshouldnowlooklikethe following.
  • 26.
    Matbal-001H Revised:Nov7,2012 24 4.38. Weare now ready to add the distillation column to the flowsheet. From the Model Palette add a DistillationColumnSub-Flowsheet. 4.39. Double click on the Distillation Column Sub-flowsheet. This will launch the Distillation Column Input Expert. Enter 15 for # Stages and specify ToColumn as inlet stream on stage 8_Main TS. Select Full Reflux for Condenser, create an Ovhd Vapour Outlet stream called Off Gas, create Bottoms Liquid Outletstreamcalled Bot, and adda CondenserEnergyStream calledCondQ. Whenfinishedclick Next.
  • 27.
    Matbal-001H Revised:Nov7,2012 25 4.40. Onpage 2 of the Distillation Column Input Expert keep the default selections for Reboiler Configuration and click Next.
  • 28.
    Matbal-001H Revised:Nov7,2012 26 4.41. Onpage 3 of the Distillation Column Input Expert enter a condenser pressure of 200 psia and a reboiler pressure of 210 psia. ClickNext. 4.42. On page 4 of the Distillation Column Input Expert leave fields for temperature estimates blank and click Next. On the final page of the column expert enter a molar Reflux Ratio of 1.2 and click Done to configure the column.
  • 29.
    Matbal-001H Revised:Nov7,2012 27 4.43. Aftercompleting the input for the column expert the Column property window will open. We want to create a design specification in order to ensure that 99.99% of the cyclohexane is recovered in the bottoms stream. Go to the Design | Specs sheet. Click Add and select Column Component Recovery. In the Comp Recovery window specify Stream for Target Type, Bot@COL1 for Draw, 0.9999 for Spec Value,and Cyclohexane forComponents. Close thiswindow whenfinished.
  • 30.
    Matbal-001H Revised:Nov7,2012 28 4.44. Goto the Specs Summary sheet and make sure that the only active specs are Reflux Ratio and Comp Recovery. The columnshouldconverge. 4.45. The flowsheetisnowcomplete andshouldlooklike the following.
  • 31.
    Matbal-001H Revised:Nov7,2012 29 Thisflowsheetisnowcomplete. Conclusion5. This isa simplified process simulation, however you should now have learned the basic skills to create and manipulate asteadystate chemical processsimulationinAspenHYSYSV8.0. Copyright6. Copyright © 2012 by Aspen Technology, Inc. (“AspenTech”). All rights reserved. This work may not be reproduced or distributed in any form or by any means without the prior written consent of AspenTech. ASPENTECH MAKES NO WARRANTY OR REPRESENTATION, EITHER EXPRESSED OR IMPLIED, WITH RESPECT TO THIS WORK and assumes no liability for any errors or omissions. In no event will AspenTech be liable to you for damages, including any loss of profits, lost savings, or other incidental or consequential damages arising out of the use of the information contained in, or the digital files supplied with or for use with, thiswork. This workand itscontentsare providedforeducational purposesonly. AspenTech®, aspenONE®, and the Aspen leaf logo, are trademarks of Aspen Technology, Inc.. Brands and productnamesmentioned inthisdocumentationare trademarksorservice marksof theirrespective companies.
  • 32.
    Matbal-002H Revised:Nov7,2012 1 Calculation ofGasoline Additives with Aspen HYSYS® V8.0 1. Lesson Objectives  Learn howto specifyamixer  Learn howto use the spreadsheetinAspen HYSYStoperformcustomizedcalculations 2. Prerequisites  Aspen HYSYS V8.0 3. Background Ethyl tert-butyl ether(ETBE) isan oxygenate thatisaddedtogasoline toimprove ResearchOctane Number (RON) andto increase oxygencontent. The goal isto have 2.7% oxygenbyweightinthe final product. The legal limitisthatETBE cannot exceed more than17% byvolume. Forsimplicity,we use 2,2,4-trimethylpentane to representgasoline. Since ETBE'smolecularweightis102.18 g/mol, the ETBE in the productstream can be calculatedasfollowing: Thisyields17.243% of ETBE byweightinthe productstream. Giventhis,the spreadsheettool canbe utilizedto target the ETBE feedtoachieve the desiredoxygencontent. In thistutorial we will calculate:  For a certainflowrate of gasoline (e.g.,100 kg/hr),how muchETBE shouldbe addedto achieve the oxygencontentof 2.7% byweightinthe blendedgasoline.  Checkwhetherornot the legal limitof ETBE contentissatisfied. A HYSYS spreadsheetis usedtoperformcalculationsoneachcriterion. Both targetsshouldbe metinthe simulation. The examplespresentedare solelyintendedtoillustrate specificconceptsand principles. Theymay not reflectan industrial application or real situation.
  • 33.
    Matbal-002H Revised:Nov7,2012 2 4. AspenHYSYS Solution 4.01. Start a newsimulationin AspenHYSYSV8.0. 4.02. Create a componentlist. Inthe ComponentLists folderselectAdd. Add2,2,4-trimethylpentane and ETBE to the componentlist. 4.03. Define propertypackage. Inthe FluidPackagesfolderselectAdd. SelectPeng-Robinsonasthe propertypackage. 4.04. Enter the simulationenvironmentbyclickingthe Simulationbuttoninthe bottomleftof the screen. 4.05. Adda Mixerto the flowsheetfromthe Model Palette.
  • 34.
    Matbal-002H Revised:Nov7,2012 3 4.06. Doubleclickonthe mixer(MIX-100). Create two InletscalledETBE and Gasoline. Create anOutlet calledBlend.
  • 35.
    Matbal-002H Revised:Nov7,2012 4 4.07. Definefeedstreams. Goto the Worksheettab. For streamETBE entera Temperature of 25°C and a Pressure of 1 bar. Leave Mass Flowemptyas we will solve foritlater. 4.08. In the Compositionformunderthe Worksheettab,entera Mole Fraction of 1 for ETBE in the ETBE feed stream.
  • 36.
    Matbal-002H Revised:Nov7,2012 5 4.09. Definegasoline feedstream. Inthe Conditionsforminthe Worksheettab,entera Temperature of 25°C, a Pressure of 1 bar, anda Mass Flowof 82.76 kg/h. 4.10. In the Compositionformentera Mole Fraction of 1 for 224-Mpentane inthe Gasoline stream. The gasoline streamshouldsolve.However.the mixerwill notsolve because the flowrate of ETBE is still unknown.
  • 37.
    Matbal-002H Revised:Nov7,2012 6 4.11. Wewill nowcreate aspreadsheettocalculate the targetmassflowrate of streamETBE. Adda Spreadsheettothe flowsheetfromthe Model Palette.
  • 38.
    Matbal-002H Revised:Nov7,2012 7 4.12. Doubleclickonthe spreadsheet(SPRDSHT-1). Goto the Spreadsheettaband enterthe followingtextin cellsA1 and A2.
  • 39.
    Matbal-002H Revised:Nov7,2012 8 4.13. Rightclickoncell B1 andselectImport Variable. Selectthe followingtoimportthe MassFlowof stream Gasoline tocell B1. Press OK whencomplete. 4.14. Clickcell B2 and enterthe followingformula: =(B1*0.17243) / (1-0.17243). This will calculate the mass flowrate for streamETBE. Fromthe backgroundsection,we know thatinorderto reach the oxygen contentgoal of 2.7%, we will needthe gasoline streamtocontain17.243% ETBE by weight.
  • 40.
    Matbal-002H Revised:Nov7,2012 9 4.15. Wenowwishto exportthe calculatedflow rate incell B2to streamETBE. Rightclickcell B2 and select Export Formula Result. Make the followingselectionsandclick OKwhencomplete. The mixershould nowsolve.
  • 41.
    Matbal-002H Revised:Nov7,2012 10 4.16. Wewill nowcalculate the volumepercentof ETBEin the blendedstreamtomake sure thatthe ETBE contentisbelowthe legal limitof 17volume percent. Thiscaneasilybe observedinthe spreadsheet. In the spreadsheet,enterthe followingtextincell A4. 4.17. Rightclickon cell B4 andselectImport Variable.Make the followingselectionstoimport MasterComp Volume Frac of ETBE inthe blendedstream. Click OKwhencomplete.
  • 42.
    Matbal-002H Revised:Nov7,2012 11 4.18. Thevolume fractionof ETBE inthe blendedstreamis0.1596, whichis below the legal limitof 0.17. It is determinedthatthe targetflowrate of ETBE to be mixedwiththisgasoline streamis17.24 kg/h.
  • 43.
    Matbal-002H Revised:Nov7,2012 12 5. Conclusions Fora specifiedgasolinemassflowrate of 82.76 kg/hr,17.24 kg/hrof ETBE isneededtoachieve 2.7% oxygen contentbyweightinthe final product. Furthermore,afterblending,the productdoesnotexceedthe legallimit for ETBE of 17% byvolume. If gasoline containsasingle component,manualcalculationshouldbe easywithout a simulator. However,real gasoline containsmanyunknowncomponentsandgasoline’scontentsvaryas feedstockorplantoperationconditionschange. Therefore,manual calculationbecomesverydifficultandthe use of a simulatorsuchas Aspen HYSYScan be helpful tocarryout the calculation. 6. Copyright Copyright© 2012 by AspenTechnology,Inc.(“AspenTech”).All rightsreserved. Thisworkmaynot be reproducedordistributedinanyformor byany meanswithoutthe priorwrittenconsentof AspenTech. ASPENTECHMAKESNOWARRANTYOR REPRESENTATION,EITHER EXPRESSEDOR IMPLIED, WITH RESPECT TO THIS WORK and assumesnoliabilityforanyerrorsor omissions. Innoeventwill AspenTechbe liable toyoufordamages,includinganylossof profits,lostsavings,orotherincidental orconsequential damagesarisingoutof the use of the informationcontainedin,orthe digital filessuppliedwithorforuse with, thiswork. This workand itscontentsare providedforeducational purposesonly. AspenTech®,aspenONE®,andthe Aspenleaf logo,are trademarksof AspenTechnology,Inc.. Brandsand productnamesmentionedinthisdocumentationare trademarksorservice marksof theirrespective companies.
  • 44.
  • 45.
    Prop-001H Revised:Nov16,2012 1 Generate EthyleneVapor Pressure Curves with Aspen HYSYS® V8.0 1. Lesson Objectives  Generate vaporpressure curvesforEthylene 2. Prerequisites  Aspen HYSYS V8.0  Introductiontovapor-liquidequilibrium 3. Background Separationprocessesinvolvingvapor-liquidequilibrium exploitvolatilitydifferenceswhich are indicatedbythe components’ vaporpressure. Highervaporpressure meansacomponentismore volatile. Ethylene isanimportantmonomerforpolymersandthere are manyethyleneplantsaroundthe world. A vital stepinethylene productionisseparatingitfromothercompoundsandasa resultthe vapor pressure of ethylene isanimportantphysical propertyforethyleneproduction. The examplespresentedare solelyintendedtoillustrate specificconceptsand principles. Theymay not reflectan industrial application or real situation. 4. Problem Statement and Aspen HYSYS Solution Problem Statement Determine the vaporpressure of ethylene at5 °C, and itsnormal boilingpoint. Alsocreate aplotof vapour pressure versustemperature. Aspen HYSYS Solution 4.01. Create a newsimulationin AspenHYSYSV8.0. 4.02. Create a componentlist. Inthe ComponentList folderselectAdd. AddEthylene tothe componentlist.
  • 46.
    Prop-001H Revised:Nov16,2012 2 4.03. Doubleclickon Ethylene to viewthe pure componentproperties. Goto the Critical tab. Make a note that the Critical Temperature is9.2°C and the Normal BoilingPoint is-103.8°C.
  • 47.
    Prop-001H Revised:Nov16,2012 3 4.04. Definepropertymethods. Goto the FluidPackages folderandclick Add. SelectPeng-Robinsonasthe propertypackage. 4.05. Move to the simulationenvironment. Clickthe Simulationbuttoninthe bottomleftof the screen. 4.06. Adda Material Stream to the flowsheet.
  • 48.
    Prop-001H Revised:Nov16,2012 4 4.07. Doubleclickonmaterial stream(1).The vapor pressure of liquidisthe atmosphericpressureatwhicha pure liquidboilsata giventemperature. The pointatwhichthe firstdropof liquidbeginstoboil is calledthe bubble point,whichisfoundinHYSYSby specifyingavapourfraction of 0. Therefore,we can findthe vaporpressure of pure liquidbyspecifyingatemperature andvapourfractionof 0. 4.08. In material stream 1,entera Vapour Fraction of 0, a Temperature of 5°C, and a Molar Flow of 1 kgmole/h. In the Compositionformunderthe Worksheettab entera Mole Fraction of 1 for Ethylene. 4.09. You can see that the Pressure is45.93 bar. Thisis equivalenttothe vapourpressure of ethylene atthis temperature. Nextwe wouldliketodetermine the normal boilingpointof ethylene. Insteadof specifyingtemperature,we will specifypressure. Emptythe fieldfortemperature andenteravalue of 1 bar forPressure.
  • 49.
    Prop-001H Revised:Nov16,2012 5 4.10. Thenewlycalculatedtemperature is -104.3°C. Thisisthe boilingtemperature of ethylene atapressure of 1 bar. 4.11. Nextwe wouldlike tocreate aplotof vapourpressure versustemperature. First,inthe Material Stream 1 window,emptythe fieldfor Pressure andenterany Temperature (below critical temperature). Thiswill allowustovary temperature whenwe performacase study. Go to the Case Studiesfolderin the Navigation Pane and click Add.
  • 50.
    Prop-001H Revised:Nov16,2012 6 4.12. InCase Study 1, click Add to selectthe variables. Select the Temperature andPressure of stream1. In the IndependentVariable fieldenteraLow Bound of -150°C, a High Bound of 0°C, and a Step Size of 10°C. Click Run.
  • 51.
    Prop-001H Revised:Nov16,2012 7 4.13. Afterrunningthecase study,go to the Plotstab. Here youwill see aplotof Pressure vs Temperature.
  • 52.
    Prop-001H Revised:Nov16,2012 8 4.14. Notethat bylookingatthe plotyoucan verifythatat around -104°C the vapourpressure if approximately1bar, indicatingthe normal boilingpoint. 5. Conclusions As we can see fromthe generated plot,ethylene isaveryvolatile component. At5°C, itsvapor pressure is about45.93 bar. From thisanalysis,we alsosee thatethylene’s normal boilingpointtemperature isabout –104 °C. 6. Copyright Copyright© 2012 by AspenTechnology,Inc. (“AspenTech”). All rightsreserved. Thisworkmaynotbe reproducedordistributedinanyformor byany meanswithoutthe priorwrittenconsentof AspenTech. ASPENTECHMAKESNOWARRANTYOR REPRESENTATION,EITHER EXPRESSEDOR IMPLIED, WITH RESPECT TO THIS WORK and assumesnoliabilityforanyerrorsor omissions. Innoeventwill AspenTechbe liable toyoufordamages,includinganylossof profits,lostsavings,orotherincidental orconsequential damagesarisingoutof the use of the informationcontainedin,orthe digital filessuppliedwithorforuse with, thiswork. This workand itscontentsare providedforeducational purposesonly. AspenTech®,aspenONE®,andthe Aspenleaf logo,are trademarksof AspenTechnology,Inc.. Brandsand productnamesmentionedinthisdocumentationare trademarksorservice marksof theirrespective companies.
  • 53.
    Prop-003H Revised:Nov5,2012 1 Retrieve PureComponent Property Data with Aspen HYSYS® V8.0 1. Lesson Objectives  Learn howto retrieve property dataforpure componentsinAspen HYSYS. 2. Prerequisites  AspenHYSYS V8.0 3. Background There are manyreasonsthat we needphysical propertiesof pure components. Whenwe lookfor a solventforextractive distillation(atechnologythatusesathirdcomponent,the solvent,to separate twocomponentsinamixture thatare difficulttoseparate directlyviadistillation),we lookfor componentswithnormal boilingpointtemperaturesthatare higher(butnottoo muchhigher) thanthe componentstobe separated. Forsuch a case,we needtoknow the normal boilingpointtemperaturesof candidate solventsduringthe search. Whenwe lookfor a solventforextraction,we needtocheckthe densitiesof candidatesolventstoensure the twoliquidphasesformedduringextractionhave enoughdifferencesindensity. Forthe selectedsolvent,we alsoneedto checkitsdensityagainstthe existingliquidphase sothatwe know whichliquidphaseisheavier. The examplespresentedare solelyintendedtoillustrate specificconceptsand principles. Theymay not reflectan industrial application or real situation. 4. Problem Statement and Aspen HYSYS Solution Problem Statement The pre-conditionof thisexample isthat3-methylhexaneisnow consideredapromisingcandidatesolventfor separationof acetone andwater. The task is to determinewhetherthe densityof 3-methylhexane isdifferent enoughfrom the density of water. We alsoneedto determinewhichof the twoliquidphasesformedmainlyby these twocomponentsisheavier.
  • 54.
    Prop-003H Revised:Nov5,2012 2 Aspen HYSYSSolution 4.01. Create a new case inAspenHYSYS V8.0. 4.02. Create a componentlist. Inthe ComponentLists folderselectthe Addbuttonto add a new component list.
  • 55.
    Prop-003H Revised:Nov5,2012 3 4.03. Enter3-methylhexane inthe Searchfor box. Aspen HYSYS shoulddisplaythe relevantsearchresults. If the componentyouare lookingfordoesnotappear, you can alsouse the Filteror Search by drop-down listfordifferentsearchcriteria. Clickthe < Addbuttonto add the componentto the componentlist.
  • 56.
    Prop-003H Revised:Nov5,2012 4 4.04. Toretrieve andviewthe pure componentproperty dataand, double-clickthe component 3-Mhexane.A newwindowshouldappear. 4.05. Go to the Critical tab inthe newwindow.Youwill see alistof property datainthe Base Propertiesand Critical Properties frames. Note thatthe Ideal Liquid Densityfor3-methylhexane is690.2 kg/m3 .
  • 57.
    Prop-003H Revised:Nov5,2012 5 4.06. Inthe navigationpane, gotothe Components| ComponentList -1 sheet. Enterwater inthe Search for box and add the componenttothe componentlist.
  • 58.
    Prop-003H Revised:Nov5,2012 6 4.07. Double-clickonthecomponent H2O. A new window shouldappear.
  • 59.
    Prop-003H Revised:Nov5,2012 7 4.08. Goto the Critical tab inthe newwindow. Youwill see alistof property datainthe Base Propertiesand Critical Properties frames. Note thatthe Ideal Liquid DensityforWater is998.0 kg/m3 . 5. Conclusions The densityof 3-methylhexane isaround690.2 kg/m3 ,whichisclearlylessthan the density of water(998.0 kg/m3 ).The liquidphase formedmainlyby3-methylhexane shouldbe lighterthanthe phase formedmainlyby waterand, thus,the aqueousphase shouldbe atthe bottomand the otherliquidphase shouldbe atthe top.
  • 60.
    Prop-003H Revised:Nov5,2012 8 6. Copyright Copyright©2012 by AspenTechnology,Inc.(“AspenTech”).All rightsreserved. Thisworkmaynot be reproducedordistributedinanyformor byany meanswithoutthe priorwrittenconsentof AspenTech. ASPENTECHMAKESNOWARRANTYOR REPRESENTATION,EITHER EXPRESSEDOR IMPLIED, WITH RESPECT TO THIS WORK and assumesnoliabilityforanyerrorsor omissions. Innoeventwill AspenTechbe liable toyoufordamages,includinganylossof profits,lostsavings,orotherincidental orconsequential damagesarisingoutof the use of the informationcontainedin,orthe digital filessuppliedwithorforuse with, thiswork. This workand itscontentsare providedforeducational purposesonly. AspenTech®,aspenONE®,andthe Aspenleaf logo,are trademarksof AspenTechnology,Inc.. Brandsand productnamesmentionedinthisdocumentationare trademarksorservice marksof theirrespective companies.
  • 61.
    Prop-005H Revised:Nov7,2012 1 Hypothetical Componentsand Petroleum Assays with Aspen HYSYS® V8.0 1. Lesson Objectives  Create hypothetical componentsinAspenHYSYS  Characterize apetroleumassay 2. Prerequisites  Aspen HYSYS V8.0 3. Background AspenHYSYS allowsyoutocreate non-libraryorHypothetical components. These hypothetical componentscan be pure components,definedmixtures,undefinedmixtures,orsolids. A wide selectionof estimationmethods are providedforvariousHypogroupstoensure the bestrepresentationof behaviorfor the Hypothetical componentinthe simulation. In orderto accuratelymodel aprocesscontaininga crude oil,suchas a refineryoperation,the oil properties mustbe defined. Itisnearlyimpossible todeterminethe exactcompositionof anoil assay,as there are far too manycomponentsinthe mixture. Thisis a situation where hypothetical components are useful. Boilingpoint measurementsof distillate fractionsof anassaycan be usedto characterize the oil properties. The examplespresentedare solelyintendedtoillustrate specificconceptsand principles. Theymay not reflectan industrial application or real situation. 4. Problem Statement and Aspen HYSYS Solution Problem Statement Create a hypothetical componentgroupinAspenHYSYSandcharacterize a petroleumassaytobe usedina refinerysimulation. Aspen HYSYS Solution 4.01. Start a newsimulationin AspenHYSYSV8.0. 4.02. Create a componentlist. Inthe ComponentLists folderselectAdd. Change the Selectfieldto Hypothetical and enterthe Initial and Final BoilingPoints for the hypothetical group shownbelow. ClickGenerate Hypos whencomplete. Thiswillgenerateagroupof hypothetical componentswith estimatedpropertiesbasedonthe specifiedboilingpointof eachcut.
  • 62.
    Prop-005H Revised:Nov7,2012 2 4.03. ClickAddAll to add the entire hypothetical grouptothe componentlist.
  • 63.
    Prop-005H Revised:Nov7,2012 3 4.04. Definepropertypackage. Inthe FluidPackagesfolderselectAdd. SelectPeng-Robinsonasthe propertypackage. 4.05. Enter the simulationenvironmentbyclickingthe Simulationbuttoninthe bottomleftof the screen.
  • 64.
    Prop-005H Revised:Nov7,2012 4 4.06. AddaMaterial Stream to the flowsheetfromthe Model Palette. Doubleclickthe streamandgo to the Compositionformunderthe Worksheettab. 4.07. You will notice thatthe mole fractionsof all the componentsare empty. If youwouldlike toassignan oil assayto thisstreamgo to the PetroleumAssayform underthe Worksheettab. Selectthe option Create New Assay On Stream.
  • 65.
    Prop-005H Revised:Nov7,2012 5 4.08. ClickthePetroleumAssay Specifications button. Thispage allowsyoutoenterassaydistillationdataor importdata froma knownoil assay.
  • 66.
    Prop-005H Revised:Nov7,2012 6 4.09. ClicktheImport From buttonand select AssayLibrary to importdata froma knownassayinthe HYSYS assaylibrary. 4.10. Say,for example,thatwe wanttomodel a refineryprocessusingBachaqueroheavycrude from Venezuela. Scroll downthe listof assaysandselect Bachaquero,Venezuela. Click ImportSelected Assay.
  • 67.
    Prop-005H Revised:Nov7,2012 7 4.11. Afterafewmomentsthe MacroCutData window will be filledwithdistillationcutdatafor Bachaquero heavycrude. 4.12. Clickthe Calculate Assay buttonto assign mole fractionstothe hypothetical componentsdefinedfor the stream. Exit the MacroCut Data window andview the Componentsformof the material stream.
  • 68.
    Prop-005H Revised:Nov7,2012 8 4.13. Thecompositionforthe streamisnow definedandwill model the propertiesof the selectedpetroleum assaythrough the use of hypothetical components. 5. Conclusions Thisexample demonstrateshowtocreate hypothetical componentsandhow toassigna petroleumassaytoa streamin orderto model the assaypropertiesinasimulation. 6. Copyright Copyright© 2012 by AspenTechnology,Inc.(“AspenTech”).All rightsreserved. Thiswork maynot be reproducedordistributedinanyformor byany meanswithoutthe priorwrittenconsentof AspenTech. ASPENTECHMAKESNOWARRANTYOR REPRESENTATION,EITHER EXPRESSEDOR IMPLIED, WITH RESPECT TO THIS WORK and assumesnoliabilityforanyerrors or omissions. Innoeventwill AspenTechbe liable toyoufordamages,includinganylossof profits,lostsavings,orotherincidental orconsequential damagesarisingoutof the use of the informationcontainedin,orthe digital filessuppliedwithor foruse with, thiswork. This workand itscontentsare providedforeducational purposesonly. AspenTech®,aspenONE®,andthe Aspenleaf logo,are trademarksof AspenTechnology,Inc.. Brandsand productnamesmentionedinthisdocumentationare trademarksorservice marksof theirrespective companies.
  • 69.
    Thermo-002H Revised:Nov6,2012 1 Flash Calculationin Aspen HYSYS® V8.0 1. Lesson Objective  Learn howto model aFlash separatorand examine differentthermodynamicmodelstosee how theycompare.  FlashblocksinAspen HYSYS 2. Prerequisites  Aspen HYSYS V8.0 3. Problem We wantto investigate Vapor-Liquidseparationatdifferent pressures,temperaturesandcompositions.Assume youhave a feedwith anequimolarbinarymixture of ethanolandbenzeneat1 bar and 25°C. Examine the followingflashconditionsusingthe heaterblockinAspenHYSYS.Use Vapor-Liquidasthe ValidPhase inthe computation.  Condition#1(P-VFlash):At 1 bar and a vapor fraction of 0.5, findthe equilibriumtemperature and the heat duty.  Condition#2(T-P Flash):At the temperature determined fromCondition#1 and a pressure of 1 bar, verify thatthe flashmodel resultsina vapor fraction of 0.5 at equilibrium.  Condition#3(T-V Flash):Atthe temperature of Condition#1,and a vaporfraction of 0.5, verifythat the flashmodel resultsinan equilibriumpressure of 1bar.  Condition#4(P-Q Flash):At1 bar and withthe heatduty determinedfrom Condition#1, verifythat the temperature andvaporfractionare consistent withprevious conditions.  Condition#5(T-Q Flash):At the temperature andheatdutydeterminedfromCondition#1,verify that the pressure andvaporfraction are consistentwithpreviousconditions. The examplespresentedare solelyintendedtoillustrate specificconceptsand principles. Theymay not reflectan industrial application or real situation. 4. Aspen HYSYS Solution: 4.01. Start AspenHYSYS V8.0. SelectNewtostart a new simulation. 4.02. Create a componentlist. Inthe ComponentLists folderselectAdd. SelectEthanol and Benzene.
  • 70.
    Thermo-002H Revised:Nov6,2012 2 4.03. Createa fluid package. In the Fluid Packages folder select Add, and select NRTL as the property package. 4.04. Go to the simulationenvironment. Clickthe Simulationbuttoninthe bottomleftof the screen. 4.05. Place a Heater blockontothe flowsheetfromthe Model Palette.
  • 71.
    Thermo-002H Revised:Nov6,2012 3 4.06. Doubleclick the Heaterto openthe propertywindow.Create an Inletstreamcalled FEED,an Outlet streamcalled OUT, and an Energy streamcalled Q. 4.07. Specifyconditionsof FEEDstream. Go to the Worksheettaband entera Temperature of 25°C, a Pressure of 1 bar (100 kPa),anda Molar flowof 1 kgmole/h. AlsoenterMole Fractionsof 0.5 foreach componentonthe Compositionform.
  • 72.
    Thermo-002H Revised:Nov6,2012 4 4.08. Condition#1Compute the temperature toget0.5 vapor fractionat 1 bar. In the Conditionsformunder Worksheet,enteraVapour Fraction of 0.5 and a Pressure of 1 bar (100 kPa) for streamOUT. The heaterwill automaticallysolve andyouwill see thatthe calculatedtemperature is 67.03°C. 4.09. Condition#2 Compute vaporfractionat 1 bar andat the temperature obtained inCondition#1. Clear the fieldforVapour Fraction forstreamOUT, thenentera Pressure of 1 bar (100 kPa) and a Temperature of 67.03°C. Inorder to be able to entera temperature,youmustfirstemptythe entry fieldforVapourFraction. This isdone by clickingthe entryfieldand pressingdeleteonthe keyboard. Once a Temperature isentered,the VapourFraction will solve.
  • 73.
    Thermo-002H Revised:Nov6,2012 5 4.10. Condition#3Compute pressure atthe temperature obtainedinCondition#1with0.5 vapor fraction. Delete the value inthe Pressure fieldandenteraVapour Fraction of 0.5. The pressure shouldsolve.
  • 74.
    Thermo-002H Revised:Nov6,2012 6 4.11. Condition#4Compute temperature andvaporfraction at1 bar and usingthe heatduty obtainedin Condition#1. Empty the fieldsforTemperature andVapour Fraction instreamOUT. InstreamOUT entera Pressure of 1 bar. In streamQ, entera Heat Flow of 2.363e004 kJ/h. The Temperature of 67.03°C and Vapour Fraction of .500 are consistentwithCondition#1. 4.12. Condition#5 Compute pressure andvaporfractionat the temperature andheatdutyobtained in Condition#1. In streamOUT, emptythe fieldforPressure. Entera Temperature of 67.03°C. The Pressure and Vapor Fraction shouldbe the same as Condition#1.
  • 75.
    Thermo-002H Revised:Nov6,2012 7 5. Conclusion Youhave gone through the five flashmethodswhichare mostcommoninAspenHYSYS.Here isa brief summary. Flash Method T (C) P (bar) V (-) Q (MJ/hr) P-V Flash 67.03 1 0.5 23.63 T-P Flash 67.03 1 0.5099 23.98 T-V Flash 67.03 1 0.5 23.63 P-Q Flash (or P-H) 67.03 1 0.5 23.63 T-Q Flash (or T-H) 67.03 1 0.5 23.63 Specified Computed FeedCondition:ETHANOL/BEZENE(Equimolarmixture) at1 bar and 25 Celsius.
  • 76.
    Thermo-002H Revised:Nov6,2012 8 6. Copyright Copyright©2012 by AspenTechnology,Inc.(“AspenTech”). All rightsreserved. Thisworkmaynot be reproducedordistributedinanyformor byany meanswithoutthe priorwrittenconsentof AspenTech. ASPENTECHMAKESNOWARRANTYOR REPRESENTATION,EITHER EXPRESSEDOR IMPLIED, WITH RESPECT TO THIS WORK and assumesnoliabilityforanyerrorsor omissions. Innoeventwill AspenTechbe liable toyoufordamages,includinganylossof profits,lostsavings,orotherincidental orconsequential damagesarisingoutof the use of the informationcontainedin,orthe digital filessuppliedwithorforuse with, thiswork. This workand itscontentsare providedforeducational purposesonly. AspenTech®,aspenONE®,andthe Aspenleaf logo,are trademarksof AspenTechnology,Inc.. Brandsand productnamesmentioned inthisdocumentationare trademarksorservice marksof theirrespective companies.
  • 77.
    Thermo-003H Revised:Nov6,2012 1 Steam Tablesin Aspen HYSYS® V8.0 1. Objective Learn howto access SteamTablesinAspen HYSYS,and how to interpretthe SteamTable data. 2. Prerequisites  Aspen HYSYS V8.0 3. Background Aspen HYSYS offers 2typesof SteamTablesPropertiesMethods: Property Method Name Models (Steam Tables) Note ASME Steam ASME 1967 The ASME Steampropertymethodusesthe:  1967 International Associationfor Propertiesof WaterandSteam(IAPWS, http://www.iapws.org) correlationsfor thermodynamicproperties STEAM-TA methodismade upof different correlationscoveringdifferentregionsof the P-T space.These correlationsdonotprovide continuityatthe boundaries,whichcanleadto convergence problemsandpredictwrongtrends. NBS Steam NBS 1984 The NBS Steampropertymethodsusesthe:  1984 International Associationfor Propertiesof WaterandSteam(IAPWS, http://www.iapws.org) correlationsfor thermodynamicproperties Use the NBS Steampropertymethod forpure waterand steamwithtemperature rangesof 273.15 K to 2000 K. The maximumpressure is over10000 bar. The examplespresentedare solelyintendedtoillustrate specificconceptsand principles. Theymay not reflectan industrial application or real situation.
  • 78.
    Thermo-003H Revised:Nov6,2012 2 4. Problem UsingAspenHYSYS, we wantto calculate saturatedsteamproperties from100°C to 300°C. We wouldlike to create a table thatdisplaysmassenthalpy,massentropy,pressure,anddensity. Aspen HYSYS Solution: 4.01. Start AspenHYSYS V8.0. SelectNewto start a new simulation. 4.02. Create a componentlist. Inthe ComponentLists folder,selectAdd. AddWaterto the componentlist. 4.03. Create a fluidpackage. Inthe FluidPackages folder,selectAdd. SelectNBSSteamas the property package. 4.04. Go to the simulationenvironment.
  • 79.
    Thermo-003H Revised:Nov6,2012 3 4.05. Addamaterial streamtothe flowsheetfromthe Model Palette.Double clickonthe streamtoopenthe propertywindow. Rename thisstream STEAMandentera Mole Fraction of 1 forwater. 4.06. In the navigationpane,goto Stream Analysis andclick onthe dropdownarrow nextto Add and select Property Table. In the SelectProcess Stream window thatappears,select STEAMandpress OK. 4.07. Next,double clickon PropertyTable-1to openthe propertywindow. UnderIndependentVariables selectTemperature asVariable 1. Enter a Lower Bound of 100°C and an UpperBound of 300°C. Enter 100 for# of Increments. SelectVapourFraction for Variable 2 andselectState forMode. Entera value of 1 for State Values. We are goingto be varyingthe temperature while holdingthe vapourfraction constantat 1.
  • 80.
    Thermo-003H Revised:Nov6,2012 4 4.08. Wemustnowdefine the dependentpropertiesthatwe are interestedinviewingresultsfor. Goto the Dep. Prop formunderthe Design tab. SelectAdd. Here we will add Mass Enthalpy,Mass Entropy, Pressure,andMass Density.
  • 81.
    Thermo-003H Revised:Nov6,2012 5 4.09. ClickCalculateto generate the propertytable. Resultscanbe viewedinthe Performance tabof the propertytable window.
  • 82.
    Thermo-003H Revised:Nov6,2012 6 5. Conclusion Aftercompletingthisexerciseyoushouldnow be familiarwithhow toaccessandinterpretthermodynamic propertiesforsteamusingAspen HYSYS. 6. Copyright Copyright © 2012 by Aspen Technology, Inc. (“AspenTech”). All rights reserved. This work may not be reproduced or distributed in any form or by any means without the prior written consent of AspenTech. ASPENTECH MAKES NO WARRANTY OR REPRESENTATION, EITHER EXPRESSED OR IMPLIED, WITH RESPECT TO THIS WORK and assumes no liability for any errors or omissions. In no event will AspenTech be liable to you for damages, including any loss of profits, lost savings, or other incidental or consequential damages arising out of the use of the information contained in, or the digital files supplied with or for use with, thiswork. This workand itscontentsare providedforeducational purposesonly. AspenTech®,aspenONE®,andthe Aspenleaf logo,are trademarksof AspenTechnology,Inc.. Brandsand productnamesmentionedinthisdocumentationare trademarksorservice marksof theirrespective companies.
  • 83.
    Thermo-004H Revised:Nov6,2012 1 Heat ofVaporization with Aspen HYSYS® V8.0 1. Lesson Objectives  Learn howto calculate heatof vaporizationusingthe heaterblockinAspen HYSYS  Understandthe impactof heatof vaporizationondistillation 2. Prerequisites  Aspen HYSYS V8.0 3. Background The drivingforce fordistillationisenergy. The mostenergyconsumingpartof a distillationcolumnis the vaporizationof material inthe reboilertocause vaporto flow fromthe bottomof the columntothe topof the column. Heatof vaporizationdeterminesthe amountof energyrequired. Therefore,itisimportanttoknowthe heatof vaporizationof variousspeciesduringsolventselection. Witheverythingelse equal,we shouldselecta componentwithlowerheatof vaporizationsothatwe can achieve the same degree of separationwithless energy. Thisexample containsthree isolated heaterblocks. Each heaterblockis usedtocalculate the heatof vaporizationforapure component. The examplespresentedare solelyintendedtoillustrate specificconceptsand principles. Theymay not reflectan industrial application or real situation.
  • 84.
    Thermo-004H Revised:Nov6,2012 2 4. AspenHYSYS Solution: 4.01. Create a newsimulationin AspenHYSYSV8.0. 4.02. Create a componentlist. Inthe ComponentLists folder,selectAdd. SelectWater,3-methylhexane, and 1,1,2-trichloroethane. 4.03. Create a fluidpackage. Inthe FluidPackages folder,selectAdd. SelectUNIQUACasthe property package and select RK as the Vapour Model. 4.04. Enter the simulationenvironment.
  • 85.
    Thermo-004H Revised:Nov6,2012 3 4.05. Addthreeseparate Heaterblocks to the flowsheet. 4.06. Double clickon E-100 to openthe propertywindow. Thisfirstheaterwill vaporize astreamof pure water. Create an Inletstreamcalled Feed-Water,anOutletstreamcalled Water-Out,andanEnergy streamcalled Q-Water.
  • 86.
    Thermo-004H Revised:Nov6,2012 4 4.07. Goto the Worksheettab. Specifythe feedstreamtobe at a Pressure of 100 kPa, a Vapour Fraction of 0, and witha Molar Flow of 1 kgmole/h. Inthe Compositionformunderthe Worksheettab,entera Mole Fraction of 1 for Water inthe feedstream. Lastly,we mustspecifythe outletpressure andthe outletvapourfraction. Enter 100 kPa for Pressure,and1 forVapour Fraction of the Water-Outstream. The heatershouldsolve.Make note of the Heat Flow of the energystream Q-Water. 4.08. We will nowrepeatthisprocessforheaters E-101 and E-102. E-101 will vaporize 3-methylhexaneandE- 102 will vaporize 1,1,2-trichloroethane. 4.09. Double clickon E-101. Create an Inletstream called Feed-3MH,anOutletstreamcalled 3MH-Out,and an Energy streamcalled Q-3MH.
  • 87.
    Thermo-004H Revised:Nov6,2012 5 4.10. Inthe Worksheettab,for the feedstreamentera Vapour Fraction of 0, a Molar Flowof 1 kgmole/h, and a Pressure of 100 kPa. Inthe Compositionform, enteraMole Fraction of 1 for3-methylhexane in the feedstream. Lastlyspecifythe outletconditionsof 100 kPa for Pressure anda Vapour Fraction of 1. Make note of the Heat Flowfor the energystream.
  • 88.
    Thermo-004H Revised:Nov6,2012 6 4.11. Doubleclick E-102. Create an Inlet streamcalled Feed-1,1,2,anOutletstreamcalled 1,1,2-Out, and an Energy streamcalled Q-1,1,2. 4.12. In the Worksheettab,for the feedstreamentera Vapour Fraction of 0, a Molar Flowof 1 kgmole/h, and a Pressure of 100 kPa. Inthe Compositionform, enteraMole Fraction of 1 for1,1,2- trichloroethane inthe feedstream. Lastlyspecifythe outletconditionsof 100 kPa for Pressure anda Vapour Fraction of 1. Note the Heat Flowof the energystream.
  • 89.
    Thermo-004H Revised:Nov6,2012 7 5. Conclusions Althoughwaterhassmallmolecularweight,itsheatof vaporizationislarge. Heatof vaporizationforwateris about18% higherthanthat of 1,1,2-trichloroethaneandabout30% higherthanthat of 3-methylhexane. Of the three options,3-methylhexane hastolowestheatof vaporizationandwould require the leastamountof energy as a solventina distillation. 6. Copyright Copyright© 2012 by AspenTechnology,Inc.(“AspenTech”).All rightsreserved. Thisworkmaynot be reproducedordistributedinanyformor byany meanswithoutthe priorwrittenconsentof AspenTech. ASPENTECHMAKESNO WARRANTYOR REPRESENTATION,EITHER EXPRESSEDOR IMPLIED, WITH RESPECT TO THIS WORK and assumesnoliabilityforanyerrorsor omissions. Innoeventwill AspenTechbe liable toyoufordamages,includinganylossof profits,lostsavings,orotherincidental orconsequential damagesarisingoutof the use of the informationcontainedin,orthe digital filessuppliedwithorforuse with, thiswork. This workand itscontentsare providedforeducational purposesonly. AspenTech®,aspenONE®,andthe Aspenleaf logo,are trademarksof AspenTechnology,Inc.. Brandsand productnamesmentionedinthisdocumentationare trademarksorservice marksof theirrespective companies.
  • 90.
    Therm-005H Revised:Nov6,2012 1 Simulation ofSteam Engine with Aspen HYSYS® V8.0 1. Lesson Objectives  Learn howto simulate asteamengine withAspen HYSYS  Learn how to specifypumps,heaters,coolers,expanders 2. Prerequisites  Aspen HYSYS V8.0  Introductorythermodynamics 3. Background A steamengine consistsof the followingsteps:  Water ispumpedintoa boiler usingapump.  Water isvaporizedin a boilerandbecomeshigh temperature and pressure steam.  Steamflowsthrougha turbine anddoeswork. The pressure andtemperature godownduringthis step. The steam isalsopartiallycondensed.  The steam isfurthercooledtobe condensedcompletely. Then,itisfedtothe pumpmentionedin the firststepto be re-used. The examplespresentedare solelyintendedtoillustrate specificconceptsand principles. Theymay not reflectan industrial application or real situation. 4. Aspen HYSYS Solution 4.01. Create a newsimulationin AspenHYSYSV8.0. 4.02. Create a componentlist. Inthe ComponentLists folder,selectAdd. AddWaterto the componentlist.
  • 91.
    Therm-005H Revised:Nov6,2012 2 4.03. Createa fluidpackage. Inthe FluidPackages folder,selectAdd.SelectNBSSteam as the property package. 4.04. Go to the simulationenvironmentbyclickingthe Simulationbuttoninthe bottomleftof the screen. In the Home ribbon,selectEuroSIas the Unit Set. 4.05. Enter the simulationenvironment. Adda Heater,a Cooler,a Pump andan Expander as shown inthe flowsheet.
  • 92.
    Therm-005H Revised:Nov6,2012 3 4.06. Doubleclickthe pump(P-100) to openthe pumpspecificationwindow.Createan Inletstreamcalled Liq-Water,anOutlet streamcalledToBoiler,andan Energy streamcalled Q-Pump. 4.07. In the Worksheettab,specifyanoutlet Pressure of 1.2 bar.
  • 93.
    Therm-005H Revised:Nov6,2012 4 4.08. Doubleclickthe heater(E-100). SelectToBoileras the Inletstream, create an Outletstreamcalled HPSteam (highpressure steam),andcreate an Energystream called Q-Heat. 4.09. In the Worksheettab,specifyanoutlet Pressure of 40 bar, and a Temperature of 460°C.
  • 94.
    Therm-005H Revised:Nov6,2012 5 4.10. Doubleclickthe expander(K-100). SelectHPSteamasthe Inletstream, create an Outletstreamcalled LPSteam, andcreate an Energystream called Q-Expand.
  • 95.
    Therm-005H Revised:Nov6,2012 6 4.11. Inthe Worksheettab,specifyanoutlet Pressure of 1 bar.
  • 96.
    Therm-005H Revised:Nov6,2012 7 4.12. Doubleclickthe cooler(E-101).Selectan Inlet streamof LPSteam, an Outletstreamof Liq-Water,and create an Energy streamcalled Q-Cool.
  • 97.
    Therm-005H Revised:Nov6,2012 8 4.13. Inthe Worksheettab,specifyanoutlet VapourFraction of 0 anda Pressure of 1 bar. 4.14. The flowsheetisnowreadytosolve. All thatislefttodo isto specifythe compositionandflowrate of a streamwithinthe loop. Double clickonstream Liq-WaterandspecifyaMole Fraction of 1 for Water and a Mass Flow if 10,000 kg/h.
  • 98.
  • 99.
    Therm-005H Revised:Nov6,2012 10 4.15. Theflowsheetshouldnowsolve. 5. Conclusions The steam engine systemcanbe simulatedusingAspen HYSYS. Thisflowsheetclearlyshowswhereenergyis beinginputtothe systemandwhere energyisbeingreleased. 6. Copyright Copyright© 2012 by AspenTechnology,Inc.(“AspenTech”). All rightsreserved. Thisworkmaynot be reproducedordistributedinanyformor byany meanswithoutthe priorwrittenconsentof AspenTech. ASPENTECHMAKESNOWARRANTYOR REPRESENTATION,EITHER EXPRESSEDOR IMPLIED, WITH RESPECT TO THIS WORK and assumesnoliabilityforanyerrorsor omissions. Innoeventwill AspenTechbe liable toyoufordamages,includinganylossof profits,lostsavings,orotherincidental orconsequential damagesarisingoutof the use of the informationcontainedin,orthe digital filessuppliedwithorforuse with, thiswork. This workand itscontentsare providedforeducational purposesonly. AspenTech®,aspenONE®,andthe Aspenleaf logo,are trademarksof AspenTechnology,Inc.. Brandsand productnamesmentionedinthisdocumentationare trademarksorservice marksof theirrespective companies.
  • 100.
    Thermo-006H Revised:Nov6,2012 1 Illustration ofRefrigeration with Aspen HYSYS® V8.0 1. Lesson Objectives  Learn howto specify compressors,heaters,andvalvesinAspen HYSYS  Understand a refrigerationloop 2. Prerequisites  Aspen HYSYS V8.0  Introductorythermodynamics 3. Background In a typical refrigerationsystem,the refrigerantstartsatroom temperature andambientpressure. It is compressed, whichincreasesthe refrigerant’stemperature andpressuresoitisa superheatedvapor. The refrigerantiscooledbyairwitha fan sothat it isclose to room temperature. Atthispoint,itspressure remains highand the refrigeranthasbeencondensedto a liquid. Then,the refrigerantisallowedtoexpandthrough an expansionvalve. Itspressure decreasesabruptly,causingflashevaporation,whichreduces the refrigerant’s temperature significantly. The verycoldrefrigerantcanthencool a fluidpassedacrossa heatexchanger(e.g., air inan air conditioner). Of course,foran ACunitto work,the airthat is usedto cool downthe super-heated refrigerantmustbe airoutside of the room;the airthat is cooledbythe coldrefrigerantisthe air inside the room. The examplespresentedare solelyintendedtoillustrate specificconceptsand principles. Theymay not reflectan industrial application or real situation. 4. Aspen HYSYS Solution Problem Statement Determine the coolingcapacityof 300 kgmole/hof CFH2-CF3 whenallowedtoexpandfrom10bar to 1 bar.
  • 101.
    Thermo-006H Revised:Nov6,2012 2 Aspen HYSYSSolution 4.01. Create a newsimulationin AspenHYSYSV8.0. 4.02. Create a componentlist. Inthe ComponentLists folderselectAdd. Add1,1,1,2-tetrafluoroethane to the componentlist. 4.03. Create a fluidpackage. Inthe FluidPackages folder,selectAdd.SelectNRTL as the propertypackage. 4.04. Move to the simulation environment. Clickthe Simulationbuttoninthe bottomleftof the screen. In the Home ribbon,selectEuroSi as the UnitSet. 4.05. Adda Compressor,a Cooler,a Heater, and a Valve to the mainflowsheet.
  • 102.
    Thermo-006H Revised:Nov6,2012 3 4.06. Doubleclickonthe compressor(K-100). Create an Inletstreamcalled Vapor,an Outlet streamcalled SuperHeat-Vapor,andan Energy streamcalled Q-Comp.
  • 103.
    Thermo-006H Revised:Nov6,2012 4 4.07. Inthe Worksheettab,specifyanoutlet Pressure of 10 bar.
  • 104.
    Thermo-006H Revised:Nov6,2012 5 4.08. Doubleclickthe Cooler(E-100). SelectSuperHeat-Vaporasthe Inletstream, create an Outlet stream calledLiquid,andcreate an Energy streamcalled Q-Cool. 4.09. In the Worksheettab,specifyanoutlet Temperature of 30°C. Inthe Parametersform underthe Design tab, entera Delta P of 0.
  • 105.
    Thermo-006H Revised:Nov6,2012 6 4.10. Doubleclickthe valve (VLV-100). Selectstream Liquidasthe Inlet streamandcreate an Outletstream calledLowP.
  • 106.
    Thermo-006H Revised:Nov6,2012 7 4.11. Inthe Worksheettabspecifyanoutlet Pressure of 1 bar.
  • 107.
    Thermo-006H Revised:Nov6,2012 8 4.12. Doubleclickonthe heater(E-101). SelectstreamLowP as the Inletstream, selectstream Vaporas the Outletstream,and create an Energy streamcalled Q-Heat. 4.13. In the Worksheettab,specifyanoutlet Temperature of 25°C. Inthe Parametersform underthe Design tab, specifyaDelta P of 0.
  • 108.
    Thermo-006H Revised:Nov6,2012 9 We mustnowspecifythemolarflowrate andcompositionof the refrigerant. Double clickanystream, for example stream Liquid. EnteraMolar Flow of 300 kgmole/h. In the Compositionformspecifya Mole Fraction of 1 for the refrigerant.
  • 109.
  • 110.
    Thermo-006H Revised:Nov6,2012 11 4.15. Checkresults.Toviewthe coolingcapacityof thisrefrigerationloop,doubleclickenergystream Q-Heat. The stream isremoving 1.26e006 kcal/h, or approximately350kcal/sec. 5. Conclusions Refrigerationisaprocesswhere heatmovesfromacolderlocationtoa hotterone usingexternal work(e.g.,a compressor). We knowthatvaporizationof a liquidtakesheat. If there isnoexternal heatavailable,the heat will come fromthe liquiditself byreducingitsowntemperature. 6. Copyright Copyright© 2012 by AspenTechnology,Inc.(“AspenTech”). All rightsreserved. Thisworkmaynot be reproducedordistributedinanyformor byany meanswithoutthe priorwrittenconsentof AspenTech. ASPENTECHMAKESNOWARRANTYOR REPRESENTATION,EITHER EXPRESSEDOR IMPLIED, WITH RESPECT TO THIS WORK and assumesnoliabilityforanyerrorsor omissions. Innoeventwill AspenTechbe liable toyoufordamages,includinganylossof profits,lostsavings, orotherincidental orconsequential damagesarisingoutof the use of the informationcontainedin,orthe digital filessuppliedwithorforuse with, thiswork. This workand itscontentsare providedforeducational purposesonly. AspenTech®,aspenONE®,andthe Aspenleaf logo,are trademarksof AspenTechnology,Inc.. Brandsand productnamesmentionedinthisdocumentationare trademarksorservice marksof theirrespective companies.
  • 111.
    Thermo-007H Revised:Nov6,2012 1 Maximum Fillup in Propane Tanks with Aspen HYSYS® V8.0 Using a Spreadsheet 1. Lesson Objectives  How to calculate the maximumliquidlevel inpropane tanks  How to accessstreamvariablesinAspen HYSYS  How to configure aheaterblock  How to use the Spreadsheettool toperformcustomizedcalculations 2. Prerequisites  Aspen HYSYS V8.0 3. Background Whena propane tank isfilledat25°C, we needtoleave enoughvolumefor liquidpropaneexpansiondue toan increase intemperature. The hottestweathereverrecordedisabout58°C. In real life practices,propane tanks are onlyfilledupto80-85% of the tank volume. Why? We know that propane expandswhenitisheatedup. However,why80-85%? We can answerthisquestionbyusingasimple flashcalculationinAspen HYSYS. The examplespresentedare solelyintendedtoillustrate specificconceptsand principles. Theymay not reflectan industrial application or real situation. 4. Problem Statement and Aspen HYSYS Solution Problem Statement Propane tanksare filledat25°C withliquefiedpropane. These tankswill be storedandusedinanenvironment at 1 bar and ambienttemperature. Howmuch,intermsof volume %, caneach tankbe filledup to?
  • 112.
    Thermo-007H Revised:Nov6,2012 2 Aspen HYSYSSolution 4.01. Create a newsimulationin AspenHYSYSV8.0. 4.02. Create a componentlist. Inthe ComponentLists folderselectAdd.AddPropane to the componentlist. 4.03. Create a fluidpackage. Inthe FluidPackagers folder,selectAdd.SelectPeng-Robinsonasthe property package. 4.04. Go to the simulationenvironment. Clickthe Simulationbuttoninthe bottomleftof the screen. 4.05. Adda Heaterto the flowsheet.
  • 113.
    Thermo-007H Revised:Nov6,2012 3 4.06. Doubleclickonthe heater(E-100). Create an Inletstream, an Outletstream, and an Energy stream, named1, 2, andQ, respectively.
  • 114.
    Thermo-007H Revised:Nov6,2012 4 4.07. Definefeedstream. Goto the Worksheettab. For the feedstream, entera Vapour Fraction of 1, a Temperature of 25°C, and a Molar Flowof 1 kgmole/h. Inthe Compositionform, enter1 forMole Fraction of propane.
  • 115.
    Thermo-007H Revised:Nov6,2012 5 4.08. Specifyoutletconditions. Forthe outletstream, entera Vapour Fraction of 0, and a Temperature of 58°C. The heatershouldsolve. 4.09. Adda Spreadsheettothe flowsheettocalculate the maximumpercenttofill the propane tanktoallow for expansionwhenheated.
  • 116.
    Thermo-007H Revised:Nov6,2012 6 4.10. Doubleclickthe spreadsheet(SPRDSHT-1). Go to the Spreadsheettaband enterthe followingincells A1, A2, andA3.
  • 117.
    Thermo-007H Revised:Nov6,2012 7 4.11. Nowwewill linkflowsheetvariablestothe spreadsheet. Rightclickoncell B1 and selectImport Variable.Make the followingselectionstoimportthe MolarDensity of stream1. Click OK when complete. 4.12. Rightclickon cell B2 andselectImport Variable to importthe Molar Densityof stream2. Make the followingselectionsandclick OK.
  • 118.
    Thermo-007H Revised:Nov6,2012 8 4.13. Thespreadsheetshouldnowlooklike the following. 4.14. Next,clickcell B3 andenter“=(B2/B1)*100”. Thisdividesthe molardensityat58°C bythe molardensity at 25°C. The resultingnumberisthe percentage thatapropane tank shouldbe filledat25°C to allowfor thermal expansionuptoa temperature of 58°C. 4.15. The maximumfill %of propane at 25°C is87.86%, as seeninthe spreadsheet.
  • 119.
    Thermo-007H Revised:Nov6,2012 9 5. Conclusions Thecalculation shows that the maximum fill up is 87.8% if the ambient temperature doesn’t exceed 58 °C. To accommodate special cases, typically, propane tanks are filled up to 80-85%. After completing this exercise you shouldbe familiarwithhowtocreate a spreadsheettoperformcustomcalculations. It is important to note that, in real life, the content in a filled propane tank is typically a mixture instead of pure propane. In addition to propane, the mixture also has a few other light components such as methane and ethane. Therefore, to carry out calculations for a real project, we need to know the compositions of the mixture we are dealingwith. 6. Copyright Copyright © 2012 by Aspen Technology, Inc. (“AspenTech”). All rights reserved. This work may not be reproduced or distributed in any form or by any means without the prior written consent of AspenTech. ASPENTECH MAKES NO WARRANTY OR REPRESENTATION, EITHER EXPRESSED OR IMPLIED, WITH RESPECT TO THIS WORK and assumes no liability for any errors or omissions. In no event will AspenTech be liable to you for damages, including any loss of profits, lost savings, or other incidental or consequential damages arising out of the use of the information contained in, or the digital files supplied with or for use with, thiswork. This workand itscontentsare providedforeducational purposesonly. AspenTech®, aspenONE®, and the Aspen leaf logo, are trademarks of Aspen Technology, Inc.. Brands and productnamesmentionedinthisdocumentationare trademarksorservice marksof theirrespective companies.
  • 120.
    Thermo-013H Revised:Nov7,2012 1 Generate PTEnvelope with Aspen HYSYS® V8.0 1. Lesson Objectives  Learn howto generate PTenvelopesinAspen HYSYS 2. Prerequisites  Aspen HSYSY V8.0 3. Background It isveryimportantto knowthe phase conditionsof amixture ata giventemperatureandpressure. For example,the phase conditionsof afluidina heatexchangerhave animpacton the heat transferrate. Formationof bubbles(vaporphase) ininletstreamscanalsobe verydamagingtopumps. The phase conditions of a fluidina pipe canimpact pipeline calculations. The PT envelope foragivenmixture providesacomplete picture of phase conditionsforagivenmixture. The examplespresentedare solely intendedtoillustrate specificconceptsand principles. Theymay not reflectan industrial application or real situation. 4. Aspen HYSYS Solution 4.01. Start AspenHYSYS V8.0 andstart a new simulation. 4.02. Create a componentlist. Inthe ComponentLists folderselectAdd. AddEthane and n-Pentane tothe componentlist.
  • 121.
    Thermo-013H Revised:Nov7,2012 2 4.03. Definepropertypackage. Inthe FluidPackagesfolderselectAdd. SelectPeng-Robinsonasthe propertypackage. 4.04. Go to the simulationenvironmentbyclickingthe Simulationbuttoninthe bottomleftof the screen. 4.05. Adda Material Stream to the flowsheet. Tocreate a PT Envelope we mustperforma StreamAnalysis, and inorderto performa StreamAnalysiswe needamaterial stream.
  • 122.
    Thermo-013H Revised:Nov7,2012 3 4.06. Doubleclickthe material stream(1). Entera Molar Flow of 100 kg/h. In the Compositionformenter Mass Fractions of 0.5 foreach component. 4.07. Rightclickon the streamand select Create Stream Analysis| Envelope.
  • 123.
    Thermo-013H Revised:Nov7,2012 4 4.08. Inthe Envelope window,gotothe Performance tab. Here you will see aPT Envelope. Note thatyou can change the Envelope type usingthe radiobuttonsinthe bottomrightcorner of the window. Onthe graph,the blue line representsthe dew pointandthe redline representsthe bubble point. The area betweenthe lines representsthe 2-phase region.
  • 124.
    Thermo-013H Revised:Nov7,2012 5 5. Conclusions WiththePT envelope of amixture,we candetermine itsphase conditionsforagiventemperature andpressure. 6. Copyright Copyright© 2012 by AspenTechnology,Inc.(“AspenTech”). All rightsreserved. Thisworkmaynot be reproducedordistributedinanyformor byany meanswithoutthe priorwrittenconsentof AspenTech. ASPENTECHMAKESNOWARRANTYOR REPRESENTATION,EITHER EXPRESSEDOR IMPLIED, WITH RESPECT TO THIS WORK and assumesnoliabilityforanyerrorsor omissions. Innoeventwill AspenTechbe liable toyoufordamages,includinganylossof profits,lostsavings,orotherincidental orconsequential damagesarisingoutof the use of the informationcontainedin,orthe digital filessuppliedwithorforuse with, thiswork. This workand itscontentsare providedforeducational purposesonly. AspenTech®,aspenONE®,andthe Aspenleaf logo,are trademarksof AspenTechnology,Inc.. Brandsand productnamesmentionedinthisdocumentationare trademarksorservice marksof theirrespective companies.
  • 125.
    Thermo-014H Revised:Nov7,2012 1 Retrograde BehaviorIllustrated with Aspen HYSYS® V8.0 1. Lesson Objectives  Observe retrograde behavior 2. Prerequisites  Aspen HYSYS V8.0  Completionof teachingmodule Thermo-013 3. Background For a mixture,the amountof liquid(liquidfraction) increasesas pressure increasesatconstanttemperature. However,inthe retrograde regionnearthe critical region,we maysee some interestingbehavior—vapor fractionincreasesaspressure increases(atconstanttemperature). Many mixtureshave retrograde behavior nearthe critical region. Inthisexample,we will examine the retrograde behaviorusingabinary mixture of ethane and pentane. The examplespresentedare solelyintendedtoillustrate specificconceptsand principles. Theymay not reflectan industrial application or real situation. 4. Problem Statement and Aspen HYSYS Solution Problem Statement Retrograde behaviorcanbe observedinthe mixture of ethane andpentane.InAspen HYSYS,use PTEnvelope to determine the critical regionof the mixture.Then,use aPropertyTable toexamine the retrograde behaviornear the critical region.
  • 126.
    Thermo-014H Revised:Nov7,2012 2 Aspen HYSYSSolution 4.01. Openthe file titled Thermo-14H_Retrograde_Behavrior_Start.hsc. Thisisidentical tothe file thatwas createdinlessonThermo-013H_PT_Envelope. 4.02. In the PT Envelope that appearsinthe Performance tab of the Envelope window,notice thatthere isa regionnearthe critical pointwhere the vaporfractionwill increase aspressure increaseswhile temperature isheldconstant.
  • 127.
    Thermo-014H Revised:Nov7,2012 3 4.03. Wecan demonstrate thisbehaviorbycreatingapropertytable inHYSYS. In the Stream Analysisfolder inthe NavigationPane,click the dropdownarrow nextto Add and selectPropertyTable. Selectstream 1 and click OK.
  • 128.
    Thermo-014H Revised:Nov7,2012 4 4.04. Doubleclick PropertyTable-1. SelectTemperature forVariable 1 andselectState forMode. Entera State value of 115°C. SelectPressure forVariable 2 and Incremental forMode. Entera Lower Bound of 60 bar, an UpperBound of 69 bar, and a # of Incrementsof 20. 4.05. In the Dep. Prop formunderthe Design tab click Add. SelectVapourFraction and click OK.
  • 129.
    Thermo-014H Revised:Nov7,2012 5 4.06. ClickCalculate.Oncecomplete,gotothe Performance tab. Here youcan view the resultsineithertable or plotform. Go to Plotsand selectViewPlot. 4.07. From the plotyoucan clearlysee the regionwhere increasingthe pressure will cause the vapour fractionto increase. 5. Conclusions For the binarymixture of ethane andpentane (50% eachon massbasis),we observedthatvaporfraction increasesfrom0.701457 to 1 as pressure increasesfrom65.22 bar to 66.78 bar, whichisa retrograde behavior. Thisretrograde behaviorcanbe a source of multiple solutionsto process simulation. 6. Copyright Copyright© 2012 by AspenTechnology,Inc.(“AspenTech”).All rightsreserved. Thisworkmaynot be reproducedordistributedinanyformor byany meanswithoutthe priorwrittenconsentof AspenTech. ASPENTECHMAKESNOWARRANTYOR REPRESENTATION,EITHER EXPRESSEDOR IMPLIED, WITH RESPECT TO THIS WORK and assumesnoliabilityforany errorsor omissions. Innoeventwill AspenTechbe
  • 130.
    Thermo-014H Revised:Nov7,2012 6 liable toyoufordamages,includinganylossofprofits,lostsavings,orotherincidental orconsequential damagesarisingoutof the use of the informationcontainedin,orthe digital filessuppliedwithorforuse with, thiswork. This workand itscontentsare providedforeducational purposesonly. AspenTech®,aspenONE®,andthe Aspenleaf logo,are trademarksof AspenTechnology,Inc.. Brandsand productnamesmentionedinthisdocumentationare trademarksorservice marksof theirrespective companies.
  • 131.
    Thermo-019H Revised:Nov 7,2012 1 RemoveHydrogen from Methane, Ethylene and Ethane with Aspen HYSYS® V8.0 1. Lesson Objectives  Learn howto remove bulkof hydrogenusinga cooleranda vapor liquidseparator  Learn howto use adjustblockand spreadsheets 2. Prerequisites  Aspen HYSYS V8.0  Introductiontovapor-liquidequilibrium 3. Background In an ethyleneplant, we have afeedstreamcontaininghydrogen,methane,ethylene,andethane. Before this streamcan be fedto the demethanizer, hydrogenmustbe removedsothe volumetricflow isless,which decreasesthe requiredsizeforthe demethanizercolumn. Because hydrogen hasamuch highervaporpressure than the othercomponents,one ormore flashdrumscan be usedfor hydrogenremoval. The examplespresentedare solelyintendedtoillustrate specificconceptsand principles. Theymay not reflectan industrial application or real situation. 4. Problem Statement and Aspen HYSYS Solution Problem Statement The feedstreamisa combinationof 6,306 lb/hrof hydrogen,29,458 lb/hrof methane,26,049 lb/hrof ethylene, and 5,671 lb/hrof ethane.The mole fractionof hydrogeninthe feedstreamisgreaterthan0.51, indicatinga large volume of hydrogeninthe feedstream. There are twogoalsforthissectionof the process:  Afterbulkof hydrogen isremoved,the streamcontainslessthan0.02 mole fractionof hydrogen  Loss of ethylene tothe hydrogen streamshouldbe lessthan1%
  • 132.
    Thermo-019H Revised:Nov 7,2012 2 AspenHYSYS Solution 4.01. Create a newsimulationin AspenHYSYSV8.0. 4.02. Create a componentlist. Inthe ComponentLists folderselectAdd. AddHydrogen, Methane,Ethylene, and Ethane to the componentlist. 4.03. Define propertypackage. Inthe FluidPackagesfolderselectAdd. SelectPeng-Robinsonasthe propertypackage. 4.04. Go to the simulationenvironment. Clickthe Simulationbuttoninthe bottomleftcornerof the screen. 4.05. Adda Coolerblockto the flowsheetfromthe Model Palette.
  • 133.
    Thermo-019H Revised:Nov 7,2012 3 4.06.Double clickthe cooler(E-100). Create an Inlet streamcalled Feed,anOutletstreamcalled ToSep,and an Energy streamcalled Q-Cool.
  • 134.
    Thermo-019H Revised:Nov 7,2012 4 4.07.In the Parameters form,entera Delta P of 0, anda Duty of 0 kcal/h. We will create anadjustblockto vary the dutyto reach the desired specifications.
  • 135.
    Thermo-019H Revised:Nov 7,2012 5 4.08.Define feedstream. Goto the Worksheettab. Entera Temperature of -90°F (-67.78°C),and a Pressure of 475 psia (32.75 bar). 4.09. Define composition. Goto the Compositionformand enterthe following MassFlowratesin kg/h.
  • 136.
    Thermo-019H Revised:Nov 7,2012 6 4.10.Adda Separator to the flowsheetfromthe Model Palette. 4.11. Double clickthe separator(V-100). SelectstreamToSepas the Inletstream, andcreate Outletstreams calledVapand Liq.
  • 137.
    Thermo-019H Revised:Nov 7,2012 7 4.12.Go to the Worksheettabto viewthe separationresults. Youcan see thatthe liquidstreamhasa flowrate of 0. We mustnowadd an adjustblockand a spreadsheettofindthe coolerduty requiredto limitthe lossof ethylenetothe vaporstreamto lessthan1%.
  • 138.
    Thermo-019H Revised:Nov 7,2012 8 4.13.Adda Spreadsheettothe flowsheetfromthe Model Palette. 4.14. Double clickonthe spreadsheet(SPRDSHT-1). Inthe Spreadsheettabenter“Ethylene flowin Feed”in cell A1, and “Ethylene flowin Liq stream” incell A2. Right clickoncell B1 and selectImportVariable. Selectthe MasterComp Molar Flow (Ethylene) inthe Feedstream. Rightclickcell B2 and selectImport Variable. Selectthe Master CompMolar Flow (Ethylene) inthe Liqstream.
  • 139.
    Thermo-019H Revised:Nov 7,2012 9 4.15.Enter the text“FractionEthylene Lost” in cell A3. Incell B3 enterthe followingformula: =(B1-B2)/B1. 4.16. You can see that rightnowwe are losing100% of the Ethylene to the vapor stream. We will nowaddan adjustblockto vary the coolerdutyinorder to limitthe fractionlosttounder0.01. Addan Adjust block to the flowsheetfromthe Model Palette.
  • 140.
    Thermo-019H Revised:Nov 7,2012 10 4.17.Double clickonthe adjustblock(ADJ-1). Specifythe AdjustedVariable tobe the Duty of coolerblock E- 100. Specifythe TargetVariable to be cell B3 of SPRDSHT-1. Entera SpecifiedTargetValue of 0.01.
  • 141.
    Thermo-019H Revised:Nov 7,2012 11 4.18.In the Parameters tab entera StepSize of 1e+005 kcal/h and change the Maximum Iterationsto 100. ClickStart to begincalculations.
  • 142.
    Thermo-019H Revised:Nov 7,2012 12 4.19.The fractionof ethylenelostinthe vaporstreamwill now be lessthan1%. We must alsomake sure that the Mole Fraction of Hydrogen inthe liquidstreamislessthan0.02. Double clickthe Liq streamand go to the Compositionformunderthe Worksheettab. 4.20. The Mole Fraction of hydrogeninthe liquidstreamis 0.0172, whichislessthanthe specifiedvalue of 0.02.
  • 143.
    Thermo-019H Revised:Nov 7,2012 13 5.Conclusions The vapor pressure of hydrogenis muchhigher(6,600 timeshigherthanmethane at -150 °C) than the vapor pressuresof the othercomponents inthe feedstream. We used the adjustblockanda spreadsheetto determine agoodvalue forthe heatdutyof the coolerblock to remove the bulkof hydrogenfromthe feed streamthrougha separatorblock. 6. Copyright Copyright© 2012 by AspenTechnology,Inc.(“AspenTech”). All rightsreserved. Thisworkmaynot be reproducedordistributedinanyformor byany meanswithoutthe priorwrittenconsentof AspenTech. ASPENTECHMAKESNOWARRANTYOR REPRESENTATION,EITHER EXPRESSEDOR IMPLIED, WITH RESPECT TO THIS WORK and assumesnoliabilityforanyerrorsor omissions. Innoeventwill AspenTechbe liable toyoufordamages,includinganylossof profits,lostsavings,orotherincidental orconsequential damagesarisingoutof the use of the informationcontainedin,orthe digital filessuppliedwithorforuse with, thiswork. This workand itscontentsare providedforeducational purposesonly. AspenTech®,aspenONE®,andthe Aspenleaf logo,are trademarksof AspenTechnology,Inc.. Brandsand productnamesmentionedinthisdocumentationare trademarksorservice marksof theirrespective companies.
  • 144.
    Thermo-020H Revised:Nov7,2012 1 Use ofa Decanter to Recover Solvent and Cross Distillation Boundaries with Aspen HYSYS® V8.0 1. Lesson Objectives  Use a 3 phase separatorto recoversolvent 2. Prerequisites  Aspen HYSYS V8.0  Introductiontoliquid-liquidequilibrium 3. Background In an anhydrousethanol productionplant,cyclohexane isusedasanentrainerduringseparationtobreakthe ethanol-waterazeotrope. The streamfromthe topof the firstdistillationcolumnistypicallyamixture witha compositionthatisveryclose to the ternary azeotrope. Since cyclohexane andwaterare notmiscible,a decantercan be usedto separate cyclohexanefromthe ethanol andwater. The secondrole of thisliquid-liquid separationistocross distillationboundaries. One of the twooutletstreamsfromthe decanterisrecovered solvent. The otherstreamhasa compositioninthe ethanol-richdistillationregionandisfedtothe second column. The examplespresentedare solelyintendedtoillustrate specificconceptsand principles. Theymay not reflectan industrial application or real situation. 4. Use of a Decanter for solventrecovery Problem Statement A 100 kmol/hrfeedstreamthatis35 mol-%ethanol,6mol-% water,and59 mol-% cyclohexane isfedtoa decanter. Determine the compositionsof the twooutletstreamsfromthe decanterandtheirflowrates.
  • 145.
    Thermo-020H Revised:Nov7,2012 2 Aspen HYSYSSolution 4.01. Start AspenHYSYS V8.0 andcreate a new simulation. 4.02. Create a componentlist. Inthe ComponentLists folderselectAdd.AddEthanol,Water, and Cyclohexane tothe componentlist. 4.03. Define propertypackage. Inthe FluidPackagesfolderselectAdd. SelectUNIQUACasthe property package. In the Activity Model Specifications grid,selectRKforVapour Model. 4.04. Go to the simulationenvironment. Clickthe Simulationbuttoninthe bottomleftof the screen. 4.05. Adda 3-Phase Separator to the flowsheetfromthe Model Palette.
  • 146.
    Thermo-020H Revised:Nov7,2012 3 4.06. Doubleclickthe 3 phase separatorvessel (V-100). Create an Inletstreamcalled Feed,andthree Outlets calledVapor,Liquid1, andLiquid2.
  • 147.
    Thermo-020H Revised:Nov7,2012 4 4.07. Definefeedstream. Goto the Worksheettab. Entera Temperature of 25°C, a Pressure of 1 bar, and a Molar Flow of 100 kgmole/h. 4.08. In the CompositionformenterMole Fractions of 0.35 forethanol,0.06 forwater, and 0.59 for cyclohexane. The separatorshouldsolve whencompositionsare complete.
  • 148.
    Thermo-020H Revised:Nov7,2012 5 4.09. Checkresults.Youcan see that the feedstreamwasseparatedintotwoseparate liquidstreams because of a differenceindensitybetweenthe twoliquidphases. Stream Liquid1hasflowrate of 54.6 kgmole/h,while the heavierstream Liquid2hasa flowrate of 45.4 kgmole/h.
  • 149.
    Thermo-020H Revised:Nov7,2012 6 4.10. Checkstreamcomposition.StreamLiquid1isenrichedincyclohexane whilestreamLiquid2isenriched inethanol.
  • 150.
    Thermo-020H Revised:Nov7,2012 7 5. Conclusions ADecantercan be usedto concentrate cyclohexanefrom59% to 78% so it can be recycled orrepurposed.The otheroutlet(Liquid2) hasacompositioninadifferentdistillationregionfromthe Feedstream, providinga productthat crossesdistillation boundaries.Thisservesasthe decanter’ssecond role mentionedinthe backgroundsection. 6. Copyright Copyright© 2012 by AspenTechnology,Inc.(“AspenTech”). All rightsreserved. Thisworkmaynot be reproducedordistributedinanyformor byany meanswithoutthe priorwrittenconsentof AspenTech. ASPENTECHMAKESNOWARRANTYOR REPRESENTATION,EITHER EXPRESSEDOR IMPLIED, WITH RESPECT TO THIS WORK and assumesnoliabilityforanyerrorsor omissions. Innoeventwill AspenTechbe liable toyoufordamages,includinganylossof profits,lostsavings,orotherincidental orconsequential damagesarisingoutof the use of the informationcontainedin,orthe digital filessuppliedwithorforuse with, thiswork. This workand itscontentsare providedfor educational purposesonly. AspenTech®,aspenONE®,andthe Aspenleaf logo,are trademarksof AspenTechnology,Inc.. Brandsand productnamesmentionedinthisdocumentationare trademarksorservice marksof theirrespective companies.
  • 151.
  • 152.
    Dist-001H Revised:Nov7,2012 1 Distillation ofClose Boiling Components with Aspen HYSYS® V8.0 1. Lesson Objectives  Distillation columnmodeling  Columnprofiles  Customstreamresults  Material balance across distillationcolumn 2. Prerequisites  AspenHYSYS V8.0  Experience insertingblocksandconnectingstreamsin HYSYS  Introductiontovaporliquidequilibrium 3. Background Ethylene isanimportantmonomer,andismade fromethane. The conversionof the reactionisnotperfect,so the ethylene mustbe separatedfromthe system. Ethane andethyleneare molecularlysimilar,andsoare difficulttoseparate. The difficultyof the separationiscompoundedbythe factthat polymerproduction requiresextremelypure feedstocks. The examplespresentedare solelyintendedtoillustrate specificconceptsand principles. Theymay not reflectan industrial application or real situation. 4. Problem Statement and Aspen HYSYS Solution Problem: A stream containing 68.5wt% ethylene with a total flowrate of 7.3 million lb/day is fed into a distillation column consisting of 125 stages. It is desired to produce a distillate product stream containing a minimum of 99.96 wt% ethylene with a total flowrate of 5 million lb/day. It is also desired that the bottoms productcontainsno more than 0.10wt% ethylene.Determineif thisseparationisfeasible.
  • 153.
    Dist-001H Revised:Nov7,2012 2 Assumptions: - 100%tray efficiency - Total condenser - 300 psigcolumnoperatingpressure - A refrigerantutilitystreamcapable of condensingthe ethylene mixture(notincludedin model) - Feedmixture isat350 psig andis a vapor - 125 stages - Feedenters the columnatstage 90 - Peng-Robinsonequationof state AspenHYSYS Solution: 4.01. Start AspenHYSYS V8. SelectNewto start a new simulation. 4.02. Create a ComponentList. In the Propertiesenvironment,selectthe ComponentListsfolderinthe navigationpane andclick Add to adda new HYSYS componentlist. In ComponentList– 1 addEthane and Ethylene tothe selectedcomponentslist. Youmayneedtouse the searchfunctionbytypingin ethene andpressingentertofindthe componentethylene.
  • 154.
    Dist-001H Revised:Nov7,2012 3 4.03. Createa Fluid Package. Click on the Fluid Packages folder in the navigation pane and select Add to add a new HYSYS fluid package. Select Peng-Robinson as the property package. The Peng-Robinson equation of state istypicallyusedtomodel systemscontaininghydrocarbonsathighpressures. 4.04. You are now ready to enter the simulation environment and construct the flowsheet. Go to the simulation environment by clicking the Simulation button at the bottom left of the screen. On the main flowsheetinsertaDistillationColumnSub-Flowsheetfromthe Model Palette underthe Columnstab.
  • 155.
    Dist-001H Revised:Nov7,2012 4 4.05. Doubleclick on the Distillation unit on the main flowsheet, or go to UnitOps | T-100 in the navigation pane. The Distillation Column Input Expert window will appear. Here we will create the feed and product streams, as well as define the operating conditions of the column. On the first page, enter 125 for # Stages and define the feedandproductstreamsas shownbelow.
  • 156.
    Dist-001H Revised:Nov7,2012 5 4.06. ClickNext and page 2 will appear. This page allows you to configure the reboiler. Select Regular Hysys reboilerforReboilerType Selection,andselectthe Once-throughradiobutton. Click Next. 4.07. This next page allows you to input the pressure and pressure drop in the condenser and reboiler. Enter a Condenser Pressure and Reboiler Pressure of 300 psig (2170 kPa). This indicates that there is no pressure dropthroughthe column,whichisacceptable forthissimplifiedexample. 4.08. Click Next. This page (page 4 of 5) allows you to enter optional temperature estimates for the condenser, top stage, and reboiler. In this case we will leave these fields blank. Click Next. The final page allows you enter a liquid distillate rate or a reflux ratio. From our problem statement, we know that distillate rate will be 5 million lb/day of ethylene. Select Mass for Flow Basis and enter 5000000 lb/day (94498.4 kg/h) for LiquidRate. SelectDone to enterthe columnpropertywindow. 4.09. We must first define the feed stream going into the column. In the Column property window, go to the Worksheet tab. On the Conditions form, enter a pressure of 350 psig (2514 kPa), a Vapour fraction of 1, and a Mass Flow of 7.3e+06 lb/day (1.380e+005 kg/h) for the Feed@COL1 stream. Go to the Compositions sheet in the Worksheet tab. Here we will define the composition of the feed stream. Type a number into the Feed composition grid for Ethane to open the Input Composition for Stream window. Select the Mass Fractions radio button, enter 0.315 for Ethane and 0.685 for Ethylene. Click OK. The feed stream on the main flowsheet should turn blue, indicating that all required input has been
  • 157.
    Dist-001H Revised:Nov7,2012 6 entered andthat it has solved for all properties. If you open the Feed stream property window you will see a greenstatusbar sayingOK at the bottom.
  • 158.
    Dist-001H Revised:Nov7,2012 7 4.10. Nowwe must enter design specs to reach the desired product compositions as provided in the problem statement. In the Column property window, go to Design | Specs. Our two design specifications for this simulation will be distillate rate and mass fraction of ethylene in the bottoms stream. In the column specifications form there should already be a Distillate Rate spec that was created from the column input expert. Make sure that the distillate specification value is correct (9.450e+004 kg/h) and that the specis checkedasactive. 4.11. In the Column Specifications form, click Add and select a Column Component Fraction specification. In the Comp Frac Spec window select the Stream radio button for Target Type. Enter Ethane@COL1 for Draw, Mass Fraction for Basis, and 9.0e-004 for Spec Value. Select Ethylene for Components. Close thisformwhenall information isentered.
  • 159.
    Dist-001H Revised:Nov7,2012 8 4.12. Makesure that this spec (Comp Fraction) is checked as Active in the Specification Details area. You will notice that after activating the Comp Fraction spec, the Degrees of Freedom changes to -1. This means that the problem is over specified. To fix this, simply deactivate one of the column specifications, in this case the Reflux Ratio. Once the reflux ratio design spec is deactivated, the column should solve. You will notice thatthe statusbar at the bottomof the sheetwill turngreenandsay Converged.
  • 160.
    Dist-001H Revised:Nov7,2012 9 4.13. Checkresults. In the Column property window, go to the Performance tab. On the Summary sheet you can see the flowrates and compositions of the feed and product streams. You can see that both specificationsdescribedinthe problemstatementare met.
  • 161.
    Dist-001H Revised:Nov7,2012 10 4.14. Inthe Column Profiles sheet you can view the calculated reflux ratio, boilup ratio, as well as material and energyprofilesthroughthe column. 4.15. On the Plots sheet you can create plots such as temperature and composition along the column, as shownbelow.
  • 162.
  • 163.
    Dist-001H Revised:Nov7,2012 12 4.16. Finally,on the Cond./Reboiler sheet you can view the calculated operating conditions for both the condenserandreboiler. 5. Conclusions The 125 stage column was able to exceed the specification of 99.96wt% ethylene at 5 million lb/day, as well as the bottoms having less than 0.10wt% ethylene. It could then be concluded that this column is capable of completing the desired separation. Aspen HYSYS allows engineers to model existing equipment and see if it is possible torepurpose it or,otherwise, designnew equipmentthatwould meetvery specificcriteria. 6. Copyright Copyright © 2012 by Aspen Technology, Inc. (“AspenTech”). All rights reserved. This work may not be reproduced or distributed in any form or by any means without the prior written consent of AspenTech. ASPENTECH MAKES NO WARRANTY OR REPRESENTATION, EITHER EXPRESSED OR IMPLIED, WITH RESPECT TO THIS WORK and assumes no liability for any errors or omissions. In no event will AspenTech be liable to you for damages, including any loss of profits, lost savings, or other incidental or consequential damages arising out of the use of the information contained in, or the digital files supplied with or for use with, thiswork. This workand itscontentsare providedforeducational purposesonly. AspenTech®, aspenONE®, and the Aspen leaf logo, are trademarks of Aspen Technology, Inc.. Brands and productnamesmentionedinthisdocumentationare trademarksorservice marksof theirrespective companies.
  • 164.
    Dist-002H Revised:Nov5,2012 1 Pressure SwingDistillation with Aspen HYSYS® V8.0 1. Lesson Objectives  Configure distillationcolumnsinAspenHYSYS  Learn to use pressure swingtoovercome azeotropicmixture 2. Prerequisites  Aspen HYSYS V8.0  Workingknowledgeof vapor-liquidequilibrium anddistillation 3. Background Basics on Azeotropic Distillation An azeotrope occurs when the liquid and vapor mole fractions of each component are the same. On a y-x plot, an azeotrope is shown by a line which passes through the x = y line. Azeotropes present challenges to separationprocessesandneedtobe accountedforinprocessdesignandoperation.
  • 165.
    Dist-002H Revised:Nov5,2012 2 No furtherenrichment can occur in either phase when the system reaches the azeotrope constraint because the driving force is eliminated. A mixture will separate towards a pure component and the azeotropic mixture. The component whichis purified depends onwhich side of the crossover the initial mixture is. To purify the minority component, you must first cross the azeotrope. This can be done by adding an entrainer, another chemical which breaks the azeotrope. This creates the need for additional separation and usually material recycle with a purge stream. Alternatively, the composition of the azeotrope is dependent on pressure, which can be exploitedtogetthe mixture acrossthe azeotrope. Thisiscalledpressure swingdistillation. Ethanol and water form an azeotrope at approximately 95.5mol-% ethanol at 1 atm. This is a low-boiling point (or positive) azeotrope. The boiling point of the mixture is lower than either of the pure components, so the azeotropic mixture exit from the top of the column regardless of which compound is being enriched in the bottoms. The examples presented are solely intended to illustrate specific concepts and principles. They may not reflectan industrial application or real situation. 4. Problem Statement A feed of 24,000 kg/h of 20mol-% ethanol and 80 mol-% water must be separated. The required product stream is 99 mol-%ethanol at a flowrate of at least 7,500 kg/h. This separation will be achieved by using pressure swing distillation. We begin by creating a technically feasible design for a two-column separation train. We will report for each column: operating pressure, number of stages, reflux ratio, and the purity and recovery specifications. Also report a stream table with the flowrates and compositions of relevant streams. Material recycle will be necessary to achieve these results. We will use an operating pressure of 0.1 bar for the first column, and an operatingpressure of 20 bar for the secondcolumn. Aspen HYSYS Solution 4.01. Create a newsimulationin AspenHYSYSV8.0. 4.02. Create a componentlist. Inthe ComponentLists folderselectAdd. Addethanol andwaterto the componentlist.
  • 166.
    Dist-002H Revised:Nov5,2012 3 4.03. Definepropertypackage. Inthe FluidPackagesfolderselectAdd. SelectNRTLas the propertypackage. SelectRK as the Vapour Model. The non-random, twoliquid(NRTL) model workswell forverynonideal liquidsystemswhichisimportantbecause of the hydrogenbondingpresent. The Redlich-Kwong equationmodel worksmuchbetterathighpressuresthanthe ideal gasassumptioninthe vapourphase. 4.04. Go to the simulationenvironmentbyclickingthe Simulationbuttoninthe bottomleftof the screen. 4.05. Adda DistillationColumnSub-Flowsheettothe flowsheetfromthe Model Palette.
  • 167.
    Dist-002H Revised:Nov5,2012 4 4.06. Doubleclick the column (T-100). This will open the Distillation Column Input Expert window. Enter the followinginformationandclick Nextwhencomplete.
  • 168.
    Dist-002H Revised:Nov5,2012 5 4.07. Onthe second page of the input expert leave the default selections for a Once-through, Regular Hysys reboilerandclick Next. 4.08. On page 3 of the input expert enter Condenser and Reboiler Pressures of 0.1 bar. Click Next when complete. 4.09. On page 4, leave all fields for temperature estimates blank. Click Next to continue. On page 5 of the inputexpert,againleave all fieldsblankandclick Done toconfigure the column. 4.10. We will now define the feed stream. Double click on the Feed stream. In the Worksheet tab enter a Temperature of 65°C, a Pressure of 1.2 bar, anda Mass Flowof 24,000 kg/h.
  • 169.
    Dist-002H Revised:Nov5,2012 6 4.11. Goto the Compositionformunderthe Worksheettabto define the compositionof the feedstream. Enter Mole Fractions of 0.2 for ethanol and 0.8 forwater. Whencomplete,the feedstreamshouldbe fullydefinedandwillsolve. 4.12. Double clickthe column(T-100) to finishspecifyingthe operatingconditions. Goto the Specs form underthe Designtab. First,we wouldlike torecover99% of ethanol fromthe feedstream. Todo this we will clickthe Addbuttonand select ColumnComponentRecovery. SelectstreamD1 as the Draw, entera Spec Value of 0.99, andselectEthanol as the Component.
  • 170.
    Dist-002H Revised:Nov5,2012 7 4.13. Second,wewouldlike the distillatestream(D1) to have a mole fractionof 0.90 for ethanol. The azeotrope preventsusfromthe reachingthe desiredproductpurityof 99% witha single column,butwe wouldstill wantthe distillate from the firstcolumntobe verypure while losingaslittle producttothe bottomsstreamas possible. Click Addand selectColumnCompFraction. SelectStreamfor Target Type, D1 for Draw, 0.90 for Spec Value,andEthanol for Component.
  • 171.
    Dist-002H Revised:Nov5,2012 8 4.14. Goto the SpecsSummary form underthe Designtab. Make sure that the onlyspecificationsmarkedas active are CompRecovery and CompFraction. The columnwill attempttosolve once these specsare active. 4.15. If the solverfailstoconverge,we mayhave toadd some parameterestimates. Forexample,we can provide anestimate forthe distillate streamflowrate basedona simple massbalance. We knowthat the feedcontainsapproximately 200 kgmole/hof ethanol. We alsoknow that we wantto recover99% of ethanol withanethanol mole fractionof 0.9in the distillate. We canthenprovide anestimate of 220 kgmole/hrforthe distillate stream. Inthe SpecsSummary grid,enter220 kgmole/h forDistillate Rate whichwill serve asanestimate aslongas it isnot an active specification. Click Runwhencomplete. The columnshouldnowconverge. Alsonote thatthe bottomsstreamisover99% water,whichmeansthat we are throwingawayverylittle ethanol. A pure waterstreamisalsodesirable becausewe cannow repurpose ordispose of thisstreamwithminimal furtherprocessing.
  • 172.
    Dist-002H Revised:Nov5,2012 9 4.16. Weare now readyto constructthe secondcolumn, whichwilloperate onthe otherside of the azeotrope ata pressure of 20 bar. We firstneedtoinserta pumpto increase the pressure of the distillatestreamleavingthe firstcolumn. Adda pump to the flowsheetfromthe Model Palette.
  • 173.
    Dist-002H Revised:Nov5,2012 10 4.17. Doubleclick the pump (P-100). Select stream D1 as the Inlet, create an Outlet stream called Feed2, and create an Energy streamcalled Q-Pump. 4.18. In the Worksheet tab, enter a Pressure of 20 bar (operating pressure of the second column) for stream Feed2. The pumpshouldsolve.
  • 174.
    Dist-002H Revised:Nov5,2012 11 4.19. Nextwewill insertthe second DistillationColumnSub-Flowsheettothe flowsheet,afterthe pump. 4.20. Double click the second column (T-101). This will open the Distillation Column Input Expert. On the firstpage,enterthe followinginformationandclick Nextwhencomplete. 4.21. On page 2 of the input expert, leave the default selections for a Once-through, Regular Hysys reboiler. ClickNext. 4.22. On page 3 of the input expert, enter Condenser and Reboiler Pressures of 20 bar. Click Next when complete.
  • 175.
    Dist-002H Revised:Nov5,2012 12 4.23. Onpage 4 leave all fields for temperature estimates blank. Click Next. On the final page, also leave all fieldsblank. Click Done to configure the column. 4.24. We must now enter the operating specifications for the column. In the column window for T-101 go to the Specs form under the Design tab. Add a column specification for the mole fraction of ethanol in the bottoms stream. Click Add and select Column Component Fraction. Select Stream for Target Type, Ethanol for Draw, 0.99 for SpecValue,and Ethanol forComponent.
  • 176.
    Dist-002H Revised:Nov5,2012 13 4.25. Wewill now add a specification for the mole recovery of ethanol in the bottoms stream. In the Specs Summary form under the Design tab, double click the specification for Btms Prod Rate. We know that approximately 203 kgmole/h of ethanol are entering the process in the original feed stream. Since we are recovering 99% of the ethanol in the first column, we expect the final product stream to have a flowrate of approximately 200kgmole/h. 4.26. In the Specs Summary form, make sure that the only active specifications are Btms Prod Rate and Comp Fraction. The columnwill attempt to solve, but you should find that it will not be able to converge. This isbecause we needtoadd a recycle streamto the flowsheet.
  • 177.
    Dist-002H Revised:Nov5,2012 14 4.27. Doubleclick on the first column (T-100) and add a second Inlet Stream called Recycle. This stream will enteronthe same stage as the Feedstream(stage 25). 4.28. We will define the recycle stream with a guess of what the actual recycle stream will consist of. We will use this “dummy” recycle stream to allow both columns to converge, and then we will add a recycle block to find the actual recycle stream conditions. Double click the Recycle stream on the flowsheet. In the Worksheet tab enter a Vapour Fraction of 0, a Pressure of 1.2 bar, and a Molar Flow of 400 kgmole/h. In the Composition form enter Mole Fractions of 0.9 for ethanol, and 0.1 for water. Again, these values are just guesses that will be used to converge both columns. The actual values for the recycle stream will be determined later through the use of a recycle block. Make sure that you specify Recycle in its own window, rather than in the Worksheet tab of Column T-100, as this will cause a consistencyerrordue tooverspecificationwhenyoutrytocomplete the recycle loop.
  • 178.
    Dist-002H Revised:Nov5,2012 15 4.29. Oncethe recycle stream is fully specified, double click on each column and click Run to converge the columns. Bothcolumnsshouldnowsuccessfullyconverge. 4.30. Now we can close the recycle loop to determine the actual values for the Recycle stream. First we must lower the pressure of stream D2 through the use of a valve. Add a Valve to the flowsheet from the Model Palette.
  • 179.
    Dist-002H Revised:Nov5,2012 16 4.31. Doubleclickonthe valve (VLV-100). SelectstreamD2 as the Inletand create an OutletcalledRec. 4.32. Go to the Worksheettaband specifyanoutlet Pressure of 1.2 bar. The valve shouldsolve.
  • 180.
    Dist-002H Revised:Nov5,2012 17 4.33. Wewill nowadda Recycle blockto the flowsheetfromthe Model Palette.
  • 181.
    Dist-002H Revised:Nov5,2012 18 4.34. Doubleclick on the recycle block (RCY-1). Select stream Rec as the Inlet and stream Recycle as the Outlet. The recycle blockshouldautomaticallysolve.
  • 182.
    Dist-002H Revised:Nov5,2012 19 4.35. Goto the Worksheet tab to view recycle convergence results. The two streams should be equal to each otherwithinacertaintolerance. 4.36. If you are not satisfied with the recycle convergence, go to the Parameters tab and lower the sensitivities. For example if we change the sensitivity value to 1 for Flow and Composition we get the followingresults.
  • 183.
    Dist-002H Revised:Nov5,2012 20 4.37. Theflowsheet is now complete. Further analysis can be performed to optimize the column size, feed location,andenergyrequirements,butthatanalysisisnotcoveredinthislesson.
  • 184.
    Dist-002H Revised:Nov5,2012 21 5. Conclusions Theazeotrope in the ethanol-water system presents a barrier to separation, but pressure swing distillation can be used to purify ethanol. A technically feasible design for purifying ethanol to 99mol-% with pressure swing distillation can be constructed using Aspen HYSYS. A column with 30 equilibrium stages and operating at 0.1 bar with a reflux ratio of 6.9 increases the ethanol composition to 90mol-%. A second column with 75 equilibrium stagesand operatingat20 bar witha reflux ratioof 10.8 increasesthe purityto99mol-%. 6. Copyright Copyright © 2012 by Aspen Technology, Inc. (“AspenTech”). All rights reserved. This work may not be reproduced or distributed in any form or by any means without the prior written consent of AspenTech. ASPENTECH MAKES NO WARRANTY OR REPRESENTATION, EITHER EXPRESSED OR IMPLIED, WITH RESPECT TO THIS WORK and assumes no liability for any errors or omissions. In no event will AspenTech be liable to you for damages, including any loss of profits, lost savings, or other incidental or consequential damages arising out of the use of the information contained in, or the digital files supplied with or for use with, thiswork. This workand itscontentsare providedforeducational purposes only. AspenTech®, aspenONE®, and the Aspen leaf logo, are trademarks of Aspen Technology, Inc.. Brands and productnamesmentionedinthisdocumentationare trademarksorservice marksof theirrespective companies.
  • 185.
    Dist-003H Revised:Nov 7,2012 1 First-PassDistillation Estimates with Aspen HYSYS® V8.0 1. Lesson Objectives  Short cut distillationmodeling  Initial columnsizing 2. Prerequisites  Aspen HYSYS V8.0  Introductiontovaporliquidequilibrium 3. Background Short Cut Distillation Block The Short Cut ColumnperformsFenske-Underwoodshortcutcalculationsforsimplerefluxedtowers.The Fenske minimumnumberof traysandthe Underwoodminimumreflux are calculated.A specifiedrefluxratio can thenbe usedtocalculate the vapor andliquidtrafficratesinthe enrichingandstrippingsections,the condenserdutyandreboilerduty,the numberof ideal trays,andthe optimal feedlocation. The ShortCut Columnisonlyan estimate of the Columnperformance andisrestrictedtosimple refluxedColumns.Formore realisticresultsthe rigorousColumnoperationshouldbe used.Thisoperationcanprovide initial estimatesfor mostsimple Columns Heavy and Light Keys In two-componentdistillation,the columnsplitsthe feed soa single componentisenrichedineach exitstream. In multi-componentdistillation,there are more componentsthaneffluentstreams,sothere are multiple components enriched inatleastone of the exitstreams. The keycomponentsare the componentsthatare split by the column. The lightkeyisthe leastvolatile component enrichedinthe distillate stream;the heavykeyis the most volatile componentenrichedinthe bottomsstream. If there are componentsA,B,C, and D with decreasingvolatility,acolumncancreate the followingseparations:
  • 186.
    Dist-003H Revised:Nov 7,2012 2 Theexamplespresentedare solelyintendedtoillustrate specificconceptsand principles. Theymay not reflectan industrial application or real situation. 4. Problem Statement and Aspen HYSYS Solution Problem A streamcontaining68.5 wt% ethylene and 31.5 wt%ethane witha total flowrate of 7.3 million lb/daymustbe separated. Reporta reasonable startingpointfor a more detaileddesignincludinganestimate of the numberof theoretical stagesandreflux ratiorequiredtoachieve aseparationof 99.9% recoveryof ethylene and99.0% recoveryof ethane. Aspen HYSYS Solution Initial estimationfordistillationof relativelyidealcomponentslikeethane andethylene canbe done using graphical methodsandsemi-empirical equationslikethe equationsdescribedinthe backgroundsection. In AspenHYSYS,the Short Cut Column usesthese equations. The usermustinputwhichcomponentsare the light and heavykeysand the recoveryof each of these components,the pressure inthe condenserandreboiler,and the reflux ratio. These equationsare goodstartingpoints,but the ShortcutColumn isnot a rigorouscalculation block;it doesnotdirectlyuse thermodynamicstosolve forthe reflux ratioorrequirednumberof stages. A more rigorouslookat thisseparationproblemisavailable inDist-001_C2Splitter. 4.01. Create a newcase in AspenHYSYS V8.0. 4.02. Create a componentlist. Inthe ComponentLists folderselectAdd. AddEthane and Ethylene tothe componentlist. Youmayneedtotype “ethene”inthe Search for fieldtofindethylene.
  • 187.
    Dist-003H Revised:Nov 7,2012 3 4.03.Define property package. Inthe FluidPackagesfolderselectAdd. SelectPeng-Robinsonasthe propertypackage. 4.04. Go to the simulationenvironmentbyclickingonthe Simulationbuttonbelow the navigationpane. 4.05. Adda Short Cut Distillationmodel tothe flowsheetfromthe Model Palette. 4.06. Double clickonthe column(T-100). Create an InletcalledFeed,aCondenserDuty calledQ-Cond,a Distillate calledDist,a ReboilerDuty calledQ-Reb,anda Bottoms calledBot.Checkthe Liquidradio buttonunderTop Product Phase, whichspecifies atotal condenser.
  • 188.
    Dist-003H Revised:Nov 7,2012 4 4.07.Define feedstream. Goto the Worksheettab. Entera Vapour Fraction of 1, a Pressure of 350 psig (25.14 bar), anda Mass Flowof 7,300,000 lb/day (1.38e+005 kg/h). 4.08. In the CompositionformenterMass Fractions of 0.315 for Ethane and 0.685 for Ethylene. The feed streamshouldsolve.
  • 189.
    Dist-003H Revised:Nov 7,2012 5 4.09.Go to the Parametersform underthe Designtab inthe Shortcut Columnwindow. Usingthe recovery percentagesspecifiedinthe problemstatementalongwithasimple massbalance,itcanbe determined that the mole fractionof ethane inthe distillatestreamwillbe approximately 0.004, andthe mole fractionof ethylene inthe bottomswillbe approximately 0.002. Enterthese valuesintothe Componentsgridin the Parameters form. 4.10. Specifythe CondenserandReboilerPressures tobothbe 300 psig(21.698 bar). You can see thatHYSYS has nowcalculatedthe MinimumRefluxRatiorequiredtocomplete the specifiedseparationwithan infinite numberof stages. 4.11. You may nowentera RefluxRatio and the Shortcut Columnwill calculate the numberof stages,feed stage location,condenserandreboilertemperatures,andmaterial andenergyflows. Forexample, enter4.5 as the External RefluxRatio.
  • 190.
    Dist-003H Revised:Nov 7,2012 6 4.12.In the Performance tab youwill see the followingresults.
  • 191.
    Dist-003H Revised:Nov 7,2012 7 5.Conclusions Estimationusingthe ShortCutColumn can be done veryquickly,evenforcomplexdistillationsystems. The resultscanthenbe usedas a startingpointformore complex analysis,suchasa witha rigorousdistillation model. 6. Copyright Copyright © 2012 by Aspen Technology, Inc. (“AspenTech”). All rights reserved. This work may not be reproduced or distributed in any form or by any means without the prior written consent of AspenTech. ASPENTECH MAKES NO WARRANTY OR REPRESENTATION, EITHER EXPRESSED OR IMPLIED, WITH RESPECT TO THIS WORK and assumes no liability for any errors or omissions. In no event will AspenTech be liable to you for damages, including any loss of profits, lost savings, or other incidental or consequential damages arising out of the use of the information contained in, or the digital files supplied with or for use with, thiswork. This workand itscontentsare providedforeducational purposesonly. AspenTech®, aspenONE®, and the Aspen leaf logo, are trademarks of Aspen Technology, Inc.. Brands and productnamesmentionedinthisdocumentationare trademarksorservice marksof theirrespective companies.
  • 192.
    Dist-004H Revised:Nov 7,2012 1 GibbsPhase Rule in a Distillation Column with Aspen HYSYS® V8.0 1. Lesson Objectives  Use Aspen HYSYSto observe one-to-one relationbetweenstage temperaturesandcompositionsina distillationcolumn forabinarysystemwithfixedpressure. 2. Prerequisites  Aspen HYSYS V8.0 3. Background Accordingto the Gibbsphase rule,the degreesof freedom( ) isequal to the numberof components(C) minus numberof phases( ,plus2. For a binarymixture involvingvapor-liquidequilibrium,there are nodegrees of freedomleft once temperature and pressure are fixed. All state variablesare fixed,includingvaporandliquidcompositions. Thisisuseful for distillationcolumncontrol. Indistillationcolumn simulations,the productcompositionsare typicallythe most importantresults. Therefore,compositionsare typicallymeasuredandcontrolled. However,measuring compositionsisaslower,more costlyprocessthanmeasuringtemperatures. Whenpressureisfixed, temperature andcompositionhave aone-to-onecorrespondence (exceptforcaseswithazeotropes). Therefore,measuringandcontrollingtop/bottomstage temperaturesisthe same asmeasuringandcontrolling top/bottomstage composition. In thisexample, we will carryoutseveral case studiestoshow thatcompositionsfortopandbottomstagesare constantwhentopand bottomstage temperaturesare fixedregardlessof changesinotheroperatingconditions and columnconfigurations. The examplespresentedare solelyintendedtoillustrate specificconceptsand principles. Theymay not reflectan industrial application or real situation.
  • 193.
    Dist-004H Revised:Nov 7,2012 2 4.Problem Statement and Aspen HYSYS Solution Problem Statement For a distillationcolumn consistingof a binarymixture of ethane andethylene,whenthe pressure and temperature foranequilibriumstage have beenfixed,will the vaporandliquidcompositionsleavingthisstage change withotherconditionsof the column? Aspen HYSYS Solution 4.01. Create a newcase in AspenHYSYS V8.0. 4.02. Create a componentlist. Inthe ComponentLists folderselectAdd. AddEthane and Ethylene tothe componentlist. Ethylene canbe foundbyentering“ethene”inthe Searchfor field. 4.03. Define propertypackage. Inthe FluidPackagesfolderselectAdd. SelectPeng-Robinsonasthe propertypackage. 4.04. Go to the simulationenvironmentbyclickingthe Simulationbuttoninthe bottomleftof the screen.
  • 194.
    Dist-004H Revised:Nov 7,2012 3 4.05.Adda DistillationColumnSub-Flowsheettothe flowsheetfromthe Model Palette. 4.06. Double clickonthe distillationcolumn(T-100). The DistillationColumnInput Expertwindow will open. On the firstpage of the expertenterthe followinginformation. Click Nextwhencomplete.
  • 195.
    Dist-004H Revised:Nov 7,2012 4 4.07.On the secondpage of the inputexpertleavethe defaultselectionsfora Once –through, Regular HYSYS reboilerandclick Next. 4.08. On the thirdpage of the inputexpertenter CondenserandReboilerPressures of 100 kPa. Click Next. 4.09. On the fourthpage of the inputexpertleave all fieldsfortemperature estimatesblankandclick Next. Alsoleave all fieldsblankonthe fifthpage andclick Done to configure the column. 4.10. We will firstdefine the feedstream. Doubleclickonthe Feedstream. Entera Vapour Fraction of 0.5, a Pressure of 100 kPa, and Molar Flowof 100 kgmole/h.
  • 196.
    Dist-004H Revised:Nov 7,2012 5 4.11.In the CompositionformenterMole Fractions of 0.5 for both Ethylene and Ethane. The streamshould solve. 4.12. Double clickthe column(T-100) to complete the specificationsforthe column. Goto the Specsform underthe Designtab. We wouldlike tospecifythe temperaturesof the topand bottomstages. Click the Add buttonand selectaColumn Temperature specificationtype. Select Stage 1 and entera Spec Value of -104.193°C. Thistemperature correspondstoamole fractionof 0.99 ethylene inthe distillate. 4.13. Adda second Temperature specificationandselect Stage 50 and entera SpecValue of -88.971°C. This temperature correspondstoamole fraction of 0.99 ethane inthe bottoms.
  • 197.
    Dist-004H Revised:Nov 7,2012 6 4.14.In the SpecsSummary form,make sure that the onlyactive specificationsare the twotemperature specsthat were justcreated. Afterbothtemperature specsare made active the columnshouldsolve.
  • 198.
    Dist-004H Revised:Nov 7,2012 7 4.15.Checkproductcompositionresults. Inthe columnpropertywindow,gotothe Performance tab. In the Summary form youcan see that the mole fractionof ethylene inthe distillate is 0.9934 andthe mole fractionof ethane inthe bottomsis 1.
  • 199.
    Dist-004H Revised:Nov 7,2012 8 4.16.To viewthe RefluxandBoilup Ratios go to the ColumnProfilesformunderthe Performance tab. 4.17. We will now change the feedlocation tothe columnwhileholdingthe topandbottomstage temperature specificationsconstant. The productcompositionsshouldnotchange because we are holdingtemperatureandpressure constant. Goto the Designtab in the columnwindow andchange the FeedstreamInletStage to 29. Click Run to begincalculations. The columnshouldconverge.
  • 200.
    Dist-004H Revised:Nov 7,2012 9 4.18.Go to the Performance tab to viewresults.Notethatthe productcompositionshave notchanged. You will notice howeverthatthe RefluxandBoilupRatios have changed. 4.19. We will now change the compositionof the feedstream. Double clickthe Feedstreamandgoto the Compositionformunderthe Worksheettab. Change the Mole Fractions to 0.6 forEthylene and 0.4 for Ethane. Whenfinishedthe columnshouldautomaticallyupdate andconverge. Again,the product compositionsshouldnotchange because we are still holdingthe temperature andpressure of the top and bottomstage constant.
  • 201.
    Dist-004H Revised:Nov 7,2012 10 4.20.Go to the Performance tab inthe columnwindow toview the compositionresults. 4.21. Lastly, we will add10 stagesto the columnand observe the effectonproductpurity. Go to the Design tab of the columnwindowandenter 60 for Numof Stages. Press Run whencomplete. The column shouldconverge.
  • 202.
    Dist-004H Revised:Nov 7,2012 11 4.22.Go to the Performance tab to viewresults. Once againyouwill see thatthe productcompositions remainunchanged. 5. Conclusions Thisexample showsthatfora binarydistillationcolumn,fixingtop/bottomstage temperatures holds top/bottomcompositions constantregardlessof changestootherthings(e.g.,feedconditionsandlocationsor the numberof stagesin the column). Thisbehaviorcanbe leveragedforcontrol. Forbinarymixtureswith azeotrope(s),thisstillholdstrue assuming thata composite feedstayswithinacertainregiondividedby azeotropes. 6. Copyright Copyright© 2012 by AspenTechnology,Inc.(“AspenTech”).All rightsreserved. Thisworkmaynot be reproducedordistributedinanyformor byany meanswithoutthe priorwrittenconsentof AspenTech. ASPENTECHMAKESNOWARRANTYOR REPRESENTATION,EITHER EXPRESSEDOR IMPLIED, WITH RESPECT TO THIS WORK and assumesno liabilityforanyerrorsor omissions. Innoeventwill AspenTechbe liable toyoufordamages,includinganylossof profits,lostsavings,orotherincidental orconsequential damagesarisingoutof the use of the informationcontainedin,orthe digital filessuppliedwithorforuse with, thiswork. This workand itscontentsare providedforeducational purposesonly. AspenTech®,aspenONE®,andthe Aspenleaf logo,are trademarksof AspenTechnology,Inc.. Brandsand productnamesmentionedinthis documentationare trademarksorservice marksof theirrespective companies.
  • 203.
    Dist-009H Revised:Nov19,2012 1 Separation ofAcetone-Water with Aspen HYSYS® V8.0 Liquid-Liquid Extraction with 3-Methylhexane as the Solvent 1. Lesson Objectives  Learn howto buildanextractionandsolventrecoveryflowsheet.  Learn howto configure aliquid-liquidextractorandadistillationcolumn. 2. Prerequisites  Aspen HYSYS V8.0 3. Background Water has a highlatentheat(heatof vaporization) comparedtomanyothercomponents. Forthe separationof a water-acetone mixture (50wt-% each),itmaybe more energyefficienttouse extractioninsteadof direct distillation. Inthisexample,we utilize 3-methylhexane asasolventtoremove watervialiquid-liquidextraction, followedbydistillationtoremove the solventfromacetone. The examplespresentedare solelyintendedtoillustrate specificconceptsand principles. Theymay not reflectan industrial application or real situation. 4. Problem Statement and Aspen HYSYS Solution Problem Statement Determine howmuch energy isrequiredto separate a50 wt-% acetone 50 wt-% waterstreamusing3- methylhexaneasa solvent. Aspen HYSYS Solution 4.01. Start a newsimulation inAspenHYSYSV8.0. 4.02. Create a componentlist. Inthe ComponentLists folderselectAdd. AddAcetone,Water,and 3- methylhexane tothe componentlist.
  • 204.
    Dist-009H Revised:Nov19,2012 2 4.03. Selectpropertypackage.Inthe FluidPackages folderselectAdd. SelectPRSVasthe propertypackage. For informationaboutthe PRSV propertypackage see AspenHYSYShelp. 4.04. Move to the simulationenvironmentbyclickingthe Simulationbuttoninthe bottomleftof the screen. 4.05. Firstwe will adda Mixerto the flowsheetfromthe Model Palette. Thismixerwill servetomix together the recycledsolventstreamandthe solventmake upstream.
  • 205.
    Dist-009H Revised:Nov19,2012 3 4.06. Doubleclickthe mixer(MIX-100). Create twoInletstreamscalled Make Up and Solvent-Recycle. Create an Outletstreamcalled Solvent.
  • 206.
    Dist-009H Revised:Nov19,2012 4 4.07. Doubleclickonthe Make Up stream. SpecifyaTemperature of 25°C, a Pressure of 1 bar, and a Molar Flowof 0. We will laterassignthisstreama flowrate,butfornow itwill have zeroflow. Inthe Compositionformentera Mole Fraction of 1 for 3-methylhexane. 4.08. Double clickonthe Solvent-Recycle stream. Entera Temperature of 30°C, a Pressure of 1 bar, and a Mass Flow of 150 kg/h. In the Compositionformentera Mole Fraction of 1 for3-methylhexane. These specificationswill serveasan initial guessastowhatthe actual recycle streamwill be.
  • 207.
    Dist-009H Revised:Nov19,2012 5 4.09. AddaLiquid-LiquidExtractor to the flowsheetfromthe Model Palette. 4.10. Double clickonthe extractor(T-100) to openthe Liquid-LiquidExtractor Input Expertwindow. Onthe firstpage entera Top Stage Inlet calledFeedandselectSolventforthe Bottom Stage Inlet. Change the numberof stagesto 8. Enteran Ovhd Light Liquid streamcalled Rich-Sol anda Bottoms Heavy Liquid streamcalled Water. ClickNextwhencomplete.
  • 208.
    Dist-009H Revised:Nov19,2012 6 4.11. OnPage 2 of the Input Expert enterTop andBottom Stage Pressuresof 1 bar. Click Nextwhen complete. 4.12. On the final page of the Input Expert entera Top Stage Temperature Estimate of 25°C. Click Done whencomplete toconfigure the column.
  • 209.
    Dist-009H Revised:Nov19,2012 7 4.13. Wemustnowdefine the feed stream. Goto the Worksheettabinthe Column:T-100 window. Forthe Feedstreamentera Temperature of 25°C, a Pressure of 1 bar, and a Mass Flow of 100 kg/h. 4.14. In the Compositionsformunderthe WorksheettabenterMass Fractions of 0.5 foracetone andwater inthe Feedstream.
  • 210.
    Dist-009H Revised:Nov19,2012 8 4.15. ClicktheRun buttonat the bottomof the Column:T-100 window tobegincolumncalculations. The columnshouldconverge. 4.16. Checkthe compositionof the Waterstreamexitingthe bottomof the column. Youwill see thatthe mole fraction for water is1.
  • 211.
    Dist-009H Revised:Nov19,2012 9 4.17. Wewill nowinsertaDistillationColumnSub-Flowsheetfromthe Model Palette. 4.18. Double clickthe column(T-101) to openthe DistillationColumnInputExpert. On Page 1 enterthe followinginformationandclick Nextwhencomplete.
  • 212.
    Dist-009H Revised:Nov19,2012 10 4.19. OnPage 2 of the Input Expert leave the defaultselectionsfora Once-through,Regular Hysys Reboiler. ClickNext. 4.20. On Page 3 of the Input Expert enterCondenserandReboilerPressures of 1 bar. Click Nextwhen complete.
  • 213.
    Dist-009H Revised:Nov19,2012 11 4.21. OnPage 4 and 5 leave all fieldsblank. Click Done onthe final page to configure the column. 4.22. We mustdefine the designspecificationsforthiscolumn. Goto the SpecsSummary formunderthe Designtab. Enter 1.2 for RefluxRatio and make sure that the reflux ratiospecificationisthe onlyactive designspecification. 4.23. We will nowadda specificationforthe mole fractionof acetone inthe distillate stream. Goto the Specs formunderthe Design tab. ClickAddand selectColumnComponentFraction. SelectStreamfor Target Type, Acetone for Draw, enter0.99 for SpecValue,and selectAcetone forComponent. 4.24. The Degreesof Freedomforthe columnshouldnow be 0. Clickthe Run buttonto begincolumn calculations. The columnshouldsolve.
  • 214.
    Dist-009H Revised:Nov19,2012 12 4.25. Wenowneedtoadd a coolerto cool the bottomsstreaminorderto recycle itback to the mixer. Adda Coolerto the flowsheetfromthe Model Palette.
  • 215.
    Dist-009H Revised:Nov19,2012 13 4.26. Doubleclickonthe cooler(E-100). Selectstream Sol-Recas the Inlet, and create an OutletcalledLean- Sol and an Energystream called Q-Cool. 4.27. In the Worksheettabenteran outlet Temperature of 30°C and a Pressure of 1 bar. The blockshould solve.
  • 216.
    Dist-009H Revised:Nov19,2012 14 4.28. Nowwewill adda Spreadsheetto control to flowrate of solventinthe Make Up stream. 4.29. Double clickonthe spreadsheet(SPRDSHT-1). Goto the Spreadsheettaband enterthe followingtextin cellsA1 and A2.
  • 217.
    Dist-009H Revised:Nov19,2012 15 4.30. Rightclickoncell B1 andselectImport Variable. SelectMasterComp Molar Flowof 3-methylhexane in the acetone productstream. 4.31. Clickon cell B2 and enter“=B1”. Rightclickon cell B2 andselectExport Formula Result. Selectthe Molar Flow of streamMake Up. Thiswill setthe Make Up streamflowrate equal tothe flowrate of solventbeinglostinthe productstream.
  • 218.
    Dist-009H Revised:Nov19,2012 16 4.32. Wewill nowrecycle the bottomsstreamsfromthe secondcolumninordertopreventthrowingaway acetone product. Adda Recycle blockto the flowsheetfromthe Model Palette.
  • 219.
    Dist-009H Revised:Nov19,2012 17 4.33. Doubleclickonthe recycle block(RCY-1). SelectstreamSol-Recasthe Inletand streamSolvent-Recycle as the Outlet. The flowsheetshouldsolve. 4.34. We can nowtry to minimize the amountof solventthatwe are recycling. Itis possible thatthere are manysolutionsforthe amountof solventrecycle,andwe wishtofindthe optimumsolution. We can vary the mass flowof the recycle streamandfindwhere the reboilerdutyisatthe lowest. 4.35. Go to Case Studiesinthe navigationpane andclick Add. In Case Study 1 clickAdd and selectthe Mass Flowof streamSolvent-Recycle andthe ReboilerDuty of column T-101. Enter a Low Bound of 75 kg/h, a High Bound of 200 kg/h, anda StepSize of 5 kg/h. ClickRun.
  • 220.
    Dist-009H Revised:Nov19,2012 18 4.36. Checkresults.Go to the Plotstab and youwill see thatthe reboilerdutyisthe lowestwhenthe solvent recycle flowisaround 75 kg/h. You may try settingthe flowrate of Solvent-Recycle evenlower,butyou will findthatthe flowsheetwill notconverge.
  • 221.
    Dist-009H Revised:Nov19,2012 19 4.37. Doubleclickonstream Solvent-Recycle andenteraMass Flow of 75 kg/h. The flowsheetshould converge aftera fewmoments. 4.38. Checkresults. Double clickoncolumn T-101 and go to the Cond./Reboilerformunderthe Performance tab. Make note of the CondenserandReboilerDuty. 4.39. Double clickonenergystream Q-Cool andmake note of the coolingduty.
  • 222.
    Dist-009H Revised:Nov19,2012 20 4.40. Thetotal heatingdutyforthisdesignis 16,270 kcal/h and the total coolingdutyis 9,218 kcal/h. 4.41. Save thisthe HYSYS file as Dist-009H_Extraction.hsc. 5. Conclusions Basedon the simulationresults, itwouldrequire 16,270 kcal/hof heatingand9,218 kcal/hof coolingto separate the water–acetone mixture vialiquid-liquidextraction. Thisdesignisproventobe feasible,howeverit may or may notbe the optimal design. Anotheroptionwouldbe directdistillationof waterandacetone. Direct distillationof waterandacetone wouldrequire lessequipment, butitmayrequire more energy. 6. Copyright Copyright © 2012 by Aspen Technology, Inc. (“AspenTech”). All rights reserved. This work may not be reproduced or distributed in any form or by any means without the prior written consent of AspenTech. ASPENTECH MAKES NO WARRANTY OR REPRESENTATION, EITHER EXPRESSED OR IMPLIED, WITH RESPECT TO THIS WORK and assumes no liability for any errors or omissions. In no event will AspenTech be liable to you for damages, including any loss of profits, lost savings, or other incidental or consequential damages arising out of the use of the information contained in, or the digital files supplied with or for use with, thiswork. This workand itscontentsare providedforeducational purposesonly. AspenTech®, aspenONE®, and the Aspen leaf logo, are trademarks of Aspen Technology, Inc.. Brands and productnamesmentionedinthisdocumentationare trademarksorservice marksof theirrespective companies.
  • 223.
    Dist-010H Revised:Nov20,2012 1 Pressure Swingto Overcome Azeotropes with Aspen HYSYS® V8.0 Separation of Ethanol and Benzene 1. Lesson Objectives  Learn howto use pressure swingtoseparate abinarymixture thatformsan azeotrope intotwo pure components 2. Prerequisites  Aspen HYSYS V8.0  Introductiontoazeotropicmixtures  Introductiontodistillation 3. Background Ethanol and benzene formanazeotrope andthe azeotropiccompositionissensitive topressure. Therefore,itis possible touse pressure swingtoseparate thisbinarymixture into pure components. The examplespresentedare solelyintendedtoillustrate specificconceptsand principles. Theymay not reflectan industrial application or real situation. 4. Problem Statement and Aspen HYSYS Solution Problem Statement The firstcolumnoperatesundera pressure of 3 bars and the secondone at 0.1 bar. A compressorisusedto pressurize the recycle streamfrom 0.1bar to 3 bars before itisrecycledbackto the firstcolumn. Since the relative volatilityislarge exceptforthe azeotrope point,thereisnoneedtoadd a thirdcomponent(as a solvent). Aspen HYSYS Solution 4.01. Start a newsimulation inAspenHYSYSV8.0. 4.02. Create a componentlist. Inthe ComponentLists folderselectAdd. AddEthanol and Benzene tothe componentlist.
  • 224.
    Dist-010H Revised:Nov20,2012 2 4.03. Definepropertypackage. Inthe FluidPackagesfolderselectAdd. SelectPRSVas the propertypackage. 4.04. Go to the simulationenvironmentbyclickingthe Simulationbuttoninthe bottomleftof the screen. 4.05. We will firstaddtwo Material Streams to the flowsheet. Name one of the streams Feedandthe other Recycle.
  • 225.
    Dist-010H Revised:Nov20,2012 3 4.06. Doubleclickonthe Feedstream. Thiswill be the ethanol-benzenefeedtothe process. Inthe Worksheettabentera Vapour Fraction of 0.5, a Pressure of 3 bar, anda Molar Flowof 100 kgmole/h. In the CompositionformenterMole Fractions of 0.5 for both ethanol andbenzene. 4.07. We will nowdefine the stream Recycle. Thisstreamwill consistof ethanol andbenzenevaporsthat come off the topof the secondcolumn,whichwe will recyclesowe don’tthrow awayany product. Double clickonthe Recycle stream. Inthe Worksheettabentera Vapour Fraction of 1, a Pressure of 3 bar, and a Molar Flowof 200 kgmole/h. In the Compositiontab enterMole Fractions of 0.5 for both ethanol and benzene.These valuesare initialestimates.Theywill eventuallybe replacedbythe actual recycledproduct.
  • 226.
    Dist-010H Revised:Nov20,2012 4 4.08. Weare now readyto add a DistillationColumnSub-Flowsheettothe flowsheetfromthe Model Palette.
  • 227.
    Dist-010H Revised:Nov20,2012 5 4.09. Doubleclickthe distillationcolumn(T-100). Thiswill launchthe DistillationColumnInputExpert. On Page 1 specifythe followinginformation. Change the #Stages to 30 and selectstreams Feedand Recycle to enteron stage 10. SelectFull Reflux forCondenser,create anOvhd Vapour Outletstream calledVap,a Bottoms LiquidOutletcalledBenzene,anda CondenserEnergyStream calledQ-Cond1. Whencomplete click Next. 4.10. On Page 2 of the DistillationColumnInput Expert selectaOnce-through,Regular Hysys reboiler.Click Next. 4.11. On Page 3 of the DistillationColumnInput Expert enterCondenserandReboilerPressures of 3 bar. For thissimulationwe will assume nopressuredropthroughthe column. Inreal life thiswouldn’tbe the case. Click Next.
  • 228.
    Dist-010H Revised:Nov20,2012 6 4.12. Page4 asks for Temperature estimates. These are optionalvaluesthatwill helpthe columnsolver converge. Forthiscolumnwe will leave all estimatesblank. ClickNext. 4.13. On the final page of the expertentera RefluxRatio of 3. Click Done.
  • 229.
    Dist-010H Revised:Nov20,2012 7 4.14. TheColumn: T-100 windowwill now appear. We mustdefine the designspecificationsforthe column. We have alreadyspecifiedthe reflux ratio,butwe still needtospecifythe molefractionof benzene in the bottomsstream. Firstgo to the SpecsSummary form and make sure that onlythe RefluxRatio specificationischeckedasactive.
  • 230.
    Dist-010H Revised:Nov20,2012 8 4.15. Nowwewill create a specificationforthe mole fractionof benzene inthe bottomsstream. Goto the Specs formunderthe Designtab. Click Add and selectColumnComponentFraction. SelectStreamfor Target Type, Benzene forDraw, enter0.999 for SpecValue,and selectBenzene forComponent. 4.16. The Degreesof Freedomforthe columnshouldnow be 0. Clickthe Run buttonto begincalculations. The columnshouldquicklyconverge.
  • 231.
    Dist-010H Revised:Nov20,2012 9 4.17. Wewill nowinsertasecond DistillationColumnSub-Flowsheet. 4.18. Double clickonthe secondcolumn(T-101) to openthe DistillationColumnInput Expert. Onthe first page change the # Stages to 30 and selectthe stream Vap to enteronstage 10. SelectFull Reflux for the Condenser,create an Ovhd Vapour OutletcalledRec,a Bottoms LiquidOutletcalledEthanol,and a CondenserEnergyStream calledQ-Cond2. Click Nextwhencomplete.
  • 232.
    Dist-010H Revised:Nov20,2012 10 4.19. OnPage 2 of the DistillationColumnInput Expert leave the defaultselectionsfora Once-through, Regular Hysys reboiler. Click Next.
  • 233.
    Dist-010H Revised:Nov20,2012 11 4.20. OnPage 3 of the DistillationColumnInput Expert enterCondenserandReboilerPressures of 0.1 bar. ClickNextwhencomplete. 4.21. On Page 4 of the DistillationColumnInput Expert leave all fieldsfortemperature estimatesblank. Click Next.
  • 234.
    Dist-010H Revised:Nov20,2012 12 4.22. Onthe final page of the DistillationColumnInput Expert entera RefluxRatio of 1. Click Done when complete toconfigure the column. 4.23. Go to the SpecsSummary form underthe Designtab. We wishtospecifythe reflux ratioandthe mole fractionof ethanol inthe bottomsstream. We have alreadyspecifiedthe reflux ratio,butwe still need to create a specificationforthe mole fractionof ethanol inthe bottoms. First,make sure thatthe only currentactive specificationisthe RefluxRatio. 4.24. Nowwe will create a specificationforthe mole fractionof ethanol inthe bottomsstream. Goto the Specs formunderthe Designtab. Click Add and selectColumnComponentFraction. SelectStreamfor Target Type, Ethanol for Draw, enter0.999 for SpecValue,and selectEthanol for Component.
  • 235.
    Dist-010H Revised:Nov20,2012 13 4.25. TheDegreesof Freedomforthe columnshouldnow be 0. Clickthe Run buttonto begincalculations. The columnshouldconverge.
  • 236.
    Dist-010H Revised:Nov20,2012 14 4.26. Beforewe connectthe recycle loopwe mustfirstadda compressortoraise the pressure of stream Rec. Adda Compressorto the flowsheetfromthe Model Palette.
  • 237.
    Dist-010H Revised:Nov20,2012 15 4.27. Doubleclickonthe compressor(K-100). SelectstreamRecas the Inlet. Create an OutletcalledRec- HighP and an Energy streamcalled Q-Comp. 4.28. In the Worksheettabenteran outlet Pressure of 3 bar. The compressorshouldsolve.
  • 238.
    Dist-010H Revised:Nov20,2012 16 4.29. Weare now readyto connectthe recycle loop. Adda Recycle blockto the flowsheetfromthe Model Palette. 4.30. Double clickonthe recycle block(RCY-1). SelectstreamRec-HighPasthe Inletand selectstream Recycle as the Outlet. The flowsheetshouldsolve afterafew moments.
  • 239.
    Dist-010H Revised:Nov20,2012 17 4.31. Theflowsheetisnowcomplete. Checkresults. Double clickonstream Benzene andstreamEthanol. You will findthatthe flowrate of eachstreamisroughly 50 kgmole/hwitha mole fractionof 0.999 of each respectiveproduct.
  • 240.
    Dist-010H Revised:Nov20,2012 18 5. Conclusions Pressureswingdistillationcanbe a good methodforseparating abinarymixture thatformsan azeotrope when:  The azeotropiccompositionissensitive to apressure change  The relative volatilityof the twocomponentsislarge exceptatthe azeotropicpoint 6. Copyright Copyright© 2012 by AspenTechnology,Inc.(“AspenTech”). All rightsreserved. Thisworkmaynot be reproducedordistributedinanyformor byany meanswithoutthe priorwrittenconsentof AspenTech. ASPENTECHMAKESNOWARRANTYOR REPRESENTATION,EITHER EXPRESSEDOR IMPLIED, WITH RESPECT TO THIS WORK and assumesnoliabilityforanyerrorsor omissions. Innoeventwill AspenTechbe liable toyoufordamages,includinganylossof profits,lostsavings,orotherincidental orconsequential damagesarisingoutof the use of the informationcontainedin,orthe digital filessuppliedwithorforuse with, thiswork. This workand itscontentsare providedforeducational purposesonly. AspenTech®,aspenONE®,andthe Aspenleaf logo,are trademarksof AspenTechnology,Inc.. Brandsand productnamesmentionedinthisdocumentationare trademarksorservice marksof theirrespective companies.
  • 241.
    Dist-011H Revised:Nov20,2012 1 Azeotropic Distillationwith Aspen HYSYS® V8.0 Production of Anhydrous Ethanol Using an Entrainer 1. Lesson Objectives  Designa separationtrainforanhydrousethanol productionusingcyclohexaneasanentrainer  Include recycle of cyclohexane and the azeotropicmixture so thatthe recoveryof ethanol is>99.5% and the recoveryof cyclohexane is nearly 100%  Successfully converge aflowsheetwithmultiple recyclestreams  Configure athree phase distillationcolumn 2. Prerequisites  Aspen HYSYS V8.0  Understandingof azeotropes 3. Background Ethanol productionviafermentationoccursinwater,whichmustlaterbe separatedtomake anhydrousethanol (99.95% ethanol). There isanazeotrope inthe ethanol-watersystematapproximately95mol-% ethanol, which isa barrierto separation. Cyclohexaneisone of the solventsusedforthe productionof anhydrousethanol for foodand pharmaceutical usage. Itisusedas an entrainer:the ternarymixture formsaternaryazeotrope witha differentethanol concentration,whichallowsethanoltoenrichinthe otherstream. The azeotropicliquidis separatedtorecoverthe entrainerand the ethanol thatexitsthe columninthe azeotropicmixture. The examplespresentedare solelyintendedtoillustrate specificconceptsand principles. Theymay not reflectan industrial application or real situation. 4. Problem Statement and Aspen HYSYS Solution Problem Statement The feedto the separationtrainisa streamat 100 kgmole/hwith87mol-% ethanol and13 mol-% water. Cyclohexaneis addedtothe column,and> 99.95 mol-% ethanol exitsthe bottomof the column. The distillateis thenseparatedinthree phase condenser. The cyclohexane-richstreamisrecycleddirectlytothe firstcolumn, while the water- andethanol-richstreamissenttoa secondcolumnfromwhichalmost-pure waterexitsinthe bottoms. The distillate of the secondcolumnisrecycledtothe firstcolumn. Designthe separationtrainsothat the ethanol productstream meetsthe purityspecification andthe water effluentstreamhasa purityof 99mol-%.
  • 242.
    Dist-011H Revised:Nov20,2012 2 Aspen HYSYSSolution Thismodel isbuiltusingaspecificpath.The orderin whichthingsare done isimportantforsuccessful convergence of the model.Donotreinitializethe rununlessaskedto,andif stepsare skippedordone outof orderyou mayneedto be start at the beginningorfroma previouslysavedversion. 4.01. Start a newsimulation inAspenHYSYSV8.0. 4.02. Create a componentlist. Inthe ComponentLists folderclick Add. AddEthanol, Water,and Cyclohexane tothe componentlist. 4.03. Selectpropertypackage. Inthe FluidPackages folderclick Add. SelectPRSVas the propertypackage. 4.04. Go to the simulationenvironmentbyclickingthe Simulationbuttoninthe bottomleftof the screen. 4.05. We will beginbyaddingthe feedandrecycle streamstothe flowsheet. Addfour Material Streamsand a Mixerto the flowsheet. Name themasshownbelow.
  • 243.
    Dist-011H Revised:Nov20,2012 3 4.06. Doubleclickonthe mixer(MIX-100). Selectstreams Make Up and SolventRecycle as Inletsand create an OutletcalledSolvent.
  • 244.
    Dist-011H Revised:Nov20,2012 4 4.07. Inorderfor the mixertosolve,we mustdefine the inletstreams. Double clickonstream Make Up. This streamwill adda small amountof solventtothe systemto accountfor any solventlossestoproduct streams. We will laterimplementanadjustblocktosolve forthe correct flow rate of solvent,butfor nowwe will enterasmall numberasa guess. Inthe Worksheettabentera Temperature of 25°C, a Pressure of 1 bar, anda Molar Flowof 0.01 kgmole/h. Inthe Compositionformentera Mole Fraction of 1 for cyclohexane. 4.08. Double clickonthe SolventRecycle stream. Thisstreamwill be the solventthat exitsthe condenserof the firstcolumnand will be recycledandfedbackintothe column. We will adda recycle blockthat will calculate the correct flowrate andcomposition,butfornow we will enteraninitial guess. Inthe Worksheettabentera Temperature of 25°C, a Pressure of 1 bar, anda Molar Flowof 400 kgmole/h. In the CompositionformenterMole Fractions of 0.5 for cyclohexane andethanol.
  • 245.
  • 246.
    Dist-011H Revised:Nov20,2012 6 4.10. Wewill nowdefine the FeedandFeedRecycle streams. Double click onthe Feedstream. Thisisthe streamthat pumpsthe ethanol-watermixtureintothe process. Entera Vapour Fraction of 0.3, a Pressure of 1 bar, anda Molar Flowof 100 kgmole/h. Inthe CompositionformenterMole Fractionsof 0.87 forEthanol and 0.13 forWater. 4.11. Lastlywe will definethe FeedRecycle stream. Thisstreamwill be the ethanol-watermixture thatexits the condenserof the secondcolumn. Thisstreamwill be fedbackto the firstcolumnto preventlosses of ethanol. Lateronwe will implementarecycle blocktocalculate the actual specificationsforthis stream,butfor nowwe will enteraninitial guess. Doubleclickonthe FeedRecycle stream. Inthe Worksheettabentera Vapour Fraction of 0, a Pressure of 1 bar, and a Molar Flowof 25 kgmole/hr. In the CompositionformenterMole Fractions of 0.7 for Ethanol, and 0.3 forWater.
  • 247.
    Dist-011H Revised:Nov20,2012 7 4.12. Remembertofrequentlysaveyourprogressasyouare creatingthissimulation. Save thisfileas Dist- 011_Azeotropic_Distillation.hsc. 4.13. We are now readyto inserta Three Phase DistillationColumntothe flowsheet.
  • 248.
    Dist-011H Revised:Nov20,2012 8 4.14. Doubleclickonthe column(T-100) to openthe Three Phase Column InputExpert window. Inthe first windowthatappearsselectthe Distillationradiobutton. Click Next. 4.15. In the nextwindow,change the NumberofStages to 62. Make sure thatthe Condenserisselectedto checkfor two liquidphases. Click Nextwhencomplete.
  • 249.
    Dist-011H Revised:Nov20,2012 9 4.16. Inthe thirdwindow,selectthe Total radio buttonforCondenserType. Create a Light Outletstream calledSol-Rec,aHeavy Outlet streamcalled C2-Feed,andanEnergy streamcalled Q-Cond. Click Next whencomplete. 4.17. In the fourthwindow,leaveall fieldsblankandclick Next.
  • 250.
    Dist-011H Revised:Nov20,2012 10 4.18. TheDistillationColumnInput Expert window will now appear. Selectstreams Feed,FeedRecycle,and Solventas InletStreams. Specifystreams FeedandFeedRecycle toenteron stage 20, and stream Solventto enteronstage 1. Create a Bottoms LiquidOutletstream called ETOH. Click Nextwhen complete. 4.19. On Page 2 of the DistillationColumnInput Expert clickNext.
  • 251.
    Dist-011H Revised:Nov20,2012 11 4.20. OnPage 3 of the DistillationColumnInput Expert enterCondenserandReboilerPressuresof 1 bar. ClickNextwhencomplete. 4.21. On Page 4 of the DistillationColumnInput Expert leave all fieldsfortemperature estimatesblank. Click Next.
  • 252.
    Dist-011H Revised:Nov20,2012 12 4.22. Onthe final page of the DistillationColumnInput Expert clickDone to configure the column. 4.23. The Column: T-100 windowshouldautomaticallyopen. We mustdefine the designspecificationsfor thiscolumn. Go to the Specs Summary form underthe Designtab. For thiscolumnwe will specifythe Heavy RefluxRatio, the Light RefluxRatio, and the Mole Fraction of Ethanol inthe bottoms. Entera value of 3.5 for the Heavy RefluxRatio and a value of 1 for the Light RefluxRatio. Firstuncheckthe active box for Bot Product Rate andcheck the active boxesfor Light RefluxRatio and Heavy Reflux Ratio.
  • 253.
    Dist-011H Revised:Nov20,2012 13 4.24. Wemustcreate a specificationforthe mole fractionof ethanol inthe bottomsstream. Goto the Specs formunderthe Design tab. Click Addand selectColumnComponentFraction. SelectStreamfor Target Type, ETOH for Draw, enter0.9995 forSpec Value,and Ethanol forComponent. The columnshould automaticallysolve.
  • 254.
    Dist-011H Revised:Nov20,2012 14 4.25. Again,besure to periodicallysave yoursimulationasyoumake progress. 4.26. Before we constructthe secondcolumn,we will addan Adjust blockand a Spreadsheettofindthe correct flowrate forthe Make Up stream. 4.27. Double clickonthe spreadsheet(SPRDSHT-1). Goto the Spreadsheettab. Enter the followingtextin cellsA1 and A2.
  • 255.
    Dist-011H Revised:Nov20,2012 15 4.28. Rightclickoncell B1 andselectImport Variable. Selectthe MasterComp Molar Flow of Cyclohexane in streamETOH. 4.29. Rightclickon cell B2 andselectImport Variable. Selectthe MolarFlow of the Make Upstream. Having these twoflowratesside byside will easilyallow youtocheckthat the amountof solventleavingthe systemisequal tothe amount of solvententeringthe system.
  • 256.
    Dist-011H Revised:Nov20,2012 16 4.30. Asyoucan see fromthe spreadsheetthere ismore solventleavingthe systemthanisentering. Thiswill cause convergence issueswhenwe attempttoclose the recycle streams. Thisiswhere we willuse the adjustblock. Double clickonthe adjustblock(ADJ-1). Selectthe AdjustedVariable to be the Molar Flowof the Make Up stream,selectthe Target Variable to be the Master Comp Molar Flow (Cyclohexane) of streamETOH, andset the Target Value to cell B2 inthe spreadsheet.
  • 257.
    Dist-011H Revised:Nov20,2012 17 4.31. Theadjustblockwill varythe Make Up streamflowrate until the amountof solventleavingthe system equalsthe amountenteringthe system. Goto the Parameters tab. Change the Tolerance to 0.001 kgmole/hand change the StepSize to 0.01 kgmole/h. Clickthe Start buttonto begincalculations. After a fewmomentsthe flowsheetwill converge. 4.32. Openthe spreadsheetandyouwill see thatthe solventleavingthe systemisnow equal tothe solvent enteringthe system. 4.33. Save the simulation.
  • 258.
    Dist-011H Revised:Nov20,2012 18 4.34. Wewill nowadda Recycle blockto close the recycle loopforthe solvent. 4.35. Double clickonthe recycle block(RCY-1). Selectthe Inletstreamtobe Sol-Recandselectthe Outlet streamto be SolventRecycle. The flowsheetshouldconverge afterafew moments.
  • 259.
    Dist-011H Revised:Nov20,2012 19 4.36. Weare now readyto add the secondcolumn. Adda DistillationColumnSub-Flowsheetfromthe Model Palette. 4.37. Double clickonthe column(T-101) to openthe DistillationColumnInput Expert window. Change # Stages to 50 and selectstream C2 Feedasthe Inletstreamenteringonstage 35. SelectTotal for Condenserandcreate an Ovhd Liquid OutletcalledFeedRec,a Bottoms Liquid OutletcalledWater, and a CondenserEnergyStream calledQ-Cond2. ClickNextwhencomplete.
  • 260.
    Dist-011H Revised:Nov20,2012 20 4.38. OnPage 2 of the DistillationColumnInput Expert leave the defaultselectionsfora Once-through, Regular Hysys reboiler. Click Next.
  • 261.
    Dist-011H Revised:Nov20,2012 21 4.39. OnPage 3 of the DistillationColumnInput Expert enterCondenserandReboilerPressures of 1 bar. ClickNextwhencomplete. 4.40. On Page 4 of the DistillationColumnInput Expert leave all fieldsblankfortemperature estimates. Click Next.
  • 262.
    Dist-011H Revised:Nov20,2012 22 4.41. Onthe final page of the DistillationColumnInput Expert entera RefluxRatio of 0.5. ClickDone when complete toconfigure the column. 4.42. The Column: T-101 windowshouldautomaticallyopen. We needtodefine anotherdesignspecification inorder forthe columntosolve. Go to the SpecsSummary formunderthe Design tab andmake sure that the RefluxRatio is the onlyactive specification. 4.43. We mustnowcreate a specificationforthe mole fractionof waterinthe bottomsstream. Go to the Specs formunderthe Designtab. Click Add and selectColumnComponentFraction. SelectStream for Target Type, Waterfor Draw, enter0.99 for SpecValue,and selectH2O for Component.
  • 263.
    Dist-011H Revised:Nov20,2012 23 4.44. TheDegreesof Freedomforthe columnshouldnow be 0. Click Run to begincalculations. The column shouldsolve.
  • 264.
    Dist-011H Revised:Nov20,2012 24 4.45. Savethe simulation. 4.46. The last stepisto connectthe FeedRecycle loop. Adda Recycle blockto the flowsheet. 4.47. Double clickonthe recycle block(RCY-2). SelectstreamFeedRecas the Inletand streamFeedRecycle as the Outlet. The flowsheetwillbegintosolve. Afteraminute ortwothe flowsheetwill solve. Be patientasthere are manyvariablesattemptingtoconverge. Ateachiterationbothrecycle loopsmust converge,bothcolumnsmustconverge,andthe adjustblockmustconverge.
  • 265.
    Dist-011H Revised:Nov20,2012 25 4.48. Theflowsheetisnowcomplete andshouldlooksimilartothe following.
  • 266.
    Dist-011H Revised:Nov20,2012 26 5. Conclusions Inthisexample, cyclohexaneisusedasthe entrainertoseparate waterandethanol toproduce anhydrous ethanol. Byusingthe properamountof solvent,we obtainpure ethanolfromthe bottomof the firstcolumn. The stream fromthe top of the firstcolumnisseparatedintotwostreams usingathree phase condenser:One streamis solventrichandisrecycledbackto the firstcolumn as solvent;the otherstreamiswell withinanother distillationregionsothatwe can use the secondcolumntoobtainpure water. The topstream of the second columnisrecycledbackto the firstcolumnasfeed. 6. Copyright Copyright© 2012 by AspenTechnology,Inc.(“AspenTech”). All rightsreserved. Thisworkmaynot be reproducedordistributedinanyformor byany meanswithoutthe priorwrittenconsentof AspenTech. ASPENTECHMAKESNOWARRANTYOR REPRESENTATION,EITHER EXPRESSEDOR IMPLIED, WITH RESPECT TO THIS WORK and assumesnoliabilityforanyerrorsor omissions. Innoeventwill AspenTechbe liable toyoufordamages,includinganylossof profits,lostsavings,orotherincidental orconsequential damagesarisingoutof the use of the informationcontainedin,orthe digital filessuppliedwithorforuse with, thiswork. This workand itscontentsare providedforeducational purposesonly. AspenTech®,aspenONE®,andthe Aspenleaf logo,are trademarksof AspenTechnology,Inc.. Brandsand productnamesmentionedinthisdocumentationare trademarksorservice marksof theirrespective companies.
  • 267.
    Dist-012H Revised:Nov19,2012 1 Extractive Distillationfor Heptane-Toluene Separation using Aspen HYSYS® V8.0 1. Lesson Objectives  Essentialsof extractivedistillation  How to compare designalternatives 2. Prerequisites  Aspen HYSYS V8.0  Introductiontodistillation 3. Background Whenthe two componentsinabinarymixture have veryclose normal boilingpoints,theirrelativevolatilityis likelytobe small if theydonotform an azeotrope. Forsuchcases,it may be more efficienttouse extractive distillation withasolventthannormal distillation. Inextractive distillation,alessvolatile solventisusedto increase the relative volatilitiesof the original mixtures,allowingforeasierseparation. Inthisexample,phenol isusedas the solventforthe separationof n-heptane andtoluene. The examplespresentedare solelyintendedtoillustrate specificconceptsand principles. Theymay not reflectan industrial application or real situation. 4. Problem Statement and Aspen HYSYS Solution Problem Statement Determine whetherconventional distillationorextractivedistillationwithphenol asasolventis a more efficient methodtoseparate n-heptane andtoluene. Aspen HYSYS Solution 4.01. We will buildmodelstosimulate the separationof n-heptane andtoluene. One modelhasa single distillation columnandthe otheruses the extractivedistillationapproachwithtwocolumns. First we will buildasimulationforasingle distillationcolumn. Starta new simulationusing inAspenHYSYSV8.0. 4.02. Create a componentlist. Inthe ComponentLists folderselectAdd. Addn-Heptane and Toluene tothe componentlist.
  • 268.
    Dist-012H Revised:Nov19,2012 2 4.03. Selectpropertypackage.Inthe FluidPackages folderselectAdd. SelectNRTLas the propertypackage and selectRK as the Vapour Model. 4.04. Go to the simulationenvironmentbyclickingthe Simulationbuttoninthe bottomleftof the screen.
  • 269.
    Dist-012H Revised:Nov19,2012 3 4.05. Placea DistillationColumnSub-Flowsheetonthe mainflowsheetfromthe Model Palette. 4.06. Double clickonthe column(T-100) to openthe DistillationColumnInput Expert. On Page 1 enterthe followinginformationandclick Nextwhencomplete.
  • 270.
    Dist-012H Revised:Nov19,2012 4 4.07. OnPage 2 of the Input Expert leave the defaultselectionsfora Once-through,Regular Hysys reboiler. ClickNext. 4.08. On Page 3 of the Input Expert enterCondenserandReboilerPressuresof 1 bar. Click Nextwhen complete.
  • 271.
    Dist-012H Revised:Nov19,2012 5 4.09. OnPage 4 and 5 of the InputExpert leave all fieldsempty. Click Done onthe final page toconfigure the column. 4.10. In the Column:T-100 windowgotothe Worksheettabto specifythe feedstream. Forthe Feedstream entera Vapour Fraction of 0.5, a Pressure of 1 bar, and a Molar Flowof 100 kgmole/h. 4.11. In the Compositionformunderthe WorksheettabenterMole Fractions of 0.5 forboth components. Thisstreamshouldsolve. 4.12. Nowwe must define the columndesignspecifications. Goto the SpecsSummary form underthe Designtab. Uncheck the Active boxessothat there are noactive specifications.
  • 272.
    Dist-012H Revised:Nov19,2012 6 4.13. Goto the Specsformunderthe Designtab. We want to add a specificationforthe mole purityof both productstreams. Click Add and selectColumnComponentFraction. SelectStreamfor Target Type, Heptane for Draw, enter0.99 for SpecValue,and selectn-Heptane forComponent. 4.14. Adda similarspecificationforthe mole fractionof tolueneinthe bottomsproductstream.
  • 273.
    Dist-012H Revised:Nov19,2012 7 4.15. AfterenteringbothdesignspecificationstheDegreesofFreedomshouldnow be 0. Click Run to begin calculations. The columnshouldconverge. 4.16. Go to the Cond./Reboilerformunderthe Performance tab. Make a note of boththe Condenserand Reboilerduties. The CondenserDutyis5.390e+006 kcal/h and the ReboilerDuty is5.388e+006 kcal/h.
  • 274.
    Dist-012H Revised:Nov19,2012 8 4.17. Savethisfile as Dist-012H-Single_Column.hsc. 4.18. We will nowcreate asecondsimulation,thistimeusingextractive distillation. Create anew file in AspenHYSYS V8.0. 4.19. Create a componentlist. Inthe ComponentLists folderselectAdd. Addn-Heptane,Toluene,and Phenol to the componentlist. 4.20. Selectpropertypackage. Inthe FluidPackages folderselectAdd. SelectNRTLas the propertypackage and selectRK as the Vapour Model.
  • 275.
    Dist-012H Revised:Nov19,2012 9 4.21. Goto the simulationenvironmentbyclickingthe Simulationbuttoninthe bottomleftof the screen. 4.22. Adda DistillationColumnSub-Flowsheettothe mainflowsheetfromthe Model Palette.
  • 276.
    Dist-012H Revised:Nov19,2012 10 4.23. Doubleclickonthe column(T-100) to openthe DistillationColumnInput Expert. Enter the following informationon Page 1 and click Next whencomplete.
  • 277.
    Dist-012H Revised:Nov19,2012 11 4.24. OnPage 2 of the Input Expert leave the defaultselectionsfora Once-through,Regular Hysys reboiler. ClickNextwhencomplete. 4.25. On Page 3 of the Input Expert enterCondenserandReboilerPressuresof 1 bar. Click Nextwhen complete. 4.26. On Page 4 and 5 leave all fieldsempty. ClickDone onthe final page to configure the column. 4.27. Firstwe must define the feedstreams. Inthe Column:T-100 window goto the Worksheettab. For the Feedstreamentera Vapour Fraction of 0.5, a Pressure of 1 bar, and a Molar Flow of 100 kgmole/h. For the Solventstreamentera Temperature of 181°C, a Pressure of 1 bar, and a Molar Flow of 60 kgmole/h.
  • 278.
    Dist-012H Revised:Nov19,2012 12 4.28. Inthe Compositionformunderthe WorksheettabenterMole Fractions of 0.5 forn-Heptane and Toluene inthe Feedstream,and a Mole Fraction of 1 for Phenol inthe Solventstream. Bothstreams shouldsolve. 4.29. We mustnowdefine ourdesignspecificationsforthe column. Goto the SpecsSummary sheetunder the Designtab. We want to specifyadistillate productrate of 50 kgmole/h withamole fractionof 0.99 n-Heptane. Enter50 kgmole/h inthe fieldforVentRate and uncheckthe active box for RefluxRatio.
  • 279.
    Dist-012H Revised:Nov19,2012 13 4.30. Goto the Specsformunderthe Designtab. Here we will adda specificationforthe mole fractionof heptane inthe distillate stream. Click AddandselectColumnComponentFraction. SelectStreamfor Target Type, Heptane for Draw, enter0.99 forSpec Value,and selectn-Heptane forComponent. 4.31. The Degreesof Freedomforthe columnshouldnow be 0. Click Run to begincalculations. The column shouldsolve. 4.32. We mustnowadd a secondcolumnto separate the solventfromthe tolueneinthe Rich-Solvent stream. Inserta second DistillationColumnSub-Flowsheetfromthe Model Palette.
  • 280.
    Dist-012H Revised:Nov19,2012 14 4.33. Doubleclickonthe secondcolumn(T-101) to openthe DistillationColumnInput Expert. OnPage 1 enterthe followinginformationandclick Nextwhencomplete. 4.34. On Page 2 of the Input Expert leave the defaultselectionsforOnce-through,RegularHysys reboiler. ClickNext. 4.35. On Page 3 of the Input Expert enterCondenserandReboilerPressuresof 1 bar. Click Nextwhen complete.
  • 281.
    Dist-012H Revised:Nov19,2012 15 4.36. OnPage 4 and 5 of the InputExpert leave all fieldsblankandclick Done on the final page toconfigure the column. 4.37. We mustdefine the designspecificationsforthissecondcolumn. Goto the Spec Summary formunder the Designtab. Uncheck the active boxessothat there are no active specifications. 4.38. Go to the Specsformunderthe Designtab. Here we will create twospecificationsforthe mole fractionsof toluene andphenol inthe productstreams. Click Addand selectColumnComponent Fraction. SelectStreamfor Target Type,Toluene forDraw, enter0.99 for SpecValue,and select Toluene forComponent.
  • 282.
    Dist-012H Revised:Nov19,2012 16 4.39. Addasimilarspecificationforthe mole fractionof phenol inthe bottomsproductstream. Enter.99999 for SpecValue. 4.40. The Degreesof Freedomforthe columnshouldnow be 0. Click Run to begincalculations. The column shouldconverge.
  • 283.
    Dist-012H Revised:Nov19,2012 17 4.41. Wewill nowrecycle the Lean-Solventstreambacktothe firstcolumn.Adda Recycle blockto the flowsheetfromthe Model Palette.
  • 284.
    Dist-012H Revised:Nov19,2012 18 4.42. Doubleclickonthe recycle block(RCY-1). SelectstreamLean-Solventasthe Inletandstream Solventas the Outlet. The recycle blockshouldsolve. 4.43. Checkresults. Double clickonthe firstcolumn(T-100) andgo to the Cond./Reboilerformunderthe Performance tab. Make note of the CondenserandReboilerDuties.
  • 285.
    Dist-012H Revised:Nov19,2012 19 4.44. Doubleclickthe secondcolumn(T-101) and go to the Cond./Reboilerformunderthe Performance tab. Make a note of the CondenserandReboilerDuties. 4.45. The followingtable will summarizethe energyrequirementsfromthe case with1 columnversus the case usingextractive distillation. Single Column Distillation Extractive Distillation Total Heating Duty (kcal/h) 5,388,000 1,803,000 Total Cooling Duty (kcal/h) 5,390,000 1,410,000 5. Conclusions For the separationof n-heptane andtoluene,extractive distillationhas asignificantadvantage intotal energy requirements. Addingphenolasa solventincreasedthe relative volatilitiesof n-heptane andtolueneinthe mixture andallowedforamuch easierseparation. However,extractive distillationrequiredmore equipmentin thiscase.Therefore afurtheranalysisoncapital versusoperationalcostswouldhave tobe performedinorder to make a decisionasto whichdesignisthe betteroption.
  • 286.
    Dist-012H Revised:Nov19,2012 20 6. Copyright Copyright©2012 by AspenTechnology,Inc.(“AspenTech”). All rightsreserved. Thisworkmaynotbe reproducedordistributedinanyformor byany meanswithoutthe priorwrittenconsentof AspenTech. ASPENTECHMAKESNOWARRANTYOR REPRESENTATION,EITHER EXPRESSEDOR IMPLIED, WITH RESPECT TO THIS WORK and assumesnoliabilityforanyerrorsor omissions. Innoeventwill AspenTechbe liable toyoufordamages,includinganylossof profits,lostsavings,orotherincidental orconsequential damagesarisingoutof the use of the informationcontainedin,orthe digital filessuppliedwithorforuse with, thiswork. This workand itscontentsare providedforeducational purposesonly. AspenTech®,aspenONE®,andthe Aspenleaf logo,are trademarksof AspenTechnology,Inc.. Brandsand productnamesmentionedinthisdocumentationare trademarksorservice marksof theirrespective companies.
  • 287.
    Dist-017H Revised:November6,2012 1 Sour WaterStripper with Aspen HYSYS® V8.0 1. Lesson Objectives  Configure distillationcolumn  Configure heatexchanger  Optimize columnfeedtemperature 2. Prerequisites  Aspen HYSYS V8.0  Introductiontodistillation 3. Background Many refineryoperationsproduce whatiscalledsourwater. Anyrefineryprocesswaterthatcontainssulfidesis consideredtobe sourwater. Sour watertypicallycontainsammoniaandhydrogensulfide,whichmustbe removedbefore the watercanbe repurposedorsenttoa wastewatersystem. Inthislessonwe willsimulate thisprocessas well asanalyzingthe effectthatfeedtemperaturehasonthe column. The examplespresentedare solelyintendedtoillustrate specificconceptsand principles. Theymay not reflectan industrial application or real situation. 4. Problem Statement and Aspen HYSYS Solution Problem Statement Constructa simulationof asour waterstripperusing AspenHYSYS. A sour waterstream containingmass fractionsof 0.988 water,0.005 ammonia,and0.007 hydrogensulfideisproducedfromacrude tower. This streamis at 37.78°C, 2.758 bar, andhas a massflow of 328,900 kg/h. The goal isto produce a pure water streamwitha maximumof 0.00005 mole % ammoniawhile recovering99% of the waterin the feedstream.
  • 288.
    Dist-017H Revised:November6,2012 2 Aspen HYSYSSolution 4.01. Create a newsimulationin AspenHYSYSV8.0. 4.02. Create a componentlist. Inthe ComponentList folderselectAdd. AddWater, Ammonia,and Hydrogen Sulfide tothe componentlist. 4.03. Define propertypackage. Inthe FluidPackagesfolderselectAdd. SelectSourPR as the property package. The SourPR model combinesthe Peng-Robinsonequationof state andWilson’sAPI-Sour Model for handlingsourwatersystems. 4.04. Enter the simulationenvironmentbyclickingthe Simulationbuttoninthe bottomleftof the screen. 4.05. Adda Material Stream to the flowsheetfromthe Model Palette. Thisstreamwill serve asoursour waterfeed.
  • 289.
    Dist-017H Revised:November6,2012 3 4.06. Doubleclickonthe material stream(1). In the Worksheettab,rename thisstream Sour Water. Entera Temperature of 37.78°C, a Pressure of 2.758 bar, and a Mass Flow of 328,900 kg/h.
  • 290.
    Dist-017H Revised:November6,2012 4 4.07. Inthe Compositionformunderthe Worksheettab,enterMass Fractions of 0.988 for H2O, 0.007 for H2S, and0.005 for Ammonia. The streamshouldnow be fully definedandwill solve. 4.08. Adda Heaterto the flowsheetfromthe Model Palette. Thisheaterwillserve toheatthe sourwater streambefore itentersthe column. 4.09. Double clickonthe heater(E-100). SelectstreamSour Wateras the Inlet,create an Outletstream calledStripperFeed,andcreate an Energy streamcalled Q-Heat.
  • 291.
    Dist-017H Revised:November6,2012 5 4.10. Inthe Parameters formunderthe Designtab, specifyaDelta P of 0.6895 bar. 4.11. In the Worksheettabenteran outlet Temperature of 100°C. The heatershouldsolve.
  • 292.
    Dist-017H Revised:November6,2012 6 4.12. AddaDistillationColumnSub-Flowsheetfromthe Model Palette. 4.13. Double clickonthe column(T-100). The DistillationColumnInput Expertwill open. Onpage 1 of the inputexpertenterthe followinginformationandclick Nextwhencomplete.
  • 293.
    Dist-017H Revised:November6,2012 7 4.14. OnPage 2 of the Input Expert,leave the defaultsettingsfora Once-through,Regular Hysys reboiler. ClickNext. 4.15. On Page 3 of the Input Expert,entera CondenserPressure of 1.979 bar and a ReboilerPressure of 2.255 bar. Click Nextwhencomplete.
  • 294.
    Dist-017H Revised:November6,2012 8 4.16. OnPage 4 of the Input Expert leave all fieldsfortemperature estimatesblank. Click Next. Onthe final page of the Input Expert leave all fieldsblankandclick Done toconfigure the column. 4.17. The Column: T-100 windowwill automaticallyappear. Goto the Specs formunderthe Designtab to complete the columnspecifications. Firstwe will create aspecificationforthe mole fractionof ammoniainthe reboiler. Click AddandselectColumnComponentFraction. SelectReboilerforStage, enter0.00005 forSpec Value,andselectAmmoniafor Component. 4.18. We alsowouldlike torecover99% of the water fromthe feedstream. Create thisspecificationby clickingAddand selectingColumnComponentRecovery. SelectWaterforDraw, enter0.99 forSpec Value,and selectH2O forComponent.
  • 295.
    Dist-017H Revised:November6,2012 9 4.19. Goto the SpecsSummary form and make sure that the onlyactive specificationsare CompFractionand Comp Recovery. Once these twospecificationsare made active the columnwill attempttosolve. If the solverfailstoconverge youmayneedtotake a lookat the Damping Factor. 4.20. Go to the Solverformunderthe Parameters tab. You will notice adefault DampingFactor of 1. The dampingfactorservestoreduce the amplitude of oscillationsthatoccurinthe solver. Oftentimes convergence canbecome cyclic,whichcanpreventthe solverfromfindingasolution. Thisiswhere a dampingfactorbecomesuseful. If youclickthe Troubleshootingiconon the ribbonunderGetStarted and searchfor ‘dampingfactor’youwill see the followingguidelines. 4.21. We are workingwitha sour waterstripper,therefore the recommendeddampingfactorisbetween0.25 and 0.5. Inthe Solverformunderthe Parameters tab, entera FixedDampingFactor of 0.4. After clickingRun,the columnshouldsolve.
  • 296.
    Dist-017H Revised:November6,2012 10 4.22. Savethisfile before continuing. 4.23. If you lookat the Water streamleavingthe reboiler,youwill notice thatthisstreamcontains superheatedwater. We can potentiallyuse the energyof this streamtoheatthe columnfeedstream, thusloweringthe energyinputrequiredforthisprocess. Delete the heaterblock(E-100) and place a Heat Exchanger block onto the flowsheet. Note thatyoucan rightclickon the Heat Exchanger block and selectChange Iconto selecta differenticontodisplay.
  • 297.
    Dist-017H Revised:November6,2012 11 4.24. Doubleclickonthe heat exchanger(E-100). SelectstreamSourWater as the Tube Side Inlet, StripperFeedasthe Tube Side Outlet,Water as the Shell Side Inlet,andcreate a streamcalled Water- Cool for the Shell Side Outlet. 4.25. In the Parameters formunderthe Designtab entera Pressure Drop of 0.6895 bar for boththe Shell and Tube side. Alsochange the numberof Tube Passesto 1. The heatexchangershouldsolve.
  • 298.
    Dist-017H Revised:November6,2012 12 4.26. Wewill nowperformacase studyto determine the optimalcolumnfeedtemperature. Inthe NavigationPane clickthe Case Studiesfolderandselect Add. In Case Study 1, addthe StripperFeed Temperature and the Heat Flows of energy streamsQ-Condand Q-Reb. 4.27. For the IndependentVariable (StripperFeedTemperature),entera Low Bound of 80°C, a High Bound of 115°C, and a Step Size of 2°C. 4.28. ClickRun to beginthe calculations. Toview resultsgotothe Resultsor the Plotstab.
  • 299.
    Dist-017H Revised:November6,2012 13 4.29. Fromthe case study,you can see thatat higherfeedtemperatureswe have alowerreboilerdutybuta highercondenserduty. Since the costof steamisgenerallyhigherthanthe cost of coolingwater,we shouldincrease the temperature of the columnfeedstreamto115°C. 5. Conclusions In thislessonwe learnedhowtosimulateasourwaterstrippingprocess. We configuredadistillationcolumnas well asa heat exchanger. Itwasdeterminedthroughthe use of a case studythat a highercolumnfeed temperature willleadtolowerenergycostsforthisseparation. 6. Copyright Copyright© 2012 by AspenTechnology,Inc.(“AspenTech”). All rightsreserved. Thisworkmaynotbe reproducedordistributedinanyformor byany meanswithoutthe priorwrittenconsentof AspenTech. ASPENTECHMAKESNOWARRANTYOR REPRESENTATION,EITHER EXPRESSEDOR IMPLIED, WITH RESPECT TO THIS WORK and assumesnoliabilityforanyerrorsor omissions. Innoeventwill AspenTechbe liable toyoufordamages,includinganylossof profits,lostsavings,orotherincidental orconsequential damagesarisingoutof the use of the informationcontainedin,orthe digital filessuppliedwithorforuse with, thiswork. This workand itscontentsare providedforeducational purposesonly. AspenTech®,aspenONE®,andthe Aspenleaf logo,are trademarksof AspenTechnology,Inc.. Brandsand productnamesmentionedinthisdocumentationare trademarksorservice marksof theirrespective companies.
  • 300.
    Dist-018H Revised:December3,2012 1 Atmospheric CrudeTower with Aspen HYSYS® V8.0 1. Lesson Objectives  Assignpetroleumassaytostream  Configure columnpre-heater  Configure crude tower 2. Prerequisites  Aspen HYSYS V8.0  Introductiontodistillation 3. Background Oil refineriestake crude oil andseparate itintomore useful/valuable productssuchasnaphtha,diesel, kerosene,andgasoil. Anatmosphericdistillationcolumnisone of the manyunitoperationsthatcan be found inan oil refinery. Crude oil isfed intothe atmosphericdistillationcolumnandseveral fractionsare produced whichare thenfedtootherprocessunitssuch as hydrotreaters,hydrocrackers,reformers,andvacuum distillationcolumns. Inthislessonwe will be focusingsolelyonthe atmosphericcrude unit. The examplespresentedare solelyintendedtoillustrate specificconceptsand principles. Theymay not reflectan industrial application or real situation. 4. Problem Statement and Aspen HYSYS Solution Problem Statement In thissimulation we wishtosimulate anatmosphericcrude fractionator. 100,000 barrel/dayof ArabianLight crude is fed to a furnace that will vaporize aportionof the crude. Thiscrude streamis thenfed to an atmosphericcrude column. The columnwill operate with three coupledside strippers andthree pumparound circuits. Aspen HYSYS Solution 4.01. Create a newsimulationin AspenHYSYSV8.0. 4.02. Create a componentlist. Inthe ComponentList folder, selectAdd. AddWater,Methane,Ethane, Propane,i-Butane,and n-Butane to the componentlist.
  • 301.
    Dist-018H Revised:December3,2012 2 4.03. Addhypotheticalstothecomponentlist. Inthe ComponentList – 1 form, change the Selectoptionto Hypothetical. Enter an Initial BoilingPoint of 30°C, a Final BoilingPointof 900°C, and an Interval of 10°C. ClickGenerate Hyposto generate ahypothetical group.
  • 302.
    Dist-018H Revised:December3,2012 3 4.04. Aftergeneratingthehypothetical group,click AddAll to add all generatedhypotheticalstothe componentlist. 4.05. Define propertypackage. Inthe FluidPackagesfolderselectAdd. SelectPeng-Robinsonasthe propertypackage.
  • 303.
    Dist-018H Revised:December3,2012 4 4.06. Wewill nowcharacterize ourcrude oil. Go to the PetroleumAssaysfolder. Click Add. Enter Arabian Light for Name,selectSpecifiedforAssaySource,and selectBasis-1for FluidPackage. 4.07. In the Arabian Light form,selectImport From. A window will appear,select AssayLibrary. 4.08. The Assay Library windowwill appear. Since we wishtomodel the ArabianLightcrude,we will select Middle East for RegionName,and Saudi Arabia for Country Name. We can thenselect Arabian Light and click Import SelectedAssay.
  • 304.
    Dist-018H Revised:December3,2012 5 4.09. Afterafewmomentsthe distillationcutdatafor the ArabianLightcrude will populate the Assay Property form.
  • 305.
    Dist-018H Revised:December3,2012 6 4.10. Goto the Light Ends formto enterdata forthe lightcomponentstobe includedinthe crude. Enterthe followingVolume %foreachcomponent. Checkthe box for Inputand entera Total Percentage of 1.4. Thismeansthat the specifiedlightendswill comprise1.4percentof the total crude. 4.11. Move backto the Assay Property formand click Calculate Assay. Aftera few momentsthe statusbar shouldturngreenandsay OK. You can go to the Resultstab to view atrue boilingpoint(TBP) curve, composition data,andbulkpropertiesof the crude,amongotherresults.
  • 306.
    Dist-018H Revised:December3,2012 7 4.12. Weare now readyto move tothe simulationenvironmenttobegincreatingourflowsheet. Clickthe Simulationbuttoninthe bottomleftof the screen. 4.13. In the Home ribbon,change the unitsto Fieldunits. 4.14. Adda material streamtothe flowsheet. Thiswill be ourcrude feedwhichwill be heatedbyafurnace and thenfedtothe distillationcolumn.
  • 307.
    Dist-018H Revised:December3,2012 8 4.15. Doubleclickthe material streamandrename it Raw Crude. Entera Temperature of 77°F, a Pressure of 58.02 psia (4 bar),and a Std Ideal Liq Vol Flowof 100,000 barrels/day. 4.16. We mustnowattach the petroleumassaytothisstream. Go to the PetroleumAssay formand select PetroleumAssay From Library. Next,selectArabianLight. You will notice thatthe streamcompositions will populate andthe streamwill solve.
  • 308.
    Dist-018H Revised:December3,2012 9 4.17. Ifyou go to the Compositionformyouwill see thatthe compositionforall hypothetical components and lightendsare complete.
  • 309.
    Dist-018H Revised:December3,2012 10 4.18. Wewill nowadda Heater blockto the flowsheet. Thiswill serve topre-heatthe crude streamand prepare itto enterthe distillationcolumn.
  • 310.
    Dist-018H Revised:December3,2012 11 4.19. Doubleclickthe heaterblock(E-100). SelectRaw Crude as the Inletstream, create an Outlet stream calledColumnFeed,andcreate anEnergystream called Q-Heat.
  • 311.
    Dist-018H Revised:December3,2012 12 4.20. Inthe Parameters form,entera Delta P of 7.252 psi (0.5 bar). 4.21. In the Worksheettabenteran outlet Temperature of 626°F. The heatershouldsolve.
  • 312.
    Dist-018H Revised:December3,2012 13 4.22. Beforeaddingthe columntothe flowsheet,we mustfirstdefine the steamandenergystreamsthatwill be usedby the column. Add 3 Material Streams to the flowsheet. Name them MainSteam, Diesel Steam, andAGO Steam.
  • 313.
    Dist-018H Revised:December3,2012 14 4.23. Doubleclickoneach steamstreamand enterthe followinginformation. Entera Mole Fraction of 1 for Water foreach streamas well. Stream Name Vapor Fraction Pressure (psia) Mass Flow (lb/hr) Main Steam 1 145 6614 Ago Steam 1 145 2205 Diesel Steam 1 145 2205 4.24. Addan Energy streamcalled Q-Trim. This streamdoesnotrequire anyspecifications;itwill be calculatedbythe column.
  • 314.
    Dist-018H Revised:December3,2012 15 4.25. AddaBlank ColumnSub-Flowsheetfromthe Model Palette. 4.26. A windowwill appear,select Readan ExistingColumn Template. 4.27. Selecttemplate 3sscrude.col andclick Open.
  • 315.
    Dist-018H Revised:December3,2012 16 4.28. Thecolumnpropertywindowwill appear. Onthe Design| Connections form, youcan view all the internal streamswithinthe columnsub-flowsheet. The firstthingwe mustdois connectthe Internal and External Streams as shownbelow. Alsoenteratopstage pressure of 14.5 psia anda bottom pressure of 20.31 psia.
  • 316.
    Dist-018H Revised:December3,2012 17 4.29. Wemustnowmodifythe stage locationsforthe side strippersandpumparounds. Go to the Side Ops tab. In the Side Strippersform selectthe following LiqDraw andVap Return Stages. 4.30. In the Pump Arounds formselectthe following Drawand Return Stages. 4.31. We mustnowdefine the columnoperatingspecifications. Goto the Specs formunderthe Design tab. You will notice thatinorderto run thiscolumnyoumustdefine 13 specifications. The table below summarizesthe designspecificationschosenforthiscolumn. Specification Spec Value Reflux Ratio 1 Condenser Temp 110°F Kerosene D86 95% Temperature 520°F Diesel D86 95% Temperature 665°F AGO TBP 95% Temperature 885°F Pump Around 1 Return Temp 175°F Pump Around 2 Return Temp 310°F Pump Around 3 Return Temp 450°F Vapour Flow off condenser 0 kgmole/h Kerosene SS Duty 3.966 MMBtu/hr Pump Around 1 Draw Rate 15,100 barrel/day Pump Around 2 Draw Rate 15,100 barrel/day Pump Around 3 Draw Rate 15,100 barrel/day 4.32. In the Specsform itmay be easiesttoinitiallydelete all of the defaultspecificationsforthe column.
  • 317.
    Dist-018H Revised:December3,2012 18 4.33. ClickAddto addeach designspecificationone byone. The followingpageswillinclude ascreenshotof each individual specificationwindow. Reflux Ratio Condenser Temperature
  • 318.
    Dist-018H Revised:December3,2012 19 Kerosene D8695% Temperature The D86 95% stream property is found under the Petroleum branch after clicking Select Property.
  • 319.
    Dist-018H Revised:December3,2012 20 Diesel D8695% Temperature AGO TBP 95% Temperature The TBP 95% stream property is found under the Petroleum branch after clicking Select Property.
  • 320.
    Dist-018H Revised:December3,2012 21 Pump Around1 Return Temperature Pump Around 2 Return Temperature
  • 321.
    Dist-018H Revised:December3,2012 22 Pump Around3 Return Temperature Vapour Flow off condenser
  • 322.
  • 323.
    Dist-018H Revised:December3,2012 24 Pump Around2 Draw Rate Pump Around 3 Draw Rate 4.34. Once all 13 specificationsare enteredyoushouldnoticethatthe DegreesofFreedomisnow 0. This meansthat the columnisreadyto begincalculations.
  • 324.
    Dist-018H Revised:December3,2012 25 4.35. Beforewe runthe column,we will entertopandbottomstage temperature estimatestohelpthe columnto converge. Goto the Profilesformunderthe Parameterstab. Enter a Condenser temperature of 110°F and a Stage 29 temperature of 630°F. The bottom stage temperature estimate was chosenbecause we knowthe columnfeedstreamisbeingfedinto stage 29, therefore the stage 29 temperature shouldbe aroundthe same temperature.
  • 325.
    Dist-018H Revised:December3,2012 26 4.36. ClicktheRun buttonand the columnwill begincalculations. Afterafew momentsthe columnshould converge.
  • 326.
    Dist-018H Revised:December3,2012 27 4.37. Checkresults.Go to the Summary form underthe Performance tab. Here youcan view the flowrates and compositionsforeachproductstream. Note thatArabianLightis a lightcrude,therefore there isa large flowrate forthe lightproductsinthe napthastream, and lowerflowratesforkerosene,diesel,and gas oil.
  • 327.
    Dist-018H Revised:December3,2012 28 5. Conclusions Inthislessonwe learnedhowto model apetroleumassayandassignastreamto an assay. We also learnedhow to insertandconfigure anatmosphericcrude towertoproduce petroleumproducts. A lightcrude,suchas ArabianLight,will produce ahighquantityof lightproductssuchas gasoline andnaptha,while aheaviercrude will produce ahigherquantityof heavierproductssuchaskerosene,diesel,andfuel oil. 6. Copyright Copyright© 2012 by AspenTechnology,Inc.(“AspenTech”). All rightsreserved. Thisworkmaynotbe reproducedordistributedinanyformor byany meanswithoutthe priorwrittenconsentof AspenTech. ASPENTECHMAKESNOWARRANTYOR REPRESENTATION,EITHER EXPRESSEDOR IMPLIED, WITH RESPECT TO THIS WORK and assumesnoliabilityforanyerrorsor omissions. Innoeventwill AspenTechbe liable toyoufordamages,includinganylossof profits,lostsavings,orotherincidental orconsequential damagesarisingoutof the use of the informationcontainedin,orthe digital filessuppliedwithorforuse with, thiswork. This workand itscontentsare providedforeducational purposesonly. AspenTech®,aspenONE®,andthe Aspenleaf logo,are trademarksof AspenTechnology,Inc.. Brandsand productnamesmentionedinthisdocumentationare trademarksorservice marksof theirrespective companies.
  • 328.
    Dist-019H Revised:Nov8,2012 1 Propylene GlycolProduction with Aspen HYSYS® V8.0 1. Lesson Objectives  Use Aspen HYSYSto simulate the productionprocessforpropylene glycol 2. Prerequisites  Aspen HYSYS V8.0 3. Background Propylene glycol(C3H8O2)isaverycommonorganic compoundthatis usedinmanyapplications. Itisusedas an oil dispersant,asolventinpharmaceuticals,anantifreeze,andasa moisturizer, andmanyotherapplications.It isproducedviathe hydrolysisof propylene oxide whichisusuallyacceleratedbyacidorbase catalysis. Reaction productstypicallycontainaround20% of propylene glycol, andthereforefurtherseparation(distillation) is requiredinordertoyieldaproduct streamwith99.5% propyleneglycol. The examplespresentedare solelyintendedtoillustrate specificconceptsand principles. Theymay not reflectan industrial application or real situation. 4. Problem Statement and Aspen HYSYS Solution Problem Statement Simulate the propylene glycol productionprocess,includingthe reactionandseparationprocesses. Assume a propylene oxide feedstreamof 3952 kg/hand a waterfeedstreamof 4990 kg/h. Our goal is to produce a final productcontaining99.5% propylene glycol. Assume aCSTRreactor witha volume of 8,000 L. The simplified reactionkineticsare shownbelow.
  • 329.
    Dist-019H Revised:Nov8,2012 2 ( )( ) Designa distillationcolumnthatiscapable of producinga productwith99.5% puritywhile recovering100%of the product fedtothe column. Aspen HYSYS Solution 4.01. Create a newsimulationin AspenHYSYSV8.0. 4.02. Create a componentlist. Inthe ComponentLists folderselectAdd. Addwater, propylene oxide,and propylene glycol to the componentlist. 4.03. Define propertymethods. Inthe FluidPackagesfolderselectAdd. SelectUNIQUACasthe property package. 4.04. Define reaction. Goto the ReactionsfolderandselectAddto create a new reactionset. In Set-1 click Add Reaction and selectKinetictoadda new kineticreaction.
  • 330.
    Dist-019H Revised:Nov8,2012 3 4.05. Doubleclick Rxn-1to specifythe kineticreaction. Selectthe reactantsandproductcomponentsand enterthe stoichiometriccoefficients(-1forwaterand propylene oxide,and1 for propylene glycol). Change the Fwd Order forwater to 0. Select12C3Oxide for Base Componentand CombinedLiquidfor Rxn Phase. Change the Basis Unitsto kgmole/m3 and the Rate Units to kgmole/m3-h. Enter1.7e+13 for A, and75362 kJ/kgmole (18012 kcal/kgmole)forE. 4.06. Close the reactiondefinitionwindow whencomplete. Clickthe AddtoFP buttonand select Basis-1to attach the reactionsetto a fluidpackage.
  • 331.
    Dist-019H Revised:Nov8,2012 4 4.07. Enterthe simulationenvironmentby clickingthe Simulationbuttoninthe bottomleftof the screen. 4.08. Adda Material Stream to the flowsheet. Thisstreamwill be the propylene oxidefeedstream. Double clickon the streamonce yousuccessfullyplace itontothe flowsheet. 4.09. Change the name of thisstreamto Prop Oxide. Entera Temperature of 25°C, a Pressure of 1 bar, and a Mass Flow of 3952 kg/h. Inthe Compositionformentera Mole Fraction of 1 for propylene oxide.
  • 332.
    Dist-019H Revised:Nov8,2012 5 4.10. Addasecond Material Stream to the flowsheet. Thisstreamwill be the waterfeedstream. Change the name of thisstreamto WaterFeed. Enter a Temperature of 25°C, a Pressure of 1 bar, and a Mass Flow of 4990 kg/h. In the Compositionformentera Mole Fraction of 1 for water.
  • 333.
    Dist-019H Revised:Nov8,2012 6 4.11. AddaMixerto the flowsheetinordertomix the twofeedstreamstogether. 4.12. Double clickonthe mixer(MIX-100). Selectbothfeedstreamsas Inletstreamsand create an Outlet calledMixerOut. The mixershouldsolve.
  • 334.
    Dist-019H Revised:Nov8,2012 7 4.13. Wewill nowaddthe reactor to the flowsheet. Adda ContinuousStirredTank Reactor to the flowsheet fromthe Model Palette. 4.14. Double clickthe reactor(CSTR-100). Selectstream MixerOutas the Inlet,create a Vapour Outletcalled Reactor Vent,create a LiquidOutlet calledReactor Products,and create an Energy streamcalled Q- Cool.
  • 335.
    Dist-019H Revised:Nov8,2012 8 4.15. Inthe Parameters formentera reactor Volume of 8000 L anda LiquidVolume % of 85. 4.16. In the Reactions tab selectSet-1asthe Reaction Set.
  • 336.
    Dist-019H Revised:Nov8,2012 9 4.17. Sincewe addedan energystreamtothe reactor, we musteitherspecifythe dutyorthe outlet temperature. Inthe Worksheettabenteranoutlet Temperature of 60°C. The reactor shouldsolve.
  • 337.
    Dist-019H Revised:Nov8,2012 10 4.18. AddaDistillationColumnSub-Flowsheetfromthe Model Palette. 4.19. Double clickonthe column(T-100). This will launchthe DistillationColumnInputExpert. On the first page of the inputexpertenterthe followinginformation. Enter 10 for # Stages, selectReactor Products as the Inlet Stream onStage 5, create CondenserEnergyStream calledQ-Cond,an Ovhd LiquidOutlet streamRecycle,and a Bottoms Liquid OutletcalledProduct. Click Nextwhencomplete.
  • 338.
    Dist-019H Revised:Nov8,2012 11 4.20. OnPage 2 of the inputexpertleave the defaultselectionsfora Once-through,Regular Hysys reboiler. ClickNext. 4.21. On Page 3 of the inputexpertenterCondenserandReboilerPressures of 1 bar. Click Next.
  • 339.
    Dist-019H Revised:Nov8,2012 12 4.22. OnPage 4 of the inputexpertleave all fieldsblankfortemperature estimates. Click Next. OnPage 5 leave all fieldsblankandclick Done to configure the column. 4.23. The columnpropertywindowwill open. We mustdefine the desiredoperatingspecificationsof the column. Go to the Specs formunderthe Design tab. We will firstadda specificationtohave a mole fraction of 0.995 of propylene glycol inthe productstream. Click AddandselectColumnComponent Fraction. SelectStreamfor Target Type,Product for Draw, 12-C3diol for Component,andentera Spec Value of 0.995. 4.24. Go to the SpecsSummary form underthe Designtab. Enter a value of 1 forRefluxRatio. Make sure that the onlyactive specificationsare CompFraction andRefluxRatio. Once these are checkedas active the columnwill begintosolve.
  • 340.
    Dist-019H Revised:Nov8,2012 13 4.25. Checkresults.Go to the Compositionformunderthe Worksheettab. Here you will see thatthe productpurityspecificationhasbeenreached,andyoucan alsosee thatthe distillate streamcontains no propylene glycol.
  • 341.
    Dist-019H Revised:Nov8,2012 14 5. Conclusions Thissimulationmodelstheproductionof propylene glycol. A continuousstirredtankreactorwasusedto create a product streamcontainingroughly20%propylene glycol,andthenadistillationcolumnwasdesignedinorder to produce a product streamwitha purityof 99.5% propylene glycol. The columnalsorecoversall of the propylene glycolfedtothe column. 6. Copyright Copyright© 2012 by AspenTechnology,Inc.(“AspenTech”).All rightsreserved. Thisworkmaynot be reproducedordistributedinanyformor byany meanswithoutthe priorwrittenconsentof AspenTech. ASPENTECHMAKESNOWARRANTYOR REPRESENTATION,EITHER EXPRESSEDOR IMPLIED, WITH RESPECT TO THIS WORK and assumesnoliabilityforanyerrorsor omissions. Innoeventwill AspenTechbe liable toyoufordamages,includinganylossof profits,lostsavings,orotherincidental orconsequential damagesarisingoutof the use of the informationcontainedin,orthe digital filessuppliedwithorforuse with, thiswork. This workand itscontentsare providedforeducational purposesonly. AspenTech®,aspenONE®,andthe Aspenleaf logo,are trademarksof AspenTechnology,Inc.. Brandsand productnamesmentionedinthisdocumentationare trademarksorservice marksof theirrespective companies.
  • 342.
    Dist-020H Revised:Nov9,2012 1 Amine Scrubbingwith Aspen HYSYS® V8.0 1. Lesson Objectives  Use Aspen HYSYSto simulate aCO2 absorbercolumn 2. Prerequisites  Aspen HYSYS V8.0 3. Background In recenttimesthere hasbeenmuchinterestinthe recoveryof carbondioxidefromflue gasses. Recovering carbon dioxide will leadtolowergreenhousegasemissions,andthe capturedcarbondioxide canbe soldfor profit. Carbondioxide capture isalso gaininginterestfromenhancedoil capture processeswhere CO2 is injectedundergroundintooil wells,whichreducesthe viscosityandsurface tensionof the oil andleads to higheroil recoveryrates. Gas-liquidabsorption,alsoknownasgasstreamscrubbing, can be usedto remove CO2 from a flue gasstreamusingMEA (monoethanolamine) asasolvent. MEA acts as a weakbase and neutralizesacidiccompoundssuchasCO2. Thiswill cause CO2 to ionize intoHCO3 - whichwill preventCO2 from leavingthe solvent,resultinginagas stream largely free of carbondioxide. The examplespresentedare solelyintendedtoillustrate specificconceptsand principles. Theymay not reflectan industrial application or real situation.
  • 343.
    Dist-020H Revised:Nov9,2012 2 4. ProblemStatement and Aspen HYSYS Solution Problem Statement It isknownthat amine solventshave atheoretical loadingof 0.5 molesof CO2 for everymole of amine. Calculate the amountof MEA requiredtosuccessfullyremove the CO2 fromaflue gasstream containing10 mol%carbondioxide withatotal flowrate of 1,000 tons/day. Use AspenHYSYS to simulate thisprocessand confirmthe results. Assume anaqueoussolventstreamwithamassfractionof 0.25 MEA and a 20 stage absorbercolumn. Aspen HYSYS Solution 4.01. Create a newsimulationinAspenHYSYSV8.0. 4.02. Create a componentlist. Inthe ComponentLists folderselectAdd. Addwater, carbon dioxide, nitrogen, monoethanolamine,andoxygentothe componentlist. 4.03. Define propertymethods. Inthe FluidPackagesfolderselectAdd. Selectthe Amine Pkgas the propertypackage.
  • 344.
    Dist-020H Revised:Nov9,2012 3 4.04. Goto the simulationenvironmentbyclickingthe Simulationbuttoninthe bottomleftof the screen. 4.05. Adda material streamtothe flowsheet. Thiswill be the fluegasstream. Double clickthe streamand rename itFlue Gas. Entera Temperature of 65°C, a Pressure of 1.2 bar, and a Mass Flow of 1000 tonne/day (4.167E+004 kg/h). Inthe CompositionformenterMole Fractionsof 0.10 for CO2, 0.70 for Nitrogen, 0.15 for Water,and 0.05 for Oxygen. The streamshouldsolve. 4.06. By lookingatthe Flue Gas stream, we can see that itcontains~150 kgmole/hof carbondioxide. This meansthat we wouldneedaminimumof ~300 kgmole/hof MEA to remove all of the carbon dioxide. In our simulationwe will create afeedwithslightlymore MEA thanthe calculatedminimumtoensure
  • 345.
    Dist-020H Revised:Nov9,2012 4 successful removalof carbondioxide. Since oursolventfeedhasaMEA mass fractionof 0.25 thismeans that our solventstreamwill needatotal massflow of approximately 80,000 kg/h. 4.07. Adda secondmaterial streamtothe flowsheet. Thiswillbe the solventstream. Double clickthe stream and rename itSolvent. Entera Temperature of 25°C, a Pressure of 1 bar, and a Mass Flow of 80,000 kg/h. Inthe CompositionformenterMass Fractions of 0.25 for MEA and 0.75 forwater.The stream shouldsolve. 4.08. Addan Absorber ColumnSub-Flowsheetfromthe Model Palette.
  • 346.
    Dist-020H Revised:Nov9,2012 5 4.09. Doubleclickthe column(T-100). Thiswill openthe AbsorberColumnInput Expert. On the firstpage of the inputexpertselectstream Solventasthe Top Stage Inletand streamFlue Gas as the Bottom Stage Inlet. Create an Ovhd Vapour OutletcalledCleanAir and a Bottoms Liquid OutletcalledSolution. Enter 20 for# Stages. ClickNextwhencomplete.
  • 347.
    Dist-020H Revised:Nov9,2012 6 4.10. Onthe secondpage of the inputexpertenter aTop Stage Pressure of 1 bar anda Bottom Stage Pressure of 1.2 bar. ClickNextwhencomplete. 4.11. On the final page of the inputexpertenter Topand Bottom Stage Temperature estimatesof 50°C. This estimate doesnothave tobe extremelyaccurate,butwill helpthe solverconverge onasolution. Click Done to configure the column.
  • 348.
    Dist-020H Revised:Nov9,2012 7 4.12. Thecolumnpropertywindowwill now appear. Click Runto begincalculations. The absorbercolumn shouldconverge.
  • 349.
    Dist-020H Revised:Nov9,2012 8 4.13. Checkresults.Double clickonstream CleanAir. Go to the Compositionformunderthe Worksheettab. You will see thatthere isessentiallynocarbondioxide remaininginthe stream. 5. Conclusions Thissimulation hasconfirmedthe calculatedamountof MEA that is requiredtoremove carbondioxide fromthe flue gasstream. It was foundthata solventflow of 80,000 kg/hissufficienttoremove the carbondioxide from a 1000 tonne/dayflue gasstream. The cleanair streamcan now be releasedtothe atmosphere andthe capturedcarbon dioxide canbe removedfromthe solventandsoldorusedfor variousapplications. 6. Copyright Copyright© 2012 by AspenTechnology,Inc.(“AspenTech”).All rightsreserved. Thisworkmaynot be reproducedordistributedinanyformor byany meanswithoutthe priorwrittenconsentof AspenTech. ASPENTECHMAKESNOWARRANTYOR REPRESENTATION,EITHER EXPRESSEDOR IMPLIED, WITH RESPECT TO THIS WORK and assumesnoliabilityforanyerrorsor omissions. Innoeventwill AspenTechbe liable toyoufordamages,includinganylossof profits,lostsavings,orotherincidental or consequential
  • 350.
    Dist-020H Revised:Nov9,2012 9 damagesarisingoutof theuse of the informationcontainedin,orthe digital filessuppliedwithorforuse with, thiswork. This workand itscontentsare providedforeducational purposesonly. AspenTech®,aspenONE®,andthe Aspenleaf logo,are trademarksof AspenTechnology,Inc.. Brandsand productnamesmentionedinthisdocumentationare trademarksorservice marksof theirrespective companies.
  • 351.
  • 352.
    RX-003H Revised:Nov 6,2012 1 Isomerizationin a CSTR with Aspen HYSYS® V8.0 1. Lesson Objectives  Use componentmassbalancestocalculate the time requiredtoreacha desiredconversionina continuousstirredtankreactor.  Use Aspen HYSYSto confirmthe analytical solution 2. Prerequisites  Aspen HYSYS V8.0  Basic knowledgeof reactionrate laws andmassbalances 3. Background 2-Butene isa fourcarbon alkene thatexistsastwogeometricisomers: cis-2-buteneand trans-2-butene.The irreversible liquidphase isomerizationreactionwith1st orderreactionkineticsisshownbelow.Itisdesiredto determine the residence time requiredtoreach90% reactionconversioninacontinuousstirredtankreactor. Assume steadystate. Homogeneousreaction 1st orderreactionkinetics The examplespresentedare solelyintendedtoillustrate specificconceptsand principles. Theymay not reflectan industrial application or real situation.
  • 353.
    RX-003H Revised:Nov 6,2012 2 4.Solution Analytic Solution: Component A Mole Balance Conversion (Χ) Residence Time (τ) ∴ Aspen HYSYS Solution: 4.01. Start AspenHYSYS V8.0. SelectNewtocreate a new simulation. 4.02. Beginby creatinga ComponentList. In the propertiesnavigationpane,goto ComponentLists and selectAdd. Change the Search by criteriato Formula and searchfor C4H8. Selectcis2-Butene andtr2- Butene and add themto the componentlist.
  • 354.
    RX-003H Revised:Nov 6,2012 3 4.03.Adda FluidPackage. Goto FluidPackages in the navigationpane andselect Add.SelectNRTLas the propertypackage.
  • 355.
    RX-003H Revised:Nov 6,2012 4 4.04.Define reaction. Goto Reactionsin the navigationpane andclick Addto add a new reactionset. In Reaction Set 1, clickAdd Reaction and selectaHYSYS,Kineticreaction. 4.05. Double clickon Rxn-1 to define kineticreaction. Inthe KineticReaction: Rxn-1 window, Addcis2- Butene and tr2-Butene to the componentcolumn,andassign StoichCoeffsof -1 and1, respectively. In the Forward Reactionsection,setA to be .23000 and both E and B to 0.00000. Make sure that the Base Unitsand Rate Units are lbmole/ft3 andlbmole/ft3-min,respectively.
  • 356.
    RX-003H Revised:Nov 6,2012 5 4.06.Attach the reactiontoa fluidpackage. Inthe Set-1 (ReactionSet) form, click Add to FP andselectBasis- 1. 4.07. Move to the simulationenvironment byclickingthe Simulationbuttononthe bottomleftof the screen.
  • 357.
    RX-003H Revised:Nov 6,2012 6 4.08.Press F-12 to openthe UnitOpswindow. Selectthe Reactorsradiobuttonand add a Cont. Stirred Tank Reactor to the flowsheet. 4.09. Upon clickingAdd,the Cont. StirredTank Reactor: CSTR-100 window will appear. Enteran Inletstream calledFeed,aVapour Outletstream called VAP-Product,anda LiquidOutletstreamcalled LIQ-Product.
  • 358.
    RX-003H Revised:Nov 6,2012 7 4.10.Go to the Reactionstab and selectSet-1forReaction Set.
  • 359.
    RX-003H Revised:Nov 6,2012 8 4.11.Specify the feedstream. Goto the Worksheettab. For the Feedstreamentera Temperature of 25°C, a Pressure of 10 bar (1000 kPa),anda Molar Flowof 1 kgmole/h. 4.12. Go to the Compositionformandentera Mole Fraction of 1 forcis2-Butene.
  • 360.
    RX-003H Revised:Nov 6,2012 9 4.13.In the Design| Parameters form,entera volume of 0.005 m3 andspecifyaLiquid Volume of 100%. This isjust a randomvolume,we will soonaddanadjustblockto determinethe volume requiredtoachieve 90% reactionconversion. 4.14. Addan Adjust blockto the flowsheetfromthe Model Palette.
  • 361.
    RX-003H Revised:Nov 6,2012 10 4.15.Double clickthe adjustblock(ADJ-1). We wouldlike adjustthe reactorvolume inordertoachieve a reactionconversionof 90%. Forthe AdjustedVariable selectthe Tank Volume of CSTR-100. For the Targeted Variable selectAct.% Cvn. of CSTR-100. Enter a SpecifiedTargetValue of 90. 4.16. In the Parameters tab,change the MaximumIterations to 1000. Press Start to begincalculations. The blockshouldsolve.
  • 362.
    RX-003H Revised:Nov 6,2012 11 4.17.Create a spreadsheettocalculate the residence time. Adda Spreadsheettothe flowsheetfromthe Model Palette. 4.18. Double clickthe spreadsheet(SPRDSHT-1). Inthe Spreadsheettab,enterthe followingtextincells A1, A2, and A3.
  • 363.
    RX-003H Revised:Nov 6,2012 12 4.19.Rightclickon cell B1 andselectImport Variable. Selectthe Tank Volume of CSTR-100. Rightclickon cell B2 andselectImport Variable. Selectthe Actual Volume Flow of streamLIQ-Product. 4.20. In cell B3 enterthe followingformula: =(B1/B2)*60. Thiswill displaythe residence time inminutes. 4.21. The residence time is 39.13 minutes,identicaltothe analytical solution. 5. Conclusion Both the analytical solutionanddesignspecinAspen HYSYSproducedthe same requiredresidence time of 39.13 min. to achieve 90%reactionconversioninaCSTR. The residence time foraCSTR islongerthan fora
  • 364.
    RX-003H Revised:Nov 6,2012 13 batchreactor or PFRbecause of the back-mixing:productismixedinwiththe feed,slowingthe reaction. Using reactor modelsinAspenHYSYS will allow youto model complex reactionsystemsincludingparallel andseries reactionswhichleadtocoupledsystemsof ODEswhichwouldbe difficulttocalculate byhand. 6. Copyright Copyright© 2012 by AspenTechnology,Inc.(“AspenTech”).All rightsreserved. Thisworkmaynot be reproducedordistributedinanyformor byany meanswithoutthe priorwrittenconsentof AspenTech. ASPENTECHMAKESNOWARRANTYOR REPRESENTATION,EITHER EXPRESSEDOR IMPLIED, WITH RESPECT TO THIS WORK and assumesnoliabilityforanyerrorsor omissions. Innoeventwill AspenTechbe liable toyoufordamages,includinganylossof profits,lostsavings,orotherincidental orconsequential damagesarisingoutof the use of the informationcontainedin,orthe digital filessuppliedwithorforuse with, thiswork. This workand itscontentsare providedforeducational purposesonly. AspenTech®,aspenONE®,andthe Aspenleaf logo,are trademarksof AspenTechnology,Inc.. Brandsand productnamesmentionedinthisdocumentationare trademarksorservice marksof theirrespective companies.
  • 365.
    RX-004H Revised:Nov6,2012 1 Isomerization inCSTRs in Series with Aspen HYSYS® V8.0 1. Lesson Objectives  Use componentmassbalancestocalculate the reactionconversionachievedwithtwocontinuous stirredtankreactors inseries.  Use Aspen HYSYSto confirmthe analytical solution 2. Prerequisites  Aspen HYSYS V8.0  Basic knowledgeof reactionrate lawsandmassbalances 3. Background 2-Butene isa fourcarbon alkene thatexistsastwogeometricisomers: cis-2-buteneand trans-2-butene.The irreversible liquidphase isomerizationreactionwith1st orderreactionkineticsisshownbelow. Homogeneousreaction 1st orderreactionkinetics The examplespresentedare solelyintendedtoillustrate specificconceptsand principles. Theymay not reflectan industrial application or real situation. 4. Problem Statement and Solutions Problem #1 Determine the conversionachievedif twoCSTRsare usedinseries.EachCSTR has a residence time of 20min. Assume steadystate.
  • 366.
    RX-004H Revised:Nov6,2012 2 Analytic Solution: FirstReactor Component A Balance Second Reactor Component A Balance Conversion ( ) Aspen HYSYS Solution: 4.01. Start AspenHYSYS V8.0. Create a new simulation. 4.02. Create a componentlist. Inthe ComponentLists folderselectAdd.Change the Search by criteriato Formula and searchfor C4H8. Selectcis2-Butene andtr2-Butene and addthemto the componentlist.
  • 367.
    RX-004H Revised:Nov6,2012 3 4.03. Definepropertypackage. Inthe FluidPackagesfolderselectAdd. SelectNRTLas the propertypackage. 4.04. Define reaction. Inthe ReactionsfolderselectAddtocreate a new reactionset. In the newlycreated reactionsetselect AddReaction and selectKinetic.Close the Reactionswindow.
  • 368.
    RX-004H Revised:Nov6,2012 4 4.05. Rxn-1will be created. Double clickon Rxn-1to define the kineticreaction. Addcis2-Buteneandtr2- Butene to the componentcolumn,andassign StoichCoeffsof -1 and1, respectively.Inthe Forward Reaction section,setAto be .23000 and bothE and B to 0.00000. Make sure that the Base Units and Rate Units are lbmole/ft3and lbmole/ft3-min,respectively. 4.06. Attach reactiontoa fluidpackage. Click Addto FP andselectBasis-1. 4.07. Go to the simulationenvironment. Selectthe Simulationbuttoninthe bottomleftof the screen.
  • 369.
    RX-004H Revised:Nov6,2012 5 4.08. AddtwoCSTR blockstothe flowsheet. PressF12 to openthe UnitOpswindow. Selectthe Reactors radiobuttonand add 2 Cont.Stirred Tank Reactors to the flowsheet.
  • 370.
    RX-004H Revised:Nov6,2012 6 4.09. Doubleclickonthe firstreactor (CSTR-100). Create an Inletstreamcalled Feed,aVapour Outletcalled Vap1, and a Liquid OutletcalledLiq1. 4.10. In the Reactions tab selectSet-1forReaction Set.
  • 371.
    RX-004H Revised:Nov6,2012 7 4.11. Specifythe feedstream. Goto the Worksheettaband entera Temperature of 25°C, a Pressure of 10 bar, and a Molar Flowof 1 kgmole/h. 4.12. In the Compositionformunderthe Worksheettab,entera Mole Fraction of 1 for cis-2-butene inthe feedstream.
  • 372.
    RX-004H Revised:Nov6,2012 8 4.13. Inthe Design| Parameters form,entera Volume of 0.005 m3 and a Liquid Volume % of 100%. We will sooncreate an Adjustblockand a Spreadsheettofindthe volumerequiredforthe desiredresidence time of 20 minutes. 4.14. Adda Spreadsheettothe flowsheetfromthe Model Palette.
  • 373.
    RX-004H Revised:Nov6,2012 9 4.15. Doubleclickthe spreadsheet(SPRDSHT-1). Inthe Spreadsheettab enterthe followingtextincells A1, A2, and A3.
  • 374.
    RX-004H Revised:Nov6,2012 10 4.16. Rightclickoncell B1 andselectImport Variable. Selectthe Tank Volume of CSTR-100. Rightclickon cell B2 andselectImport Variable. Selectthe Actual Volume Flow of streamLiq1. Clickoncell B3 and enterthe following: =(B1/B2)*60. This will displaythe residence timeinminutesof CSTR-100. 4.17. We will nowcreate anadjustblockto vary the tank volume of CSTR-100 to achieve aresidence time of 20 minutes. Addan Adjust blockto the flowsheetfromthe Model Palette.
  • 375.
    RX-004H Revised:Nov6,2012 11 4.18. Doubleclick onthe adjustblock(ADJ-1). Specifythe AdjustedVariable tobe the Tank Volume of CSTR- 100. Specifythe TargetVariable to be cell B3 of SPRDSHT-1. Entera Target Value of 20.
  • 376.
    RX-004H Revised:Nov6,2012 12 4.19. Inthe Parameters tab,change the MaximumIterations to 1000. Click Start to begincalculations. The blockshouldsolve. 4.20. The firstCSTR is nowfullyspecifiedandhasresidence time of 20minutes. Note thatthe vapor outlet streamhas a flowrate of zero.
  • 377.
    RX-004H Revised:Nov6,2012 13 4.21. Doubleclickthe secondreactor(CSTR-101). SelectLiq1 as the Inletstream andcreate Outlet streams calledVap2 and Liq2.
  • 378.
    RX-004H Revised:Nov6,2012 14 4.22. Inthe Reactions tab selectSet-1asthe Reaction Set.
  • 379.
    RX-004H Revised:Nov6,2012 15 4.23. Repeatsteps4.13to 4.20 for the secondreactor. Whenfinishedthe secondreactorshouldsolveand have a residence time of 20 minutes. 4.24. Checkthe resultsof streamLiq2. Double clickstream Liq2 and go to the Compositionformunderthe Worksheettab.
  • 380.
    RX-004H Revised:Nov6,2012 16 4.25. Youcan see that the mole fractionof trans-2-butene inthe outletstreamis 0.9681. You can add the reactionextentsof eachreactiontoachieve the total reactionconversion. Tofindthe reactionextent, double clickareactor and go to the Reactions | Resultspage. In thiscase the reactionextentof the first CSTR is0.8214 and 0.1467 for the secondCSTR. Thistotalsto 0.9681, identical tothe analyticsolution.
  • 381.
    RX-004H Revised:Nov6,2012 17 Problem #2 Considerthesame 1st orderreaction, exceptthistime usingtwo CSTRsof differentsizes.Calculatethe conversionachievedif the firstreactorhasa residence time of 30 min and the secondreactorhas a residence time of 10 min.Assume steadystate. Analytic Solution: First Reactor Component A Balance Second Reactor Component A Balance Conversion ( )( ) Aspen HYSYS Solution: 4.26. The same procedure describedinthe case of two equal volume CSTRsinseriesshouldbe followed.The onlydifference beingthe firstCSTRhasa residence timeof 30 min and the secondCSTR hasa residence time of 10 min.
  • 382.
    RX-004H Revised:Nov6,2012 18 4.27. Openthefile youcreatedforthe previousproblem. Inthe Adjustblockschange the Target Value to 30 for the firstreactor and 10 forthe secondreactor.
  • 383.
    RX-004H Revised:Nov6,2012 19 4.28. Checkresults.Addupthe reactionextentforbothreactors. The firstreactor hasa reactionextentof 0.8734, and the secondreactor hasan extentof 0.08822. Thistotalsto 0.9616, whichisidentical tothe analyticsolution. 5. Conclusion The conversionisslightlyhigherwhenthe residence timesare the same. Whenbothare 20 min.,the conversion is96.81%, and it isonly 96.16% whentheyare 30 and10 min.respectively. Thisisaresultof the decreasing dependence of conversiononresidence time:the secondderivativeof conversionwithrespecttoresidence time isnegative. Total residence timeisnotsufficienttodescribe aseriessystemof CSTRs. Multiple CSTRsinseriesyieldhigher conversionthana single CSTRthathas a residence time equaltothe sumof the seriesarrangement. 6. Copyright Copyright© 2012 by AspenTechnology,Inc.(“AspenTech”).All rightsreserved. Thisworkmaynot be reproducedordistributedinanyformor byany meanswithoutthe priorwrittenconsentof AspenTech. ASPENTECHMAKESNOWARRANTYOR REPRESENTATION,EITHER EXPRESSEDOR IMPLIED, WITH RESPECT TO THIS WORK and assumesnoliabilityforanyerrorsor omissions. Innoeventwill AspenTechbe liable toyoufordamages,includinganylossof profits,lostsavings,orotherincidental orconsequential damagesarisingoutof the use of the informationcontainedin,orthe digital filessuppliedwithorforuse with, thiswork. This workand itscontentsare providedforeducational purposesonly. AspenTech®,aspenONE®,andthe Aspenleaf logo,are trademarksof AspenTechnology,Inc.. Brandsand productnamesmentionedinthisdocumentationare trademarksorservice marksof theirrespective companies.
  • 384.
    RX-005H Revised:Oct15, 2012 1 Esterificationin CSTRs in Series with Aspen HYSYS® V8.0 1. Lesson Objectives  Use Aspen HYSYSto determine whetheragivenreactionistechnicallyfeasibleusingthree continuousstirredtankreactorsinseries. 2. Prerequisites  Aspen HYSYS V8.0  Basic knowledgeof reactionrate laws 3. Background Considerthe reversibleliquidphase esterificationof aceticacidshownbelow. The examplespresentedare solelyintendedtoillustrate specificconceptsand principles. Theymay not reflectan industrial application or real situation.
  • 385.
    RX-005H Revised:Oct15, 2012 2 4.Problem Statement and Aspen HYSYS Solution It isdesiredtoproduce 375 kg/h of ethyl acetate productfroma feedstreamconsistingof 13 mole % acetic acid, 35 mole %ethanol,and52 mole %water.This feedstreamisavailableat100,000 kg/day.Three 2,600 L CSTRs are available touse forthisprocess.Determineif itispossibletoachieve the desiredproductionrate of ethyl acetate by operatingthese three reactorsinseries. 4.01. Start AspenHYSYS V8.0. Create a new simulation. 4.02. Create a componentlist. Inthe ComponentLists folderselectAdd. AddAcetic-Acid,Ethanol,Ethyl- Acetate,and Water tothe componentlist. 4.03. Define propertypackage. Inthe FluidPackagesfolderselectAdd.SelectNRTLas the propertypackage. 4.04. Define reaction. Inthe ReactionsfolderselectAddtocreate a new reactionset. In Set-1 selectAdd Reaction and selectKinetic.
  • 386.
    RX-005H Revised:Oct15, 2012 3 4.05.Double click Rxn-1to define the kineticreaction. Enterthe followinginformationandclose the window whencomplete. Be sure to specifythe RxnPhase as AqueousPhase. 4.06. Attach reactiontofluidpackage. Click Addto FP and selectBasis-1.
  • 387.
    RX-005H Revised:Oct15, 2012 4 4.07.Go to the simulationenvironmentbyclickingthe Simulationbuttoninthe bottomleftcornerof the screen. 4.08. Place three CSTRblocksonto the flowsheet. Press F12to openthe UnitOpswindow. Selectthe Reactors radio buttonandadd three ContinuousStirredTank Reactors to the flowsheet.
  • 388.
    RX-005H Revised:Oct15, 2012 5 4.09.Double clickonthe firstreactor (CSTR-100). Create an Inletstreamcalled FeedandOutletstreams calledVap1 and Liq1.
  • 389.
    RX-005H Revised:Oct15, 2012 6 4.10.In the Parameters formunderthe Designtab entera Volume of 2.6 m3 (2600L), and entera Liquid Volume % of 100%.
  • 390.
    RX-005H Revised:Oct15, 2012 7 4.11.In the Reactions tab selectSet-1forReaction Set. 4.12. In the Worksheettab,for the Feedstream, enteraTemperature of 25°C, a Pressure of 1 bar, anda Mass Flow of 100,000 kg/day.
  • 391.
    RX-005H Revised:Oct15, 2012 8 4.13.In the CompositionformenterMole Fractions of 0.13 forAcetic Acid, 0.35 for Ethanol,0 for Ethyl Acetate,and 0.52 forwater. Whencomplete,the reactorshouldsolve. Youshouldnote thatthe vapor outlethasa mass flowof zerobecause the entire contentsof the reactorare liquid. 4.14. Double clickthe secondreactor(CSTR-101). SelectLiq1 as the Inletstream. Create Outletstreams calledVap2 and Liq2.
  • 392.
    RX-005H Revised:Oct15, 2012 9 4.15.In the Parameters tab entera Volume of 2.6 m3 and a LiquidVolume % of 100%. 4.16. In the Reactions tab,selectSet-1as the Reaction Set. The reactor shouldsolve.
  • 393.
    RX-005H Revised:Oct15, 2012 10 4.17.Double clickthe thirdreactor(CSTR-102). SelectLiq2as the Inletstream, andcreate Outletscalled Vap3 andLiq3. 4.18. In the Parameters formentera Volume of 2.6 m3 and a Liquid Volume % of 100%.
  • 394.
    RX-005H Revised:Oct15, 2012 11 4.19.In the Reactions tab selectSet-1asthe Reaction Set. The reactorshouldsolve. 4.20. The flowsheetisnowcomplete. 4.21. To check resultsrightclickonstream Liq3 andselectShowTable. A table will appearonthe flowsheet showingTemperature,Pressure,andMolarFlow. Double clickonthe table andselect AddVariable.
  • 395.
    RX-005H Revised:Oct15, 2012 12 4.22.Selectthe MasterComp Mass Flow andselectE-Acetate. Click OK. The componentmassflowof ethyl acetate will be addedtothe table. 4.23. The mass flowof ethyl acetate inthe final liquidstreamis 672.55 kg/h, whichisgreaterthan the desired flowrate specifiedinthe problemstatement. Thisshowsthatthisreactor setupiscapable of producing the desiredrate of product.
  • 396.
    RX-005H Revised:Oct15, 2012 13 5.Conclusion The CSTRs can be usedinseriestomake the target amountof product.Aspen HYSYS can be usedtomodel existingequipmentinadditiontodesigningnew equipment. Modelingexistingequipmentletsengineersdecide if theycan repurpose equipmentandimproveperformance bychangingstate variables. 6. Copyright Copyright© 2012 by AspenTechnology,Inc.(“AspenTech”).All rightsreserved. Thisworkmaynot be reproducedordistributedinanyformor byany meanswithoutthe priorwrittenconsentof AspenTech. ASPENTECHMAKESNOWARRANTYOR REPRESENTATION,EITHER EXPRESSEDOR IMPLIED, WITH RESPECT TO THIS WORK and assumesnoliabilityforanyerrorsor omissions. Innoeventwill AspenTechbe liable toyoufordamages,includinganylossof profits,lostsavings,orotherincidental orconsequential damagesarisingoutof the use of the informationcontainedin,orthe digital filessuppliedwithorforuse with, thiswork. This workand itscontentsare providedforeducational purposesonly. AspenTech®,aspenONE®,andthe Aspenleaf logo,are trademarksof AspenTechnology,Inc.. Brandsand productnamesmentionedinthisdocumentationare trademarksorservice marksof theirrespective companies.
  • 397.
    RX-006H Revised:Nov6,2012 1 Isomerization ina PFR with Aspen HYSYS® V8.0 1. Lesson Objectives  Use chemical reactionkineticstocalculate the reactorlength requiredtoreacha desiredconversion ina plugflowreactor 2. Prerequisites  Aspen HYSYS V8.0  Basic knowledgeof reactionrate lawsandplugflow reactors 3. Background/Problem 2-Butene isa fourcarbon alkene thatexistsastwogeometricisomers: cis-2-buteneand trans-2-butene.The irreversible isomerizationreactionwith1st orderreactionkineticsisshownbelow. Homogeneousreaction 1st orderreactionkinetics The examplespresentedare solelyintendedtoillustrate specificconceptsand principles. Theymay not reflectan industrial application or real situation. 4. Problem Statement and Aspen HYSYS Solution Calculate the reactorlengthrequiredtoachieve 90% reactorconversion.Assumesteadystate operation, a single tube reactorwitha diameterof 2 inches,anda feedstreamof 100% cis-2-butune withaflow rate 1 kgmole/hat10 bar and 25°C. Aspen HYSYS Solution: 4.01. Start AspenHYSYS V8.0. Create a new simulation. 4.02. Create a componentlist. Inthe ComponentLists folderselectAdd. Change the Search by criteriato Formula and searchfor C4H8. Selectcis2-Butene andtr2-Butene and addthemto the componentlist.
  • 398.
    RX-006H Revised:Nov6,2012 2 4.03. Definepropertypackage. Inthe FluidPackagesfolderselectAdd. SelectNRTLas the propertypackage. 4.04. Define reaction. Inthe ReactionsfolderselectAddtocreate a new reactionset. In Set-1 selectAdd Reaction and click Kinetic. 4.05. Double click Rxn-1to define the kineticreaction. Addcis2-Butene andtr2-Butene tothe component column,andassign Stoich Coeffsof -1 and 1, respectively. Inthe Forward Reactionsection,setA to be .23000 and both E and B to 0.00000. Make sure that the Base Unitsand Rate Units are lbmole/ft3and lbmole/ft3-min,respectively.
  • 399.
    RX-006H Revised:Nov6,2012 3 4.06. Attachreactiontofluidpackage. Clickthe Addto PFbutton andselect Basis-1. 4.07. Go to the simulationenvironmentbyclickingthe Simulationbuttoninthe bottomleftof the screen.
  • 400.
    RX-006H Revised:Nov6,2012 4 4.08. Addaplugflowreactorto the flowsheet. Press F12to openthe UnitOpswindow. Selectthe Reactors radiobuttonand add a Plug FlowReactor to the flowsheet. 4.09. Double clickthe reactor(PFR-100). Create an Inletstreamcalled Feedandan Outletstream called Product.
  • 401.
    RX-006H Revised:Nov6,2012 5 4.10. Inthe Reactions tab selectSet-1forReaction Set.
  • 402.
    RX-006H Revised:Nov6,2012 6 4.11. Inthe Rating tab entera Length of 1 m anda Diameterof 2 in (5.080e-002 m). Thistube lengthisan initial guess;anadjustblockwill be usedtodetermine the lengthrequiredtoreachthe desiredreactor conversion. 4.12. In the Parameters formunderthe Designtab entera Delta P of 0.
  • 403.
    RX-006H Revised:Nov6,2012 7 4.13. Specifythe feedStream. Goto the Worksheettaband entera Temperature of 25°C, a Pressure of 10 bar, and a Molar Flowof 1 kgmole/h. 4.14. In the Compositionformentera Mole Fraction of 1 for cis-2-butene. Whencomplete the reactor shouldsolve. 4.15. Use an adjustblock to determinethe lengthrequiredtoachieve90% conversion. AddanAdjust blockto the flowsheetfromthe Model Palette.
  • 404.
    RX-006H Revised:Nov6,2012 8 4.16. Doubleclickthe adjustblock(ADJ-1). Specifythe AdjustedVariable tobe the Tube Length of PFR-100. Specifythe TargetVariable to be the Act. % Cnv.of PFR-100. Entera Target Value of 90.
  • 405.
    RX-006H Revised:Nov6,2012 9 4.17. Inthe Parameters tab,change the StepSize to 0.1 m andchange the MaximumIterations to 1000. ClickStart to begincalculations,the blockshouldsolve afterseveral iterations..
  • 406.
    RX-006H Revised:Nov6,2012 10 4.18. Toviewthe reactorlength,double clickthe reactorandgo to the Rating tab. Here youwill see thatthe requiredreactorlengthis 8.348 meters. 5. Conclusion AspenHYSYS can be usedto calculate the requiredreactorlengthtoachieve adesiredreactionconversionina plugflowreactor. The requiredreactorlengthwasdeterminedtobe 8.348 metersinorderto achieve 90% reactor conversion. Thissame strategy canbe appliedformuchmore complex reactionsandmulti-tube reactors,whichwouldbe muchmore difficulttoattempttosolve usinghandcalculations. 6. Copyright Copyright© 2012 by AspenTechnology,Inc.(“AspenTech”).All rightsreserved. Thiswork maynot be reproducedordistributedinanyformor byany meanswithoutthe priorwrittenconsentof AspenTech. ASPENTECHMAKESNOWARRANTYOR REPRESENTATION,EITHER EXPRESSEDOR IMPLIED, WITH RESPECT TO THIS WORK and assumesnoliabilityforanyerrors or omissions. Innoeventwill AspenTechbe liable toyoufordamages,includinganylossof profits,lostsavings,orotherincidental orconsequential damagesarisingoutof the use of the informationcontainedin,orthe digital filessuppliedwithor foruse with, thiswork. This workand itscontentsare providedforeducational purposesonly.
  • 407.
    RX-006H Revised:Nov6,2012 11 AspenTech®,aspenONE®,andthe Aspenleaflogo,are trademarksof AspenTechnology,Inc.. Brandsand productnamesmentionedinthisdocumentationare trademarksorservice marksof theirrespective companies.
  • 408.
    RX-007H Revised:Nov5,2012 1 Esterification ina PFR with Aspen HYSYS® V8.0 1. Lesson Objectives  Use Aspen HYSYSto determine whetheragivenreactionistechnicallyfeasibleusingaplugflow reactor. 2. Prerequisites  AspenHYSYS V8.0  Basic knowledgeof reactionrate laws 3. Background Considerthe reversibleliquidphase esterificationof aceticacidshownbelow. The examplespresentedare solelyintendedtoillustrate specificconceptsand principles. Theymay not reflectan industrial application or real situation. 4. Problem Statement and Aspen HYSYS Solution It isdesiredtoproduce 375 kg/h of ethyl acetate productfroma feedstreamconsistingof 13 mole % acetic acid, 35 mole %ethanol,and52 mole %water.This feedstreamisavailableat100,000 kg/day.A single tube plug flowreactorwitha lengthof 10 metersanda diameterof 1 m isavailable foruse inan existingchemical plant. Determine if itisfeasible toachieve the desiredproductusingthisreactor.
  • 409.
    RX-007H Revised:Nov5,2012 2 Aspen HYSYSSolution: 4.01. Start a newcase in AspenHYSYS V8.0. 4.02. Create a componentlist. Inthe ComponentLists folderselectAdd. Addaceticacid, ethanol,ethyl acetate,andwater to the componentlist. 4.03. Define the propertypackage. Inthe FluidPackagesfolderselectAdd. SelectNRTLas the property package. 4.04. Define reaction. Inthe ReactionsfolderselectAddtoadd a new Reaction Set. In Set-1 clickAdd Reaction and selectKinetictoadda new kineticreaction.
  • 410.
    RX-007H Revised:Nov5,2012 3 4.05. Doubleclick Rxn-1to define the kineticreaction. Enterthe followinginformationandclose the window whencomplete. Be sure to select AqueousPhase as the Rxn Phase. 4.06. Attach reactionsetto fluidpackage. Clickthe Addto FP buttonand select Basis-1. 4.07. Create the flowsheet. Enterthe simulationenvironmentbyclickingthe Simulationbuttoninthe bottom leftof the screen.
  • 411.
    RX-007H Revised:Nov5,2012 4 4.08. Placea Plug FlowReactor blockontothe flowsheetfromthe Model Palette. 4.09. Double clickthe reactor(PFR-100). Create an Inletstreamcalled Feedandan Outletstream called Product.
  • 412.
    RX-007H Revised:Nov5,2012 5 4.10. Inthe Reactions tab selectSet-1asthe Reaction Set.
  • 413.
    RX-007H Revised:Nov5,2012 6 4.11. Inthe Rating tab, specifyaLength of 10 meters anda Diameterof 1 meter. 4.12. In the Parameters formunderthe Designtab, entera Delta P of 0.
  • 414.
    RX-007H Revised:Nov5,2012 7 4.13. Wemustnowdefine the Feedstream. Goto the Worksheettab. For the Feedstream, entera Temperature of 25°C, a Pressure of 1 bar, and a Mass flow of 100,000 kg/day (4167 kg/h). 4.14. In the CompositionformenterMole Fractions of 0.13 foracetic acid, 0.35 for ethanol, 0 forethyl acetate,and 0.52 for water. The feedstreamshouldnow be fullydefinedandthe reactorshouldsolve.
  • 415.
    RX-007H Revised:Nov5,2012 8 4.15. Checkresults.Rightclickonthe Product streamand selectShowTable. A table will appearonthe flowsheet. Double clickthe table andselect AddVariable. 4.16. Selectthe MasterComp Mass Flow andselectcomponent E-Acetate.
  • 416.
    RX-007H Revised:Nov5,2012 9 4.17. Themass flowrate of ethyl acetate will now be addedtothe table. 4.18. The mass flowrate of ethyl acetate inthe productstreamis 453.4 kg/h. 5. Conclusion The use of the 10 meterreactorand providedfeedstocktoproduce 375 kg/h isfeasible.Aspen HYSYScanbe usedto model existingequipmentinadditiontodesigningnew equipment. Modelingexistingequipmentlets engineersdecide if theycanrepurpose equipmentand improve performance bychangingstate variables. 6. Copyright Copyright© 2012 by AspenTechnology,Inc.(“AspenTech”).All rightsreserved. Thisworkmaynot be reproducedordistributedinanyformor byany meanswithoutthe priorwrittenconsentof AspenTech. ASPENTECHMAKESNOWARRANTYOR REPRESENTATION,EITHER EXPRESSEDOR IMPLIED, WITH RESPECT TO THIS WORK and assumesnoliabilityforanyerrorsor omissions. Innoeventwill AspenTechbe liable toyoufordamages,includinganylossof profits,lostsavings,orotherincidental orconsequential damagesarisingoutof the use of the informationcontainedin,orthe digital filessuppliedwithorforuse with, thiswork. This workand itscontentsare providedforeducational purposesonly. AspenTech®,aspenONE®,andthe Aspenleaf logo,are trademarksof AspenTechnology,Inc.. Brandsand productnamesmentionedinthisdocumentationare trademarksorservice marksof theirrespective companies.
  • 417.
    RX-008H Revised:Nov6,2012 1 Simple CombustionReactor with Aspen HYSYS® V8.0 1. Lesson Objectives  Use conversionreactorblock  Determine airflowrate neededforacleanburn  Determine heatavailablefromafuel stream 2. Prerequisites  Aspen HYSYS V8.0  Understandingof enthalpyof combustion 3. Background Natural gas, whichisprimarilymethane,isdistributedinundergroundpipes. The pressure inthese pipesvaries dependingonwhere inthe pipe itis:the closertothe pumpingstation,the higherthe pressure. Anindustrial customercan expecttoget natural gas at around60 psig,andis typically chargedpercubicfootof natural gas used. Methane burnsinthe followingreaction: CH4 + 2 O2  CO2 + 2 H2O The examplespresentedare solelyintendedtoillustrate specificconceptsand principles. Theymay not reflectan industrial application or real situation. 4. Problem Statement and Aspen HYSYS Solution Problem Determine howmuchenergyisavailable froma5 ft3 /h(0.472 kg/h) fuel streamthatconsistsof onlymethane at 60 psig. The air feedshouldbe approximatedwith80mol-% nitrogenand20 mol-% oxygen. There shouldbe 10% excessoxygeninthe airstreamsothe fuel-airmixtureisnottoorich. Assume the exhaustis182 °C. Report the air flowrate in mol/handft3 /h(at1 atm) inadditiontothe available heat inkW. Mole Balance Two molesof oxygenare requiredtocombusteachmole of methane. Oxygenisone fifthof the molesinair. Therefore there will needtobe tenmolesof air foreach mole of methane fora stoichiometricmixture. A 10% excessrequiresa10% increase inthe relative amountof air,or11 molesof air foreach mole of methane.
  • 418.
    RX-008H Revised:Nov6,2012 2 Aspen HYSYSSolution 4.01. Start AspenHYSYS V8.0. SelectNewtocreate a new simulation. 4.02. Create a componentlist. Inthe navigation pane find ComponentListsandselectAddto create a new HYSYS componentlist. Add Oxygen,Nitrogen, Methane,CarbonDioxide,andWaterto the component list. 4.03. Adda fluidpackage. Goto FluidPackages and selectAdd. SelectPeng-Robinsonasthe property package. 4.04. Define reaction. Goto Reactionsand click Newto create a new reactionset. Inthe formfor the newly createdreactionset,click Add Reactionand selectHysys,Conversion.
  • 419.
    RX-008H Revised:Nov6,2012 3 4.05. Doubleclick Rxn-1to openthe ConversionReaction: Rnx-1 window. Enterthe followinginformation. Notice thatthe Reaction Heat isautomaticallycalculatedtobe -8.0e+05 kJ/kgmole. 4.06. Attach reactiontofluidpackage. Inthe Reaction Set 1 form, clickthe Add to FP button. SelectBasis-1.
  • 420.
    RX-008H Revised:Nov6,2012 4 4.07. Atthispoint,youare readyto move to the simulationenvironment. Todo so,clickthe Simulation buttonat the bottomleftof the screen. 4.08. On the mainflowsheetcreate amaterial streamusingthe Model Palette.Selectthe iconformaterial streamand place itonto the flowsheet.
  • 421.
    RX-008H Revised:Nov6,2012 5 4.09. Doubleclickthe streamto openthe streampropertywindow.Change the streamname to Methane, and entera Temperature of 25°C, a Pressure of 515 kPa, anda Mass Flowof 0.472 kg/h. 4.10. Go to the Compositionformandentera Mole Fraction of 1 forMethane. You will notice thatafter enteringthe streamcomposition,the statusbarwill turngreenandsay OK. This indicatesthatstreamis fullydefinedandsolvedforall parameters.
  • 422.
    RX-008H Revised:Nov6,2012 6 4.11. Createa secondmaterial streamtobe the air streamthat isrequiredforcombustion.Double clickon the new material streamandenterthe followinginformation. Boldblue fontindicatesauser-entered value. Fromthe solved Methane stream, we know there are 0.02942 kgmole/hr of Methane. We wouldlike there tobe 11 molesof airfor eachmole of methane,therefore we willenteramolar flowrate of 0.324 kgmole/hr forthe air stream. Entera Mole Fraction of 0.2 for Oxygenand mole fractionof 0.8 forNitrogen. The streamshouldthensolve.
  • 423.
    RX-008H Revised:Nov6,2012 7 4.12. Theflowsheetshouldnowlooklikethe following.
  • 424.
    RX-008H Revised:Nov6,2012 8 4.13. Wewill nowplace avalve inorderto reduce the pressure of the methane streamtoambientpressure. SelectaControl Valve from the Model Palette and place itontothe flowsheet. 4.14. Double clickthe valve toopenthe valve propertywindow. Inthe Connectionspage selectMethane as the Inletstream andcreate an OutletcalledMethane-LP.
  • 425.
    RX-008H Revised:Nov6,2012 9 4.15. Specifyvalveoutletpressure. Goto the Worksheettaband entera Pressure of 101.3 kPa forthe Methane-LPstream. The valve shouldsolve.
  • 426.
    RX-008H Revised:Nov6,2012 10 4.16. Insertreactor.PressF12 to openthe UnitOpswindow.Selectthe Reactorsradiobuttonand add a ConversionReactor to the flowsheet. 4.17. In the ConversionReactor propertywindow selectstreams AirandMethane-LPas Inletstreams. Create a Vapour Outlet streamcalled VAP-Outanda LiquidOutlet calledLIQ-Out.
  • 427.
    RX-008H Revised:Nov6,2012 11 4.18. Goto the Reactionstab. SelectSet-1for ReactionSet. The reactor shouldsolve andthe statusshould turn greenandsay OK.
  • 428.
    RX-008H Revised:Nov6,2012 12 4.19. Theflowsheetshouldnowlooklikethe following. 4.20. To check resultsgoto Worksheettabof the ConversionReactor. You can see that the streamVAP-Out isleavingthe reactorat an extremelyhightemperature. Thisisdue tothe highheatof reaction. To calculate exactlyhowmuchenergyisreleasedfromthisreactionsimplytake the heatof reactionfound inthe Reactionstab and multiplyitbythe methane molarflowrate. Inthiscase,burning5 ft3 /hof methane releases 6.5kW.
  • 429.
    RX-008H Revised:Nov6,2012 13 5. Conclusions 5ft3 /hof methane produces6.5 kW of heat. To runa quality,leanmixture there mustbe 280 ft3 /hof air (that is 20 mol-%oxygen) whichis0.324 kgmole/h. The conversionreactorblockisuseful forquicksimulationswith well understoodreactions. Reactions withslow kinetics,orcomplex systemswithseriesorparallelreactionsare outside the scope of thisreactormodel. Thissimulationcouldalsobe createdusingaGibbsreactor block. The Gibbsreactor isunique inthat itcan functionwithoutadefinedreactionset. Thisreactorblockwill minimizethe Gibbsfree energyof the reacting systemtocalculate the productcomposition. Thisreactorblockisuseful whenthe exactreactionsorkinetics are unknown,andthe reactionreachesequilibriumveryquickly. Itmaybe a useful exercise torepeatthis module usingaGibbsreactor and compare results. 6. Copyright Copyright© 2012 by AspenTechnology,Inc.(“AspenTech”).All rightsreserved. Thisworkmaynot be reproducedordistributedinanyformor by any meanswithoutthe priorwrittenconsentof AspenTech. ASPENTECHMAKESNOWARRANTYOR REPRESENTATION,EITHER EXPRESSEDOR IMPLIED, WITH RESPECT TO THIS WORK and assumesnoliabilityforanyerrorsor omissions. Innoeventwill AspenTechbe liable toyoufordamages,includinganylossof profits,lostsavings,orotherincidental orconsequential damagesarisingoutof the use of the informationcontainedin,orthe digital filessuppliedwithorforuse with, thiswork. This workand itscontentsare providedforeducational purposesonly. AspenTech®,aspenONE®,andthe Aspenleaf logo,are trademarksof AspenTechnology,Inc.. Brandsand productnamesmentionedinthisdocumentationare trademarksorservice marksof theirrespective companies.
  • 430.
  • 431.
    Dyn-001H Revised:Nov 13,2012 1 DynamicAnalysis of a CSTR with Aspen HYSYS® V8.0 1. Lesson Objective:  Understand the basicworkflowtocreate and runa dynamicsimulationusingAspen HYSYSDynamics  Setup a simple dynamicsimulation of aCSTR  Observe the effectof perturbationsthrough changesinthe controllersettings 2. Prerequisites  Aspen HYSYS V8.0  File Dyn-001_CSTR_Start.hsc  Basic knowledgeof controllers 3. Background Dynamic Simulation in Chemical Engineering Dynamic simulation is an extension of steady-state process simulation whereby time-dependence is built into the models via derivative terms i.e. accumulation of mass and energy. The advent of dynamic simulation means that the time-dependent description and control of real processes in real or simulated time are possible. This includes the description of starting up and shutting down a plant, changes of conditions during a reaction, holdups, thermal changes and more. Dynamic simulations require increased calculation time and are mathematically more complex than steady-state simulations. They can be seen as repeatedly calculated steady- state simulations (based on a fixed time step) with constantly changing parameters. Dynamic simulation can be used in both an online and offline fashion. The online case being model predictive control, where the real-time simulation results are used to predict the changes that would occur for a control input change, and the control parameters are optimized based on the results. Offline process simulation can be used in the design, troubleshooting and optimization of process plant as well as the conduction of case studies to assess the impactsof processmodifications. 4. Problem Statement and Aspen HYSYS Solution Problem: Use the provided Aspen HYSYS file Dyn_001_CSTR_Start.hsc, prepare a dynamic simulation flowsheet and performthe followingstudiestoinvestigatehow the reactorsystembehavesdynamically when:  Manipulate the level controllersetpoint  Varythe reactorfeedflowrate
  • 432.
    Dyn-001H Revised:Nov 13,2012 2 AspenHYSYS Solution: 4.01. Start AspenHYSYS V8.0. OpenDyn_001H_CSTR_Start.hsc 4.02. Observe the flowsheet.Thisscenariosimulatesthe productionof propylene glycol fromwaterand propylene oxide.The controllers FIC-100,TIC-100, and LIC-100, control the feedflow,reactor temperature,andreactorliquidlevel,respectively.Clickonthe Dynamics tab inthe Ribbon. Notice that the simulationisalreadyin DynamicsMode. 4.03. Press SHIFT + P. Thiswill displaythe pressuresof all the streams. Notice thatinputandoutputstreams (PreFeed, ReactorVent,PRODUCT) have stars nextto theirvalues. Thisindicatesthatthere isa pressure specificationonthe streams. These specificationsare neededforthe dynamicsimulationtobe Pressure Driven,as the dynamicflowratesare determinedbypressure drops. The specificationscanbe observedbydouble clickingonastreamand goingto the Dynamics tab. ClickSHIFT + N to displaythe streamnames.
  • 433.
    Dyn-001H Revised:Nov 13,2012 3 (FAQ)Types of DynamicSimulations  Flowdriven  Feedflowrate andpressuresare specified  Flowrate isnotcontrolledbypressure differences  Useful fora firstapproach of the dynamicbehaviorof the process  Good forliquidprocesses(usuallygoodflow controllability)  Pressure driven  Feedandproduct pressuresare specified  Flowrate resultsfrompressure difference  A bitmore complex tospecify(because youneedtobalance the pressuresinAspen HYSYS withvalves,pumps,...) butmore rigorous 4.04. The PRODUCT stream will be observed to determine the effects on the changing system. Double click on the PRODUCT, and go to the Dynamics | Stripchart page. In the Variable Set dropdown menu, select T, P, and F. ClickCreate Stripchart. This will create anew stripchartcalled PRODUCT-DL1.
  • 434.
    Dyn-001H Revised:Nov 13,2012 4 4.05.We will runfollowingscenario toinvestigate the reactordynamics:  Run the dynamicsimulationfor2hours (Note:thisis insimulationtime,notin real time)  Change the Level Controller(LIC-100) setpointto 60%  Run the dynamic simulation for 3 additional hours; find how the product stream results are beingaffected 4.06. In the NavigationPane, clickon the Strip Charts folderandpressthe Display button. 4.07. Right click on the chart and select Graph Control. In the Axes tab check Automatic Auto Scale in the Auto Scale sectionand Show All in the AxisDisplay section.
  • 435.
    Dyn-001H Revised:Nov 13,2012 5 4.08.In the Time Axis tab, click the Set-up Logger button. This allows you to change the number of samples the logger will keep on the plot. The full simulation takes 5 hours, which is equal to 900 20-second intervals.Enter900 in the Logger Size field. 4.09. In the Dynamics tab in the Ribbon,clickon the Integrator button. 4.10. In the Integrator menu, enter an end time of 120 minutes. Click the Start button to run the first 2 hours of the simulation.
  • 436.
    Dyn-001H Revised:Nov 13,2012 6 4.11.On the Flowsheet, double click on LIC-100, and change the set point to 60%. This specifies a tank level that is60% full.
  • 437.
    Dyn-001H Revised:Nov 13,2012 7 4.12.Change the End Time of the Integrator to 300 minutes, and press Continue to finish the remaining 3 hours of the simulation. 4.13. When the simulation finishes, right click on the strip chart PRODUCT-DL1 and select Graph Control. In the Time Axistab, change Low Time to 0 minutes. 4.14. Resize PRODUCT-DL1 by dragging the corner. Observe the effect that changing the tank height had on the product stream.
  • 438.
    Dyn-001H Revised:Nov 13,2012 8 4.15.Change in feedrate. We will nowexperiment withanotherscenariotoinvestigatethe reactordynamics. (1) Run simulationfor2hours (2) Linearramp up the feedrate from 2.064e+4 lb/hr to 2.8e+4 lb/hr in2 hours (3) Linearramp downthe feedrate from 2.8e+4 lb/hr to 0 lb/hr in1 hour 4.16. Click the Integrator button in the Dynamics tab on the Ribbon. Clear the value for End Time so that it reads<Non-stop> and pressthe Resetbutton. ClickYeson the subsequentwindow thatappears.
  • 439.
    Dyn-001H Revised:Nov 13,2012 9 4.17.Change the SP of LIC-100 back to 87.22 and run the simulation until the PRODUCT stream stabilizes. This will returnthe simulationtoitsoriginal state. Resetthe Integratoragain. 4.18. Under ModelingOptionsinthe Dynamics tab of the Ribbon,clickon Event Scheduler. 4.19. The Event Schedulerallowsusto setup a seriesof eventsthatcantake place at differenttimesordue to specifictriggers.Click AddunderSchedule Optionstocreate a new schedule. ClickAddonthe right- handside of the windowtocreate a new Sequence withinthe schedule.
  • 440.
    Dyn-001H Revised:Nov 13,2012 10 4.20.Click View to open Sequence A. This sequence will consist of three events. Ramping up the controller set point, ramping down the set point, and terminating the sequence. Click the Add button three times to create three events. 4.21. Double click on Event 1 to specify the first event. In the Condition tab, click the A Specific Simulation Time radiobuttonand enter2 hours for WaitUntil.
  • 441.
    Dyn-001H Revised:Nov 13,2012 11 4.22.In the Action List tab, click Add to create a new Action. In the Type dropdown menu, select Ramp Controller. Click Select Target and choose FIC-100 for Controller. Enter 28000 lb/hr for the Target SP, and 2 hours forRamp Duration. Close the window. 4.23. In the window titled Sequence A of Schedule 1, double click on Event 2. This is the step where the controller ramps down, and it occurs 4 hours into the simulation. Once again, click the A Specific Simulation Time radio button, and this time enter 4 hours in the Wait Until field. Add a new Action in the Action List tab, and select Ramp Controller for Type. Select FIC-100 for Controller, 0 for Target SP, and 1 hour forRamp Duration. 4.24. Double click on Event 3 in the Sequence A of Schedule 1 to specify the final event. Select the A Specific Simulation Time radio button and enter 5 hours in the Wait Until Field in the Condition tab. In the Action tab, Add a new Action,and selectStopIntegrator for Type. 4.25. In the Sequence Aof Schedule 1 window,click Start underSequence Options.
  • 442.
    Dyn-001H Revised:Nov 13,2012 12 4.26.The simulationisreadytobegin.Click Runinthe Dynamics tab of the Ribbon. 4.27. View stripchartPRODUCT-DL1 to see the effectsof changingthe flow rate. 5. Conclusion You shouldnowbe familiarwith the basicsetupof a dynamicsimulationinHYSYS. You should alsobe familiar withhowto initialize asimulation,create customplots,displayresults,andmake changesinprocessconditions. Changesincontrollersetpointsorotherprocessconditionscanhave large effectsonthe overall processandit isimportantto understandthese effectswhendesigningoroperatingaprocess.
  • 443.
    Dyn-001H Revised:Nov 13,2012 13 6.Copyright Copyright © 2012 by Aspen Technology, Inc. (“AspenTech”). All rights reserved. This work may not be reproduced or distributed in any form or by any means without the prior written consent of AspenTech. ASPENTECH MAKES NO WARRANTY OR REPRESENTATION, EITHER EXPRESSED OR IMPLIED, WITH RESPECT TO THIS WORK and assumes no liability for any errors or omissions. In no event will AspenTech be liable to you for damages, including any loss of profits, lost savings, or other incidental or consequential damages arising out of the use of the information contained in, or the digital files supplied with or for use with, thiswork. This workand itscontentsare providedforeducational purposesonly. AspenTech®, aspenONE®, and the Aspen leaf logo, are trademarks of Aspen Technology, Inc.. Brands and productnamesmentionedinthisdocumentationare trademarksorservice marksof theirrespective companies.
  • 444.
    Dyn-002H Revised:Nov9,2012 1 Dynamic Analysisof a PFR with Aspen HYSYS® V8.0 1. Lesson Objective:  To understandbasicworkflowtocreate andrun dynamicsimulationusingAspen HYSYS  To setupa simple dynamicsimulationof PFR  To setupa basic controller  To observe the effectof perturbationsonthe controllersettings 2. Prerequisites  Aspen HYSYS V8.0  File Dyn-002_PFR_Start.hsc 3. Background Dynamic Simulation in Chemical Engineering Dynamic simulation is an extension of steady-state process simulation whereby time-dependence is built into the models via derivative terms i.e. accumulation of mass and energy. The advent of dynamic simulation means that the time-dependent description and control of real processes in real or simulated time are possible. This includes the description of starting up and shutting down a plant, changes of conditions during a reaction, holdups, thermal changes and more. Dynamic simulations require increased calculation time and are mathematically more complex than steady-state simulations. They can be seen as repeatedly calculated steady- state simulations (based on a fixed time step) with constantly changing parameters. Dynamic simulation can be used in both an online and offline fashion. The online case being model predictive control, where the real-time simulation results are used to predict the changes that would occur for a control input change, and the control parameters are optimized based on the results. Offline process simulation can be used in the design, troubleshooting and optimization of process plant as well as the conduction of case studies to assess the impactsof processmodifications. The examplespresentedare solelyintendedtoillustrate specificconceptsand principles. Theymay not reflectan industrial application or real situation.
  • 445.
    Dyn-002H Revised:Nov9,2012 2 4. ProblemStatement and Solution Problem: Using the provided Aspen HYSYS file Dyn-002H_PFR_Start.hsc, prepare a dynamic simulation flowsheet by adding the required dynamic data. Then perform the following study to investigate how the reactor systembehaves dynamically inresponse tochangesinfeedtemperature. Descriptionof the providedAspen HYSYSfile “Dyn-002_PFR_Start.hsc”: - PFR reactor - Reaction activation energy E = 5000 cal/mol; which will allow a temperature sensitivity to the reactor duringthe course of the dynamicsimulation - Reactor type = Adiabatic - Pressure drop= 0.1bar Aspen HYSYS Solution: 4.01. Start AspenHYSYS V8.0. OpenDyn-002_PFR_Start.hsc. 4.02. The systemconsistsof a PFR witha Heater that preheatsthe FEED stream. 4.03. Inserta controller.A controllerwillbe usedtocontrol the FEED Temperature.In the Model Palette, clickon the Dynamics tab and double clickon PID Controller.
  • 446.
    Dyn-002H Revised:Nov9,2012 3 4.04. Awindowcalled IC-100will appear.Click the SelectPVbuttontospecifythe ProcessVariable.Thisisthe variable thatwill be controlled.Inthiscase,the PVis FEED Temperature.
  • 447.
    Dyn-002H Revised:Nov9,2012 4 4.05. Theoutput(OP) is the variable thatis variedinorderto control the PV.Clickthe SelectOP button,and choose Q for Objectand Control Valve forVariable. Thisisthe heatflow tothe heater.
  • 448.
    Dyn-002H Revised:Nov9,2012 5 4.06. ClicktheControl Valve… buttontospecifythe range of valuesforthe OP. In the Direct Q section,enter 1e+04 kcal/h for Min.Available and 1e+07 kcal/h for Max. Available.
  • 449.
    Dyn-002H Revised:Nov9,2012 6 4.07. Backin the TIC-100 window,move tothe Parameterstab. In the Range section,setPVMinimumto 10°C and PV Maximumto 80°C. The setsthe range of valuesforthe FEED Temperature. In the Operational Parameters section,make sure that Action: isset to Reverse. A Reverse actioncontroller meansthat whenthe erroris positive (i.e.the temperature ishigherthanthe setpoint),the OPwill decrease (reduce heatflow). SetMode toAuto, whichwill varythe OPto reachthe SP. Manual Mode allowsyoutoadjustthe OPmanually. Finally,underTuningParameters,enter0.1 for Kc and 0.2 for Ti. The Parameters tab shouldlooklike the image shownbelow.
  • 450.
    Dyn-002H Revised:Nov9,2012 7 4.08. Goto the Dynamics tab,press the Dynamic Mode button. 4.09. A dialogbox will warnyouthatthere are itemsthatneedattention.Click Yestobringup the Dynamics Assistant.
  • 451.
    Dyn-002H Revised:Nov9,2012 8 4.10. Inorder for Dynamics to run properly, either the pressure or the flow must be specified in the input and output streams. Move to the Streams tab, and the Assistant will show which streams need specificationsandwhichdonot.
  • 452.
    Dyn-002H Revised:Nov9,2012 9 4.11. Doubleclick on the stream FEED, and move to the Dynamics tab. Uncheck the Active box under Flow SpecificationandPressure Specification.
  • 453.
    Dyn-002H Revised:Nov9,2012 10 4.12. Closethe window. Double click on both PREFEED and PRODUCT streams, and make sure the Pressure Specifications are Active and the Flow Specifications are not. Click the Analyze Again button in the Dynamics Assistant window. Inthe Streams tab,there should now be no streamsineitherbox. 4.13. In the checklist in the General tab, there are now only two entries. A way to expedite the setup process is to use the Make Changes button, which will automatically resolve the issues. This button can be useful, but may make changes that are undesired. In this case, we will click Make Changes. Click Finish whencomplete.
  • 454.
    Dyn-002H Revised:Nov9,2012 11 4.14. Weare now ready to enter Dynamics mode. Click the Dynamics Mode button in the Dynamics tab, and clickYeswhenprompted. 4.15. Strip charts can be used to monitor the changes that take place. Double click on the Product stream and move to the Dynamics tab. On the left-hand side of the window, click Stripchart. The dropdown menu next to Variable Set has many premade strip charts that can be used. Select the T, P, and F chart, which containsthe variables Temperature,Pressure,andMolar Flow.
  • 455.
    Dyn-002H Revised:Nov9,2012 12 4.16. Clickon Create Stripchart to create a strip chart called Product-DL1. Click on Display to bring up the actual plot.
  • 456.
    Dyn-002H Revised:Nov9,2012 13 4.17. Rightnow, the only label on the Y-axis is Molar Flow. Right click on the plot and select Graph Control. In the Axes tab, check the Show All box in Axis Display for all three variables to be displayed. Also check the Automatic Auto Scale box underAuto Scale.
  • 457.
    Dyn-002H Revised:Nov9,2012 14 4.18. Wealso want to change the timeframe that the chart will observe. In the Time Axis tab of the Strip Chart Configuration window, click the Set-up Logger button. Change the Logger Size to 900. This means that the loggerwill take 900 samplesat20 secondintervals,givingatotal observationtime of 5hours. 4.19. Strip charts can also be created from scratch. Click on the Strip Charts folder in the Navigation Pane, and clickthe Add buttonto create a new StripChart. Name thischart PRODUCT-COMP.
  • 458.
    Dyn-002H Revised:Nov9,2012 15 4.20. Doubleclick on PRODUCT-COMP. Click on the Add button to add variables to the strip chart. Add the Master Comp Mole Flowfor AceticAcid and E-Acetate in the Product stream.
  • 459.
    Dyn-002H Revised:Nov9,2012 16 4.21. Inthe PRODUCT-COMP window, click on Display to bring up the plot. Once again, right click on the graph and open up Graph Control to display all variables on the Y-Axis. Also check the Automatic Auto Scale box and setthe Logger Size to 900. 4.22. We will create the followingscenario toinvestigatethe reactordynamics.  Run the dynamic simulation for 1 hour at 10°C (Note: this is in simulated time, not in actual time)  Ramp upthe feedtemperaturefrom 10 to 60°C overthe course of 1 hour  Continue the dynamicrunforanotherhour  Ramp the feed temperature downfrom60 to 10°C over1 hour.  Continue the dynamicrunforan additional hour  Look at the impacton the product streamresults (componentflows,temperature,etc.) 4.23. In the Dynamics tab of the Ribbon,clickon Event SchedulerinModelingOptions.
  • 460.
    Dyn-002H Revised:Nov9,2012 17 4.24. ClickAddunderSchedule Optionstocreate a new schedule.Click Addonthe right-handside of the windowtocreate a new Sequence inthe schedule. 4.25. Double clickon Sequence Ato bring upthe Sequence Aof Schedule 1 window. ClickAdd3 timesto create 3 Events.Double clickon Event 1 to configure the conditionsforthe firsteventinthe scenario.
  • 461.
    Dyn-002H Revised:Nov9,2012 18 4.26. Thefirststepin the scenarioisto run the simulationfor 1hour. Selectthe A SpecificSimulationTime radiobuttonunderWait For…,and enter1 hour in the Wait Until field.
  • 462.
    Dyn-002H Revised:Nov9,2012 19 4.27. Moveto the Action List tab.Click Add inList of Actions For This Event to create Action 1. Make sure that the Type isRamp Controller.InConfiguration,click SelectTarget, and selectthe TIC-100 as the variable.Enter60°C inthe Target SP box and 1 hour inthe Ramp Duration box.
  • 463.
    Dyn-002H Revised:Nov9,2012 20 4.28. Closethe window.Backinthe Sequence Awindow, double clickon Event2. Afterthe temperature is elevatedto 60°C,the simulationistorunfor an additional hourbefore the temperature is reducedto 10°C. Therefore,the eventshouldoccuratthe 3 hour mark. Selectthe radiobuttonforA Specific SimulationTime and entera Wait Until value of 3 hours. Inthe ActionList tab, add a new action. SelectRamp ControllerforType and TIC-100 for Target, andenter10°C for Target SP and1 hour for Ramp Duration.
  • 464.
    Dyn-002H Revised:Nov9,2012 21 4.29. Finally,double clickon Event3. The simulationistorunfor anotherhourbefore ending,meaningthe total processwill runfor 5 hours. Selectthe radiobuttonfor A SpecificSimulationTime and enter5 hours for the WaitUntil value. Inthe Action List tab adda new actionand select StopIntegrator for Type. 4.30. The Scenario is readyto start.In the Sequence A of Schedule 1 window,click StartunderSequence Options.
  • 465.
    Dyn-002H Revised:Nov9,2012 22 4.31. Bothstripcharts can be viewedbygoingtotheirrespective foldersinthe NavigationPane and clicking Display. 4.32. In the Dynamics Tab inthe Ribbon, clickRun. 4.33. The changesin productflowandstream conditionscanbe monitoredinthe stripchartsas the simulationtakesplace.Whenitisfinished,rightclickonthe charts andselect GraphControl. The Axes and Time Axis tabscan be usedto change the axissize andobserve the entire simulation.The charts shouldlooklike those presentedbelow.
  • 466.
  • 467.
    Dyn-002H Revised:Nov9,2012 24 4.34. Ifyou wishtorerun the simulationor runa difference sequence,youmust resetthe integratorand restartthe sequence. 5. Conclusion You shouldnowbe familiarwithhowtotake a simple Aspen HYSYSsimulationandconvertittoa HYSYS Dynamicssimulation,aswell ashowto setup controllersanduse the DynamicsAssistantutility. Changesin controllersetpointsorotherprocessconditionscanhave large effectsonthe overall processanditisimportant to understandthese effectswhendesigningoroperatingaprocess. 6. Copyright Copyright © 2012 by Aspen Technology, Inc. (“AspenTech”). All rights reserved. This work may not be reproduced or distributed in any form or by any means without the prior written consent of AspenTech. ASPENTECH MAKES NO WARRANTY OR REPRESENTATION, EITHER EXPRESSED OR IMPLIED, WITH RESPECT TO THIS WORK and assumes no liability for any errors or omissions. In no event will AspenTech be liable to you for damages, including any loss of profits, lost savings, or other incidental or consequential damages arising out of the use of the information contained in, or the digital files supplied with or for use with, thiswork. This workand itscontentsare providedforeducational purposesonly. AspenTech®, aspenONE®, and the Aspen leaf logo, are trademarks of Aspen Technology, Inc.. Brands and productnamesmentioned inthisdocumentationare trademarksorservice marksof theirrespective companies.
  • 468.
    Dyn-003H Revised:Nov20,2012 1 Dynamic Analysisof Cyclohexane Production with Aspen HYSYS® V8.0 1. Objectives  Convertpreviouslycreated AspenHYSYS processsimulationtoAspen HYSYSDynamics simulation  Become familiarwithAspen HYSYSDynamicsV8.0 userinterface  Investigate the effectsof asudden changes inhydrogenfeedrate onproductcompositionand flowrate 2. Prerequisites  Aspen HYSYS V8.0  File Dyn_003H_Cyclohexane_Start.hsc 3. Background Aspen HYSYS is used to design new plants or model existing ones at what is considered to be the nominal process operating conditions at steady-state. However, real processes operate at steady-states that may be very different from the nominal one assumed by the static simulator. In particular, HYSYS Dynamics allows users to observe how the system switches from one steady-state condition to another one, or how the process responds to all sort of disturbances—reactant stream flowrate or purity changes, pressure or temperature variations at different locations—and finally, the prediction of worst case scenarios in case of power loss, fires, deactivated catalystbedin reactorsor reactors inrunawayconditions, etc. Aspen HYSYS Dynamics is also used to design the right control scheme that would minimize or better “reject” the effect of severe disturbances on the plant performance and, as you may expect, process dynamics and processcontrol can hardlybe conceivedwithoutone another. The examples presented are solely intended to illustrate specific concepts and principles. They may not reflectan industrial application or real situation.
  • 469.
    Dyn-003H Revised:Nov20,2012 2 4. AspenHYSYS Solution In thisexample we will investigatethe dynamicresponse of asmall sectionof a cyclohexaneplanttochangesin feedrate to the reactor. 4.01. Openthe Aspen HYSYS file called Dyn_003H_Cyclohexane_Start.hsc. 4.02. Modify the simulation in order to enable dynamics mode in Aspen HYSYS. In the Dynamics tab of the Ribbon,clickon the Dynamics Assistantbutton. This will bringupthe Dynamics Assistant window. 4.03. The window shows information that needs to be specified in order for the simulation to be converted to a dynamiccase. Double clickonthe firstentry, Enable stream pressure specifications.
  • 470.
    Dyn-003H Revised:Nov20,2012 3 4.04. ThePressure Specs form under the Streams tab will appear. There are three streams that are listed under Set pressure specifications in these streams. These are the input and output streams. If you double click on a stream, it will bring up the corresponding window. Move to the Dynamics tab of the window, and check the Pressure Specification box. Activate the pressure specifications for each listed stream.
  • 471.
    Dyn-003H Revised:Nov20,2012 4 4.05. Inthe General tabof the Dynamics Assistant window,clickon Analyze Again. Notice that the firstitem on the listis removed. 4.06. The nextitemonthe listis Valvesnot sized. Close the window,anddouble clickon VLV-101on the flow sheet. Inthe Rating tab of the VLV-101 window,clickthe Size Valve button,andHYSYS will automaticallysize VLV-101. The parametersthatHYSYS determinesare agoodstarting point,butthey may needtobe modifiedonce the simulationisactuallyrun. If the tunerindicatesthatthe valve is completelyopen,butthe flowisnotreachingthe setpoint,then Cv,the conductance,mayneedtobe increased. Conductance isameasure of how much flow canpass throughthe valve.Repeatthisstep withvalve VLV-100.
  • 472.
    Dyn-003H Revised:Nov20,2012 5 4.07. Ifyou try to click the Size Valve button for VLV-102, you will be given a message that HYSYS is unable to size the valve because there is no flow across it. In the Sizing Methods block of the Sizing tab, make sure the Cv radio button is selected. This valve controls the flow out the bottom of the reactor. However, the reaction takes place almost entirely in the vapor phase, so only a negligible amount of liquid flow is expected. Therefore, a small conductance, such as 5, is acceptable. Enter 5 in the Cv entry of the table.
  • 473.
    Dyn-003H Revised:Nov20,2012 6 4.08. Clickonthe Dynamic Assistant buttonagain. If youclickon Miscellaneousspecification changes,you will be broughttothe Othertab. The Dynamics Assistant recommendsthatthe pressure dropover CRV-100 be setto 0. However,we are settingupa pressure drivensimulation,where flowis determinedfrompressure differences. Inorderto avoidreverse flows,we willnotremove the pressure drop fromthe reactor.
  • 474.
    Dyn-003H Revised:Nov20,2012 7 4.09. Thefinal entryon the inthe General tab of the Dynamics Assistantindicatesthata volume needstobe specified. Thisisreferringtothe conversionreactor, CRV-100. Double clickonthe reactor inthe flow sheet,andmove tothe Rating tab. The Vertical andCylinderradiobuttonsshouldbe selected. Heuristicsexist thatcandetermine whatvolume isnecessaryfora reactiontotake place. We will use 1080 ft3 .
  • 475.
    Dyn-003H Revised:Nov20,2012 8 4.10. TheDynamics Assistant should now only display the Miscellaneous change. We are now ready to move to Dynamics mode. Click the Dynamics Mode button in the Dynamics tab of the Ribbon, and click No whenaskedwhetheryouwouldlike toresolveidentifieditemsinneedof attention. 4.11. The controllers are currently set to manual. Double click on H2-TUNE and move to the Parameters window. Select Auto for Mode, and make sure that SP is set to 310 lbmole/hr. Do the same for BZ- TUNE, butmake sure SP issetto 100.
  • 476.
    Dyn-003H Revised:Nov20,2012 9 4.12. Clickon the flowsheet and type Shift+F on the keyboard. This will display the molar flow of every stream. Click the Run button in the Dynamics tab on the Ribbon, and again choose not to resolve the items the Dynamics Assistant identified. Allow the simulation to run until the flows have stabilized, then clickthe Stop buttonnextto the Run button. The flow sheetshouldlookasdisplayedbelow.
  • 477.
    Dyn-003H Revised:Nov20,2012 10 4.13. Thegoal of thissimulationistoobserve the effectthata suddenchangesinthe hydrogenfeedwill have on the reaction. We will nowconstructa strip chart for thatpurpose. Clickonthe Strip Charts folderin the Navigation Pane,and click Add to create a stripchart named DataLogger1.
  • 478.
    Dyn-003H Revised:Nov20,2012 11 4.14. Doubleclickon DataLogger1, and thenclick Add to selectthe variablesthatwillbe displayedonthe chart. Add the Molar Flowand Master Comp Mole Frac (Cyclohexane) forthe FLASH-INstream. Click the Display buttonto create the plot. 4.15. Rightclickon the black plotareaof DataLogger1 and selectGraphControl. Inthe Axeswindow,check the Automatic Auto Scale and Show All boxes. 4.16. Move to the Time Axis tab. Clickthe Set-upLogger button,andenter900 in the Logger Size field. This will cause the loggertokeep 900 points,takenat20 secondintervals,whichtranslatesto 5 hoursof runtime.
  • 479.
    Dyn-003H Revised:Nov20,2012 12 4.17. Wewill be runningthe followingsequence:  Run the simulationfor1hour.  Overthe course of 1 hour, ramp the hydrogenfeedfrom 310 lbmole/hrto 300 lbmole/hour.  Run the simulationfor1hour.  Overthe course of 1 hour, ramp the hydrogenfeedupto 320 lbmole/hr.  Run the simulationof anadditional hour. 4.18. Clickon the Integrator buttoninthe Dynamics tab of the Ribbon. 4.19. The first step in the sequence is to run the simulation for 1 hour. In the End Time field, enter 1 hour (60 minutes). First hit the Reset button in the Dynamics ribbon to reset the integrator, then click Run to run the simulation.
  • 480.
    Dyn-003H Revised:Nov20,2012 13 4.20. DataLogger1should show constant flow and mole fraction, as shown as shown below. The scale of the time axiscan be changedby draggingthe red arrow at the bottomof the window. 4.21. The next step is to ramp the hydrogen feed down to 300 lbmole/hr over an hour. Double click on H2- TUNE and move to the Parameters | Advanced page. In the Set Point Ramping section, click Enable to enable ramping of the tuner. Change the Target SP to 300 lbmole/hr and Ramp Duration to 1 hour (60 minutes).
  • 481.
    Dyn-003H Revised:Nov20,2012 14 4.22. OpentheIntegrator windowagain,andchange the End Time to 2 hours. Run the simulation. Right clickon DataLogger1 and selectGraphControl. Inthe Axestab,uncheckthe Automatic Auto Scale box. Axis2-Mole Fractionshouldbe selectedinthe listontothe left.UnderScaling,enter.9 forLow Range Value and .95 for High Range value. Tothe left,selectAxis1-MolarFlow,andenter94 forthe Low Range and 103 for the High. DataLogger1 shouldnow be easiertoread. 4.23. The simulationmustnowbe runfor 1 hour. Openthe Integrator,and change End Time to 3 hours. Run the simulation.
  • 482.
    Dyn-003H Revised:Nov20,2012 15 4.24. Next,wewill Rampupthe hydrogenfeedto 320 lbmole/hroveran hour. Setthe SP of H2-TUNER to Ramp up to 320 lbmole/hrin 1 hour. Openthe Integrator window,andchange EndTime to 4 hours, thenRun the simulation. Resizethe axesonDataLogger1 so that youcan observe the full range of values.
  • 483.
    Dyn-003H Revised:Nov20,2012 16 4.25. Thesimluationneedstorunfor 1 hour. Setthe Integrator to endafter 5 hours. Run the simulationand resize DataLogger1.
  • 484.
    Dyn-003H Revised:Nov20,2012 17 5. Conclusion Youcan see that when the hydrogen flowrate decreases, the mole fraction of cyclohexane in the product stream significantly decreases. This is because there is not enough hydrogen in the feed to convert all the benzene, which results in unreacted benzene in the product stream. From a business standpoint, this is not good for several reasons. There is money being lost by throwing away benzene in the product stream, and the product stream may not even meet composition specifications anymore. This means you will be forced to recycle and process the product stream which leads to extra costs, or you may be forced to sell the product at a much lower price than desired. When the flowrate of hydrogen was increased, all the benzene was reacted and excess hydrogen was being fed into the system. This is the reason for the increased product flowrate and decreased fraction of cyclohexane when the hydrogen feed increased. The excess hydrogen represents another cost, as largerequipmentwill be neededtotransport and separate the stream. 6. Copyright Copyright © 2012 by Aspen Technology, Inc. (“AspenTech”). All rights reserved. This work may not be reproduced or distributed in any form or by any means without the prior written consent of AspenTech. ASPENTECH MAKES NO WARRANTY OR REPRESENTATION, EITHER EXPRESSED OR IMPLIED, WITH
  • 485.
    Dyn-003H Revised:Nov20,2012 18 RESPECT TOTHIS WORK and assumes no liability for any errors or omissions. In no event will AspenTech be liable to you for damages, including any loss of profits, lost savings, or other incidental or consequential damages arising out of the use of the information contained in, or the digital files supplied with or for use with, thiswork. This workand itscontentsare providedforeducational purposesonly. AspenTech®, aspenONE®, and the Aspen leaf logo, are trademarks of Aspen Technology, Inc.. Brands and productnamesmentionedinthisdocumentationare trademarksorservice marksof theirrespective companies.
  • 486.
    Dyn-004H Revised:Nov14,2012 1 Tank Fillingand Draining with Aspen HYSYS® V8.0 1. Lesson Objective:  To observe the interactionbetweensetpointsandprocessvariablesinadynamicsystem  To understandbasicsof a dynamicsimulation inAspenHYSYS 2. Prerequisites  Aspen HYSYS V8.0  File Dyn-004H_Tank_Start.hsc 3. Background Dynamic Simulation in Chemical Engineering Dynamic simulation is an extension of steady-state process simulation whereby time-dependence is built into the models via derivative terms i.e. accumulation of mass and energy. The advent of dynamic simulation means that the time-dependent description and control of real processes in real or simulated time are possible. This includes the description of starting up and shutting down a plant, changes of conditions during a reaction, holdups, thermal changes, and more. Dynamic simulations require increased calculation time and are mathematically more complex than steady-state simulations. They can be seen as repeatedly calculated steady- state simulations (based on a fixed time step) with constantly changing parameters. Dynamic simulation can be used in both an online and offline fashion. The online case utilizes model predictive control, where the real-time simulation results are used to predict the changes that would occur for a control input change, and the control parameters are optimized based on the results. Offline process simulation can be used in the design, troubleshooting and optimization of process plant as well as the conduction of case studies to assess the impactsof processmodifications. The examplespresentedare solelyintendedtoillustrate specificconceptsand principles. Theymay not reflectan industrial application or real situation. 4. Problem Statement and Solution Problem Statement An inletstreamwith the followingspecificationsisfedtoa 3 m3 tank:  Pressure:3 bar  Temperature:25 °C  Mass flowrate:4000 kg/hr
  • 487.
    Dyn-004H Revised:Nov14,2012 2  Composition:80%waterand20% air The outletstreamsare dischargedat 1 bar. Using the providedAspen HYSYSfile Dyn-004H_Tank_Start.hsc, prepare a dynamicsimulation flowsheetandobserve the dynamicresponseof changingthe liquidlevel setpoint for the tank. Aspen HYSYS Solution 4.01. Start AspenHYSYS V8.0. OpenDyn-004H_Tank_Start.hsc. 4.02. Before a transition fromsteadystate todynamicoccurs,the simulationflowsheetshouldbe setupso that a high-to-lowpressure gradientexistsacrossthe flowsheet.The pressuregradientis necessaryas no pressure gradient meansnoflow. Addthree valvestothe flowsheet andconnectandrename the streamsas showninthe screenshotbelow. 4.03. Openthe material stream Feedandgo to the Worksheet| Conditions page.Enter25°C for Temperature, 3 bar_g forPressure,and 4000 kg/h for Mass Flow.
  • 488.
    Dyn-004H Revised:Nov14,2012 3 4.04. Goto the Worksheet|Compositionpage.Clickthe Edit buttonand enter0.8, 0.04, and 0.16 for H2O, Oxygen,and Nitrogen,respectively.Clickthe OKbuttonwhenfinished. 4.05. Go to the Dynamics tab.Confirmthat onlythe Pressure SpecificationisActive inthe Dynamic Specificationsframe.
  • 489.
    Dyn-004H Revised:Nov14,2012 4 4.06. Openthematerial stream Airand go to the Dynamics tab. Enter 1 bar_g for Pressure and checkthe Active checkbox inthe Pressure Specificationframe. 4.07. Openthe material stream Waterand go to the Dynamics tab. Enter1 bar_g forPressure and check the Active checkbox inthe Pressure Specificationframe. 4.08. Openthe material stream 3 and go to the Dynamics tab. Enter2 bar_g for Pressure anduncheckthe Active checkbox inthe Pressure Specificationframe.This will solvethe steadystate solutionandaidthe transitiontodynamics.
  • 490.
    Dyn-004H Revised:Nov14,2012 5 4.09. Openthevalve VLV-100 and go to the Dynamics | Specs page.Enter70 forConductance (Cv) and check the checkbox forPressure FlowRelation. 4.10. Openthe valve VLV-101 and go to the Dynamics | Specs page.Enter50 forConductance (Cv) and check the checkbox forPressure FlowRelation. 4.11. Openthe valve VLV-102 and go to the Dynamics | Specs page.Enter50 forConductance (Cv) and check the checkbox forPressure FlowRelation. 4.12. Openthe tank V-100 and go to the Dynamics | Specspage. Enter the Vessel Volume of 3 m3 and 0 %for LiquidVolume Percent.Clickthe Add/Configure Level Controllerbutton.
  • 491.
    Dyn-004H Revised:Nov14,2012 6 4.13. OpentheaddedcontrollerLIC-100 andgo to the Connectionstab.Confirmthe processvariable and controlleroutputare selectedasshowninthe screenshotbelow.
  • 492.
    Dyn-004H Revised:Nov14,2012 7 4.14. Goto the Parameters| Configuration page.SelectAutoforMode and enter50% forSP in the Operational Parameters frame.Change the Kc and Ti to 0.5 and 5 minutesrespectively.Clickthe Face Plate buttonto viewthe face plate forthe controller.
  • 493.
    Dyn-004H Revised:Nov14,2012 8 4.15. Addanew PID Controllerto the flowsheet fromthe Dynamicstab inthe Model Palette.Go to the Connectionstab of thiscontroller.Clickthe SelectPV buttonandselect FeedandMass Flowfor the Objectand Variable. 4.16. Clickthe SelectOP buttonand select VLV-100 andActuator DesiredPositionforthe Objectand Variable.The Connectionstab shouldappearasthe screenshotbelow.
  • 494.
    Dyn-004H Revised:Nov14,2012 9 4.17. Goto Parameters | Configuration page. Enter 0 kg/hr and 5000 kg/hr forPV Minimumand PV Maximum,respectively. SelectReverse forAction,Auto forMode,and enter4000 kg/hr forSP. Change the Kc andTi to 0.5 and 1.0 minute,respectively.Clickthe Face Plate buttontodisplaythe face plate of thiscontroller.
  • 495.
    Dyn-004H Revised:Nov14,2012 10 4.18. Nowtheflowsheetshouldappearasthe followingscreenshot. FIC-100will allow aconstantflowrate intothe tank and we will use LIC-100 to control the drainingof the tank.
  • 496.
    Dyn-004H Revised:Nov14,2012 11 4.19. Goto the Dynamics tab of the ribbon.Clickthe Dynamics Mode buttonand click Yesto the dialogue. 4.20. From the Dynamics tab of the ribbon,clickthe Integrator button. 4.21. Change the Accelerationto 0.50. This will allow aslowerintegrationinordertoobserve the changesin the system. Enteran End Time of 90 minutes topause the integrationafter1.5 hours.
  • 497.
    Dyn-004H Revised:Nov14,2012 12 4.22. Fromthe Dynamics tab of the ribbon, click the Strip Charts button. In the new window, click Add button. Then,highlightthe DataLogger1 andclickthe Edit button. 4.23. Clickthe Add buttoninthe DataLogger1 window.Addthe followingvariablestothe stripchart:  V-100 | LiquidPercent Level  LIC-100 | SP 4.24. The DataLogger1 windowshouldappearasthe screenshotbelow.Clickthe Displaybuttontodisplaythe chart.
  • 498.
    Dyn-004H Revised:Nov14,2012 13 4.25. Thebottom of the stripchart has the logcontrollerbarwhichcontrolsthe time axis.Clickanddrag the redmarker to the lefttoexpandthe range of display. 4.26. From the Dynamics tab of the ribbon,clickthe Run buttonto initialize the dynamicsystem. 4.27. Whenthe run is complete,the stripchart DataLogger1 shouldlooklike the followingscreenshot. The controllerLIC-100 reachedthe setpointwith some overshootandoscillation.
  • 499.
    Dyn-004H Revised:Nov14,2012 14 4.28. Opentheintegrator fromthe Dynamics tab of the ribbon. Change the End time to 180 minutes. 4.29. From the face plate,change the setpointfor LIC-100 to 75 %.The setpointindicatorwill be moved.
  • 500.
    Dyn-004H Revised:Nov14,2012 15 4.30. ClicktheRun buttonfrom the Dynamics tab of the ribbon.Whenthe runis complete,the stripchart shouldlooklike the followingscreenshot.Some overshootandoscillationsare observedandthe offsetis minimal. 4.31. Openthe Integrator from the Dynamics tab of the ribbon.Change the Endtime to 270 minutes. 4.32. From the face plate,change the setpointfor LIC-100 to 25 %. 4.33. Clickthe Run buttonfrom the Dynamics tab of the ribbon.Whenthe runis complete,the stripchart shouldlooklike the followingscreenshot. Some overshootandoscillationsare observedandthe offset isminimal.
  • 501.
    Dyn-004H Revised:Nov14,2012 16 5. Conclusion Withthetuningparametersusedinthisprocess,the level controllerproducedsome overshootandoscillation withminimal offset.We observedthe effectof changingthe setpointsonthe processvariables. Inorderto eliminatethe overshootoroscillationinthe controller,one cantune the controllerparametersfurthervia several differentmethods. We will investigatethe tuningmethodsin Dyn-005H_ControllerTuning. You should nowbe familiarwithhowtotake a simple Aspen HYSYSsimulationandconvertittoa HYSYS Dynamics simulation. InHYSYS Dynamics, youshouldbe familiarwithhow toinitializeasimulation,create customplots, displayresults,andmake changesinprocessconditions. Changesincontroller setpointsorotherprocess conditionscanhave large effectsonthe overall processanditisimportantto understandthese effectswhen designingoroperatingaprocess. 6. Copyright Copyright © 2012 by Aspen Technology, Inc. (“AspenTech”). All rights reserved. This work may not be reproduced or distributed in any form or by any means without the prior written consent of AspenTech. ASPENTECH MAKES NO WARRANTY OR REPRESENTATION, EITHER EXPRESSED OR IMPLIED, WITH RESPECT TO THIS WORK and assumes no liability for any errors or omissions. In no event will AspenTech be liable to you for damages, including any loss of profits, lost savings, or other incidental or consequential damages arising out of the use of the information contained in, or the digital files supplied with or for use with, thiswork. This workand itscontentsare providedforeducational purposesonly.
  • 502.
    Dyn-004H Revised:Nov14,2012 17 AspenTech®, aspenONE®,and the Aspen leaf logo, are trademarks of Aspen Technology, Inc.. Brands and productnamesmentioned inthisdocumentationare trademarksorservice marksof theirrespective companies.
  • 503.
    Dyn-005H Revised:Nov16,2012 1 Controller ParameterTuning with Aspen HYSYS® V8.0 1. Lesson Objective:  Use Ziegler-Nichols, Cohen-Coon, and time integral tuning methods to determine the optimal controllertuningparameters  To understandbasicsof dynamicsimulation inAspenHYSYS 2. Prerequisites  Aspen HYSYS V8.0  File Dyn-005H_Controller_Tuning_Start.hsc 3. Background There are several methodsfortuningacontroller,includingZiegler-Nichols,Cohen-Coon,andthe ITAEtuning method.Inthistutorial,we will utilizethesemethodstodeterminethe tuningparametersfora secondorder system. Most processescanbe well approximatedbyafirstorderresponse withtime delay. Analysisof this response canthenbe usedto determine tuningparametersforthe process. A processreactioncurve can be obtainedfromthe controlledprocesswith the controllerdisconnected. From the processreactioncurve,one can acquire valuesof K,τ, andα, whichallowsapproximationof the process reactioncurve viaa first-ordersystemwithtime delay: ( ) Giventhis, several tuningmethodscanbe used toobtainapproximate tuningparameters.Inthistutorial,we will use a PID controller,whichhasthe following tuningrules: Tuning Method Ziegler-Nichols ( ) Cohen-Coon ( ) ( ( )) [ ( ) ( ) ] [ ( ) ] ITAE ( ) [ ( )] ( )
  • 504.
    Dyn-005H Revised:Nov16,2012 2 The examplespresentedaresolely intendedtoillustrate specificconceptsand principles. They may not reflectan industrial application or real situation. 4. Problem Statement and Solution Problem Statement There are twotanksin serieswithwaterflowingintoandoutof each tank.There are twowaterstreamsbeing fedintothe firsttank,a hotwater streamanda coldwaterstream. We wouldlike tocontrol the temperature of the secondtank byvaryingthe flowrate of the hotand cold streamsflowingintothe firsttank. Thissetupis shownbelow. In thisflowsheetwe have several controllers. Eachtank has a controllertokeep itsliquidlevelconstant. The coldwater streamhasa controllerthatmaintainsa constantcombinedwaterstreamflowrate. So,if the hot watervalve opens,the coldwatervalve will closeaccordingly. We have installedacontrollerattachedtothe hot watervalve thatwe wishto use to control the temperature of the secondtank. Inthislessonwe will determine the tuningparametersforthiscontroller. In orderto determine the tuningparametersforthe temperaturecontroller,we mustfirstobtainaprocess reactioncurve. We have disconnectedthe controllerfromthe valve andimplementeda15% increase inthe valve opening. We have recordedthe resultingresponse inthe temperature of the secondtank. Thisplotis shownbelow.
  • 505.
    Dyn-005H Revised:Nov16,2012 3 A tangentlinecanbe drawn at the inflextionpointonthe curve and the valuesforthe keyparamterscan be estimatedfromthe graph:   α =20 seconds = 0.33 minutes  τ = 200 seconds = 3.33 minutes 0 2 4 6 8 10 12 14 16 0 100 200 300 400 500 600 VesselTemperature%Change Time (seconds) 0 2 4 6 8 10 12 14 16 0 100 200 300 400 500 600 VesselTemperature%Change Time (seconds)
  • 506.
    Dyn-005H Revised:Nov16,2012 4 Usingthe Zieglar-NicholsPIDtuningruleswe canobtainthe followingtuningparameters: ( ) ( ) ( ) Usingthe Cohen-CoonPIDtuningruleswe canobtainthe followingtuningparameters: ( )( ( )) [ ( ) ( ) ] [ ( ) ] Usingthe MinimumITAEPID tuningruleswe canobtainthe followingtuning parameters: ( ) [ ( )] ( ) ( ) We can thenuse a simulatorsuchas AspenHYSYS to model the processanddeterminethe optimal tuning parametersforthissystem. Aspen HYSYS Solution 4.01. Start AspenHYSYS V8.0. OpenDyn-005_Controller_Tuning_Start.hsc. 4.02. On the face plate for the temperature controller(TIC-100),selectAutotoactivate the controller.
  • 507.
    Dyn-005H Revised:Nov16,2012 5 4.03. Inthe Dynamics tab in the ribbon,clickthe StripCharts button. Thiswill openthe StripChartwindow. ClickDisplay. 4.04. The DataLogger1 windowwillappear. Close the StripChartwindow.
  • 508.
    Dyn-005H Revised:Nov16,2012 6 4.05. ClicktheRun buttonfrom the Dynamic tab of the ribbon. 4.06. You will see twolinesonthe stripchart. The blue line isthe controllersetpointandthe purple line is the vessel temperature. Youshouldnotice immediatelythatthere isanoffsetbetweenthe setpoint and the actual value. Thisisbecause the controlleriscurrentlyonlyactingasa proportional controller. If you clickthe Tuning buttonon the temperature controlleryouwill seethe tuningparameters.
  • 509.
    Dyn-005H Revised:Nov16,2012 7 4.07. Changethe setpoint(SP) for the temperature controllerto 60°C.
  • 510.
    Dyn-005H Revised:Nov16,2012 8 4.08. Youshouldsee the followingresponseonthe stripchart. Notice thatthere are oscillationsanda significantsteadystate offset.
  • 511.
    Dyn-005H Revised:Nov16,2012 9 4.09. Changethe setpoint(SP) to 75°C. The response shouldlooklikethe following.
  • 512.
    Dyn-005H Revised:Nov16,2012 10 4.10. ClicktheStop buttonin the Dynamics tab of the ribbon. 4.11. We will nowenterthe tuningparametersthatwe calculatedusingthe Ziegler-Nicholstuningrules. Click the Tuning buttonon the temperature control face plate. Enterthe new tuningparametersasshown below.
  • 513.
    Dyn-005H Revised:Nov16,2012 11 4.12. Changethe setpoint(SP) to 65°C and clickthe Run buttonin the ribbon. The response shouldlooklike the stripchart shownbelow. Youcan see thatthe new tuningparametershave eliminatedthe steady state offset,howeverwe still have significantoscillations. The Ziegler-Nicholstuningmethodoftenleads to veryaggressive parameters,whichwouldexplainthe large overshootseeninthe response. 4.13. Change the tuningparameterstothe valuescalculatedusingthe Cohen-Coontuningmethod.
  • 514.
    Dyn-005H Revised:Nov16,2012 12 4.14. Runthe dynamicsimulationagain. Startingfrom 75°C, change the set pointto 65°C. The response shouldlooklike the stripchartbelow. These tuningparametersare alsoquite aggressive andleadtoa large overshootof the setpoint.
  • 515.
    Dyn-005H Revised:Nov16,2012 13 4.15. Lastly,changethe tuningparameterstothe valuescalculatedusingthe ITAEmethod. Note thatthese particularcorrelationsforthe tuningparametersare designedforaset-pointresponse andare meantto be lessaggressive than othermethods.
  • 516.
    Dyn-005H Revised:Nov16,2012 14 4.16. Runthe simulationindynamicmode andmake asetpointchange to 65°C startingfrom a temperature of 75°C. The response shouldlooklike the stripchartbelow. Youcan see thatwiththese parameters the tank reachesthe setpointveryquicklywithlittleovershootandoscillations.
  • 517.
    Dyn-005H Revised:Nov16,2012 15 5. Conclusion Inthislessonwe learnedhowtodetermine tuningparametersusing three differentmethods. UsingAspen HYSYS we couldobserve howthe systemrespondstodifferenttuningparametersandcontrollerstepchanges. Tuningparametersfoundfromthe methodsusedinthislessonare oftenastartingpointwhichisfollowedby manual tuning. Manual tuningallowsthe operatortomodifythe tuningparametersasisneeded,butoften requiresexperience toknowhowtomanipulate the controllercorrectly. AspenHYSYSallowsusersto manipulate tuningparameterstoobserve how the systemrespondstochanges. 6. Copyright Copyright © 2012 by Aspen Technology, Inc. (“AspenTech”). All rights reserved. This work may not be reproduced or distributed in any form or by any means without the prior written consent of AspenTech. ASPENTECH MAKES NO WARRANTY OR REPRESENTATION, EITHER EXPRESSED OR IMPLIED, WITH RESPECT TO THIS WORK and assumes no liability for any errors or omissions. In no event will AspenTech be liable to you for damages, including any loss of profits, lost savings, or other incidental or consequential damages arising out of the use of the information contained in, or the digital files supplied with or for use with, thiswork. This workand itscontentsare providedforeducational purposesonly.
  • 518.
    Dyn-005H Revised:Nov16,2012 16 AspenTech®, aspenONE®,and the Aspen leaf logo, are trademarks of Aspen Technology, Inc.. Brands and productnamesmentionedinthisdocumentationare trademarksorservice marksof theirrespective companies.
  • 519.
    Dyn-006H Revised:Nov 28,2012 1 Depressuringwith Aspen HYSYS® V8.0 1. Lesson Objective:  To construct a simple case usingthe Depressuring Analysis inAspenHYSYS. 2. Prerequisites  Aspen HYSYS V8.0 3. Background Any process dealing with gasses has the potential for unsafe pressure buildup. This can happen because of instrument failure, loss of power, or an unforeseen heat source such as a fire. If pressure does build up, there must be a depressuring system in place to depressurize in a safe manner. The pressure is bled through a valve until it reaches a safe level. The excess gas can also be sent to a pressure vessel, but these vessels are also equipped with valves to prevent overpressure. Gas blowdown valves are common in oil wells. When the wells are not in use, the pressure can build up. A blowdown valve vents the excess gas to a flare, where the hydrocarbonscan be burnedbefore beingreleasedintothe atmosphere. The examplespresentedare solelyintendedtoillustrate specificconceptsand principles. Theymay not reflectan industrial application or real situation. 4. Problem Statement and Solution Problem Statement A nitrogenstreamthathas builtupan excesspressure  Pressure:2161 psia  Temperature:62.6 °F  Molar flowrate:2.205 lbmole/hr Use the AspenHYSYS DepressuringUtilityto determine the behaviorof the gas ina depressuringprocessthat takes100 seconds. Assume anadiabaticcase withnoexternal heatsource.
  • 520.
    Dyn-006H Revised:Nov 28,2012 2 AspenHYSYS Solution 4.01. Start AspenHYSYS V8.0. Opena Newcase. 4.02. The ComponentLists windowwill be displayed. ClickAddtocreate ComponentList-1 and add Nitrogen to the list. 4.03. Clickthe FluidPackages folderinthe NavigationPane,thenclick Add to create Basis-1. Selectthe Peng-Robinsonpropertypackage.
  • 521.
    Dyn-006H Revised:Nov 28,2012 3 4.04.Move to the simulation environmentbyclickingon the Simulationbuttoninthe bottomrightcorner of the screen. 4.05. Inserta Material Stream fromthe Model Palette. 4.06. Double clickonthe stream.In the Worksheettab,entera Temperature of 62.6° F, a Pressure of 2161 psia, anda Molar Flowof 2.205 lbmole/hr. If necessary,change the UnitSet to Fieldinorderto match the unitsbeingused. Inthe Worksheet| Compositionframe,enteraMole Frac of 1 for Nitrogen. 4.07. In the Home tab of the Ribbon,clickon Analysis| Depressuring.
  • 522.
    Dyn-006H Revised:Nov 28,2012 4 4.08.ClickAdd to create Depressuring-Dynamics-1,thenclick Editto enterinvaluesforthe Depressuring utility. 4.09. Selectstream1 for Inlets. HYSYS will automaticallysize the vessel. However,we will choose different values. Make sure the Vertical radiobuttonisselectedunder VesselParameters,thendelete the entry for Flat End Vessel Volume. Entera Heightof 5 ft and a Diameter of 0.8957 ft,and the rest of the valuesshouldbe calculated. The page shouldresemble the image below.
  • 523.
    Dyn-006H Revised:Nov 28,2012 5 4.10.ClickHeat Flux in the leftside of the window,andchange the AmbientTemperature to62.33° F under Heat Loss Parameters.
  • 524.
    Dyn-006H Revised:Nov 28,2012 6 4.11.Notice that Unknown Vessel Metal Thickness is displayed in the status bar at the bottom of the window. To addressthis,selectthe Conductionradiobutton. Inthe table under Metal,entera Thicknessof 0.9843 inches. Also,underinsulationentera Thicknessof 0 inches.
  • 525.
    Dyn-006H Revised:Nov 28,2012 7 4.12.Click on Valve Parameters on the left side of the window. Change the Vapour Flow Equation to General, thenendera Cd of 0.7 and an Area of 4.907e-2 in2 . A Cd that is lessthan1 signifiesthatthe effective orifice flowareaislessthanthe physical area,whichisa commonoccurrence. 4.13. Clickon OperatingConditions inthe leftside of the window. UnderOperatingParameters,change the Time StepSize to 0.05 secondsand the DepressuringTime to 100 seconds.
  • 526.
    Dyn-006H Revised:Nov 28,2012 8 4.14.The Depressuringutilityshouldbe readytocalculate. Move tothe Performance tab andselectStrip Charts on the leftside of the window. There isapremade chart named Depressuring-Dynamics-1-DL. However,thischarthas over20 variables,andwill be difficulttoread. We will create a new plotthat onlycontainsthe mostrelevantinformation. Clickonthe Create Plot buttonto create DataLogger1, thenclick Add Variable… to selectthe variablesforthe plot. 4.15. We are onlyconcernedwiththe vapourflow,aswe downnot anticipate anyliquid. Depressuring- Dynamics-1 shouldbe selected underFlowsheet. Underthe Objectcolumn,select Vapour@TPL1 and Mass Flow underVariable. Alsoadd Vapour@TPL1, Pressure andVapour@TPL1, Temperature.
  • 527.
    Dyn-006H Revised:Nov 28,2012 9 4.16.In the Performance tab, change the SamplingInterval of DataLogger1 to 0.05 seconds,thenclick View Strip Chart….
  • 528.
    Dyn-006H Revised:Nov 28,2012 10 4.17.ClickDisplayin the DataLogger1 window todisplaythe plot. Rightclick on the plotand select Graph Control. Inthe Axestab,check the boxesmarked AutomaticAuto Scale inthe Auto Scale sectionand Show All in the AxisDisplay section. 4.18. Move to the Time Axis tab,and clickon Set-upLogger. Change the Logger Size to 2003, and make sure the Sample Interval is 0.05 seconds. 4.19. We are now readyto run the simulation.Close the StripChart Configuration window andreturntothe Depressuring-Dynamics-1window. The sub-flowsheetwill runindynamicsuntil the depressuringtime iscomplete,andthenthe systemwill returntosteadystate. Clickthe Runbuttonat the bottomof the Depressuring-Dynamics-1window,andwaitforthe simulationtocomplete.
  • 529.
    Dyn-006H Revised:Nov 28,2012 11 4.20.View DataLogger1 to see howthe Vapour Mass Flow,Pressure,and Temperature behaved. The Time Axiscan be adjustedbyusingthe redtriangle atthe bottomof the chart. 4.21. Additional informationcanbe foundinthe Summary page of the Performance tab. 4.22. In the Main Flowsheet,doubleclickon Depressuring-Dynamics-1(Flowsheet), andclickthe Sub- FlowsheetEnvironment… button. Thiswill enterthe depressuringsub-flowsheet.
  • 530.
    Dyn-006H Revised:Nov 28,2012 12 4.23.The sub-flowsheetcontainsinformationforthe vessel,aswell asspreadsheetsthatcanexportdata.
  • 531.
    Dyn-006H Revised:Nov 28,2012 13 5.Conclusion In thislessonwe examinedabasiccase of an adiabaticdepressuring. The adiabaticcase describesasystemsuch as an oil well where excesspressure hasbuiltupbutthere isnoexternal heat.Pressure buildupcanalsobe the resultof an accidentsuchas a fire. Inthiscase, the OperatingMode can be changedto Fire Mode,whichallows youto specifyaheat flux. The Use Spreadsheetoptionisalsoavailable,whichallowsausertoeditthe duty spreadsheetwithoutthe valuesbeingoverwrittenwhenthe utilityruns. Depressuringisimportant inassuring the safetyof a process. 6. Copyright Copyright © 2012 by Aspen Technology, Inc. (“AspenTech”). All rights reserved. This work may not be reproduced or distributed in any form or by any means without the prior written consent of AspenTech. ASPENTECH MAKES NO WARRANTY OR REPRESENTATION, EITHER EXPRESSED OR IMPLIED, WITH RESPECT TO THIS WORK and assumes no liability for any errors or omissions. In no event will AspenTech be liable to you for damages, including any loss of profits, lost savings, or other incidental or consequential damages arising out of the use of the information contained in, or the digital files supplied with or for use with, thiswork. This workand itscontentsare providedforeducational purposesonly.
  • 532.
    Dyn-006H Revised:Nov 28,2012 14 AspenTech®,aspenONE®, and the Aspen leaf logo, are trademarks of Aspen Technology, Inc.. Brands and productnamesmentioned inthisdocumentationare trademarksorservice marksof theirrespective companies.
  • 533.
  • 534.
    Design-001H Revised:Nov7,2012 1 Ammonia Synthesiswith Aspen HYSYS® V8.0 Part 1 Open Loop Simulation of Ammonia Synthesis 1. Lesson Objectives  Become comfortable andfamiliarwiththe Aspen HYSYSgraphical userinterface  Explore Aspen HYSYSflowsheethandlingtechniques  Understandthe basicinputrequiredtorunan Aspen HYSYSsimulation  Determinationof Physical Propertiesmethod forAmmoniaSynthesis  Applyacquiredskill tobuildan openloopAmmoniaSynthesisprocess simulation  Enter the minimuminputrequiredforansimplifiedAmmoniaSynthesismodel  Examine the openloopsimulationresults 2. Prerequisites  Aspen HYSYS V8.0 3. Background Ammoniaisone of the most highlyproducedchemicalsinthe worldandismostlyused infertilizers. In1913 FritzHaber and Carl Bosch developedaprocessforthe manufacture of ammoniaonan industrial scale (Haber- Bosch process). Thisprocessisknownforextremelyhighpressureswhichare requiredtomaintainareasonable equilibriumconstant. Today,thisprocessproduces500 milliontonsof nitrogenfertilizerperyearandis responsible forsustainingone-thirdof the Earth’spopulation. Ammoniaisproducedbyreactingnitrogenfromairwithhydrogen. Hydrogenisusuallyobtainedfromsteam reformationof methane,andnitrogenisobtainedfromdeoxygenatedair. The chemical reactionisshown below: Our goal is to produce a simulationforthe productionof ammoniausingAspen HYSYS. We will create avery simplified versionof thisprocessinordertolearnthe basicsof how to create a flowsheetinthe Aspen HYSYS V8.0 userinterface. A diagramfor thisprocessisshownbelow.
  • 535.
    Design-001H Revised:Nov7,2012 2 Knowledge Base:Physical Properties for Ammonia Process Equation-of-state modelsprovide anaccurate descriptionof the thermodynamicpropertiesof the high- temperature,high-pressureconditionsencounteredinammoniaplants. The Peng-Robinsonequationof state was chosenforthisapplication. The examplespresentedare solelyintendedtoillustrate specificconceptsand principles. Theymay not reflectan industrial application or real situation.
  • 536.
    Design-001H Revised:Nov7,2012 3 4. AspenHYSYS Solution Build a Process Simulation for Ammonia Synthesis 4.01. Start AspenHYSYS V8.0. SelectNewon the Start Page to create a new simulation. 4.02. Create a componentlist. Inthe ComponentLists folder,selectAdd.Addthe followingcomponentsto the componentlist. 4.03. Create a fluidpackage. Inthe FluidPackages folder,selectAdd. Selectthe Peng-Robinsonproperty package. 4.04. Define reactions. Goto the Reactions folder,andclick Add. Thiswill create anew reactionsetcalled Set-1. InSet-1, selectAddReaction andselectHysys,Conversion.Thiswill create anew reactioncalled Rxn-1.
  • 537.
    Design-001H Revised:Nov7,2012 4 4.05. Doubleclickon Rxn-1 to openthe Rxn-1window. Enterthe followinginformation. Close thiswindow whencomplete. 4.06. In Set-1,we must nowattach the reactionsetto a fluidpackage. Clickthe Add to FP buttonandselect Basis-1. The reactionset shouldnow be ready.
  • 538.
    Design-001H Revised:Nov7,2012 5 4.07. Goto the simulationenvironment. Clickonthe Simulationbutton inthe bottom leftof the screen.Then findthe FlowsheetMaintab. The FlowsheetMainisthe mainsimulationflowsheetwhere youwill create a simulation. 4.08. From the Model Palette,adda Compressor to the mainflowsheet.
  • 539.
    Design-001H Revised:Nov7,2012 6 4.09. Doubleclickthe compressor(K-100) to openthe propertywindow. Create an Inletstreamcalled SynGas,an Outlet streamcalled S2,and an Energy streamcalled Q-Comp1.
  • 540.
    Design-001H Revised:Nov7,2012 7 4.10. Wemustdefine ourSynGasfeedstream. In K-100, go to the Worksheettab. For the stream SynGas, entera Temperature of 280°C, a Pressure of 25.5 bar_g, anda Molar Flowof 7000 kgmole/h. In the Compositionformenterthe followingmole fractions. StreamSynGasshouldnow solve. 4.11. Specifythe compressoroutletpressure. Inthe Worksheettabof K-100, entera Pressure of 274 bar_g for streamS2. The compressorshouldnow solve.
  • 541.
    Design-001H Revised:Nov7,2012 8 4.12. Theflowsheetshouldlooklike the following. 4.13. Next,we will addamixer. Adda Mixerto the flowsheetfromthe Model Palette.
  • 542.
    Design-001H Revised:Nov7,2012 9 4.14. Doubleclickonthe mixer(MIX-100) to openthe mixerwindow. Selectstream S2as the Inletand create an Outletstreamcalled S3. The mixershouldsolve. We will eventuallyuse thismixertoconnecta recycle streamto the process.
  • 543.
    Design-001H Revised:Nov7,2012 10 4.15. Next,addaheaterto the flowsheet. 4.16. Double clickonthe heater(E-100) to openthe heaterwindow. SelectS3 as the Inletstream, create an Outletstreamcalled S4, and create an Energy streamcalled Q-Heater. In the Parameters formin the Designtab, entera Delta P of 0. In the Worksheettab,specifyanoutlet Temperature of 775 K (481.9°C). Note thatthisheateriscurrentlyactingas a cooler,butonce we connectthe recycle stream thisblockwill infactadd heatand raise the temperature of the stream.
  • 544.
    Design-001H Revised:Nov7,2012 11 4.17. Next,wewill addareactor to the flowsheet. Thisprocessusesplugflow reactorstoaccomplish synthesisreaction,butforthissimplifiedsimulationwe willuse aconversionreactor. Touse a plugflow reactor,we wouldneedtohave detailedkineticsdescribingthe reaction. Press F12to openthe UnitOps window. Selectthe Reactorsradiobuttonand select ConversionReactor. Click Add.
  • 545.
    Design-001H Revised:Nov7,2012 12 4.18. AfterclickingAdd,theconversionreactorwindow will open. Selectan Inletstreamof S4 and create a Vapour Outletstream of S5V, a Liquid Outletstreamof S5L, and an Energy streamcalledQ-Reac. 4.19. In the conversionreactorwindow(CRV-100),gotothe Reactionstab. SelectSet-1for Reaction Set. In the Worksheettab enteranoutlet Temperature of 481.9°C for streamS5L. Thisvalue will copyoverto S5V. The reactor shouldthen solve. Notice thatthe contentsof the reactorare entirelyvapor; therefore the liquidoutletstreamhasa flowrate of zero.
  • 546.
    Design-001H Revised:Nov7,2012 13 4.20. Theflowsheetshouldnowlooklikethe following. 4.21. We will nowadda coolerto cool the vapor streamleavingthe reactor.
  • 547.
    Design-001H Revised:Nov7,2012 14 4.22. Doubleclickthe cooler(E-101) toopenthe coolerwindow. Selectstream S5Vas the Inletstream, create an Outlet streamcalled S6,and create an Energy streamcalled Q-Cooler.
  • 548.
    Design-001H Revised:Nov7,2012 15 4.23. Inthe Parameters formunderthe Designtab, entera Delta P of 100 bar. We wantto lowerthe pressure inorderto allowaneasierseparationof ammonia. Inthe Worksheettab,specifyanoutlet streamTemperature of 300 K (26.85°C). The coolershouldsolve.
  • 549.
    Design-001H Revised:Nov7,2012 16 4.24. Addaseparatorblockto the flowsheet. 4.25. Double click onthe separator(V-100). Selectan Inletstream of S6, create a Vapour OutletcalledS7, and create a Liquid OutletcalledNH3. The separatorshouldsolve.
  • 550.
    Design-001H Revised:Nov7,2012 17 4.26. Theflowsheetshouldnowlooklikethe following. 4.27. Reviewsimulationresults. Double clickstream NH3. Inthe Conditionsformunderthe Worksheettab youcan viewthe streamflowrate andconditions. Inthe Compositionformyoucan view the stream composition. Here youcansee that the mole fractionof ammonia isequal to 0.9754.
  • 551.
    Design-001H Revised:Nov7,2012 18 4.28. Aftercompletingthissimulation,youshouldsavethe fileasa .hscfile. Itis alsogoodpractice to save periodicallyasyoucreate a simulationsoyoudonot risklosinganywork. The openloopsimulationis nowready to add a recycle stream,whichwe will thencall aclosedloopsimulation. See module Design- 002H for the closedloopdesign. 5. Copyright Copyright © 2012 by Aspen Technology, Inc. (“AspenTech”). All rights reserved. This work may not be reproduced or distributed in any form or by any means without the prior written consent of AspenTech. ASPENTECH MAKES NO WARRANTY OR REPRESENTATION, EITHER EXPRESSED OR IMPLIED, WITH RESPECT TO THIS WORK and assumes no liability for any errors or omissions. In no event will AspenTech be liable to you for damages, including any loss of profits, lost savings, or other incidental or consequential damages arising out of the use of the information contained in, or the digital files supplied with or for use with, thiswork. This workand itscontentsare providedforeducational purposesonly. AspenTech®, aspenONE®, and the Aspen leaf logo, are trademarks of Aspen Technology, Inc.. Brands and productnamesmentioned inthisdocumentationare trademarksorservice marksof theirrespective companies.
  • 552.
    Design-002H Revised:Nov7,2012 1 Ammonia Synthesiswith Aspen HYSYS® V8.0 Part 2 Closed Loop Simulation of Ammonia Synthesis 1. Lesson Objectives  Builduponthe openloopAmmoniaSynthesisprocesssimulation  Inserta purge stream  Learn howto close recycle loops  Explore closedloop convergence methods  Optimize processoperatingconditionstomaximize productcompositionandflowrate  Learn howto utilize the modelanalysistoolsbuiltintoAspenHYSYS  Findthe optimal purge fractiontomeetdesiredproductspecifications  Determine the effectonproductcompositionof adecrease incoolingefficiencyof the pre-flash coolingunit 2. Prerequisites  Aspen HYSYS V8.0  Design-001Module (Part1 of thisseries) 3. Background; Recap of Ammonia Process
  • 553.
    Design-002H Revised:Nov7,2012 2 The examplespresentedaresolelyintendedto illustrate specificconceptsand principles. Theymay not reflectan industrial application or real situation. 4. Aspen HYSYS Solution: In Part 1 of thisseries (Design-001H),the followingflowsheet wasdevelopedforanopenloopAmmonia Synthesisprocess. This process produces two outlet streams; a liquid stream containing the ammonia product and a vapor stream containing mostly unreacted hydrogen and nitrogen. It is desired to capture and recycle these unreacted materialstominimize costsandmaximize productyield. Add Recycle Loop to Ammonia Synthesis Process Beginning with the open loop flowsheet constructed in Part 1 of this series, a recycle loop will be constructed to recoverunreactedhydrogenandnitrogencontainedinthe vaporstreamnamed S7,shownbelow. 4.01. The firststepwill be to adda tee to separate the vaporstreamS7 intotwostreams;a purge streamand a recycle stream. As a rule of thumb,wheneverarecycle streamexists, there mustbe anassociated purge streamto create an exitroute forimpuritiesorbyproductscontainedinthe process. Oftentimes if an exitroute doesnotexist,impuritieswillbuildupinthe processandthe simulationwill fail to converge due toa massbalance error.
  • 554.
    Design-002H Revised:Nov7,2012 3 4.02. Onthe mainflowsheetadda Tee block fromthe Model Palette.The tee blockwill fractionallysplita streamintoseveral streamsaccordingtouserspecifications. Note thatyoucan rotate the tee usingthe Rotate buttonon the Flowsheet/Modifytabof the ribbon. 4.03. Double clickthe tee (TEE-100) to openthe propertywindow. Select S7as the Inletstreamand create twoOutlet streamscalled Rec1and Purge.
  • 555.
    Design-002H Revised:Nov7,2012 4 4.04. Inthe Parameters formunderthe Designtab, entera value of 0.01 for the Flow Ratio of the purge stream.Thismeansthat 1% of the S7 streamwill be divergedtothe purge stream. The tee shouldsolve.
  • 556.
    Design-002H Revised:Nov7,2012 5 4.05. Inorderto recycle stream Rec1 back to the mixer,we mustadda Recycle blockto the flowsheet. The recycle blockisa theoretical blockwhichactstocompare andmodifythe valuesof the outletstream until the inletandoutletstreamsare equal toa specifiedtolerance. 4.06. Double clickthe recycle block(RCY-1). SelectRec1as the Inletstreamand create an Outletstream calledRec2. The flowsheetshouldnow looklike the following.
  • 557.
    Design-002H Revised:Nov7,2012 6 4.07. Weneedtoadd a compressorto raise the pressure of the recycle streambefore we canconnectitback to the mixer. Adda Compressorto the flowsheet. Select Rec2as the Inletstream, create an Oulet streamcalled Rec3, andcreate an Energy streamcalled Q-Comp2. Specifyanoutletstream Pressure of 274 bar_g inthe Worksheettab. The compressorshouldsolve andthe flowsheetshouldlook likethe following. 4.08. The recycle streamisnow readyto be connectedbackto the mixerblockto close the loop. Double click on the mixer(MIX-100) to openthe propertywindow. Addstream Rec3to the Inletstreams.The flowsheetshouldsolve.
  • 558.
    Design-002H Revised:Nov7,2012 7 4.09. Checkresults.Double clickonstream NH3. In the Compositionformunderthe Worksheettabyoucan see that the mole fractionof ammoniaisnow 0.9581. This isbelow ourdesiredmole fractionof 0.96. Optimize the Purge Rate to Deliver Desired Product 4.10. We nowwishdeterminethe purge rate requiredtodelivera productwitha mole fractionof 0.96 ammonia. Addan adjustblockto the flowsheet.
  • 559.
    Design-002H Revised:Nov7,2012 8 4.11. Doubleclickthe adjustblock(ADJ-1) to openthe adjustwindow. We mustdefine ouradjustedand targetedvariables. Forthe AdjustedVariable selectFlowRatio_2 of objectTEE-100. To do this,click the SelectVar… buttonand selectthe followingoptions. Whenfinishedselect OK.
  • 560.
    Design-002H Revised:Nov7,2012 9 4.12. Next,selectthetargetedvariable. Choose MasterCompMole Frac of Ammonia instreamNH3. Thisis shownbelow. Whenfinishedclick OK.
  • 561.
    Design-002H Revised:Nov7,2012 10 4.13. Next,wewill specifythe targetof 0.96 forthe Mole Fraction of Ammonia inthe productstream. The adjustwindowshouldnowlooklikethe following. 4.14. Go to the Parameterstab and entera Step Size of 0.001, and a MaximumIterations of 1000. ClickStart to begincalculations. The adjustblockshouldsolve. Goto the Monitor tab to view results. Youcansee that the mole fractionof ammoniainthe product streamreached0.96 at a purge fractionof 0.019.
  • 562.
  • 563.
    Design-002H Revised:Nov7,2012 12 4.15. Theflowsheetshouldnowlooklikethe following. Investigate the Effect of Flash Feed Temperature on Product Composition 4.16. We wouldnowlike todetermine how fluctuationsinflashfeedtemperature will affectthe product composition.Changesincoolingefficiencyorutilityfluidtemperature canchange the temperature of the flashfeedstream.Thischange intemperature will change the vaporfractionof the stream,thus changingthe compositionof the productandrecycle streams. First,we needtodeactivate the adjust block. Double clickthe adjustblockandcheck Ignored. 4.17. In the navigationpane goto Case Studiesand click Add. 4.18. A newcase studycalled Case Study 1 will be created. In Case Study 1 clickAdd to add variablestothe study. Firstwe will selectthe Mole Fractionof Ammonia inthe productstream NH3.
  • 564.
    Design-002H Revised:Nov7,2012 13 4.19. Next,wewill addthe Temperature of streamS6.
  • 565.
    Design-002H Revised:Nov7,2012 14 4.20. Wewill varythe Temperature of streamS6 from25°C to 100°C witha Step Size of 5°C. 4.21. Clickthe Run button,and thengo to the Plotstab to view the results. 4.22. You will see thatastemperature increases, the ammoniamole fraction decreaseswhichmeansthat whenoperatingthisprocessitwill be veryimportanttomonitorthe flashfeedtemperature inorderto deliverhighqualityproduct.
  • 566.
    Design-002H Revised:Nov7,2012 15 5. Conclusion Thissimulation has proved the feasibility of this design by solving the mass and energy balances. It is now ready to begin to analyze this process for its economic feasibility. See module Design-003H to being the economic analysis. 6. Copyright Copyright © 2012 by Aspen Technology, Inc. (“AspenTech”). All rights reserved. This work may not be reproduced or distributed in any form or by any means without the prior written consent of AspenTech. ASPENTECH MAKES NO WARRANTY OR REPRESENTATION, EITHER EXPRESSED OR IMPLIED, WITH RESPECT TO THIS WORK and assumes no liability for any errors or omissions. In no event will AspenTech be liable to you for damages, including any loss of profits, lost savings, or other incidental or consequential damages arising out of the use of the information contained in, or the digital files supplied with or for use with, thiswork. This workand itscontentsare providedforeducational purposesonly. AspenTech®, aspenONE®, and the Aspen leaf logo, are trademarks of Aspen Technology, Inc.. Brands and productnamesmentioned inthisdocumentationare trademarksorservice marksof theirrespective companies.
  • 567.
    Design-003H Revised:Nov7,2012 1 Ammonia Synthesiswith Aspen HYSYS® V8.0 Part 3 Process Economic Analysis 1. Lesson Objectives  Acquire basicknowledge onthe evaluationof the economicsof achemical process  Builduponthe closedloopAmmoniaSynthesisprocesssimulation  Addprocessstream pricesinfeedandproducts  Addutilitycostsinthe equipment  Learn howto perform economicevaluation withinAspen HYSYS.  Transformsimplifiedprocessintoamore realisticdesign  EconomicAnalysis of followings:  Capital Cost  OperatingCost  Raw MaterialsCost  ProductSales and UtilitiesCost  Estimationof ‘PayOff’period 2. Prerequisites  Aspen HYSYS V8.0  MicrosoftExcel  CompleteddesignmodulesDesign-001Hand Design-002H
  • 568.
    Design-003H Revised:Nov7,2012 2 3. Background,Recap of Ammonia Process The examplespresentedare solelyintended toillustrate specificconceptsand principles. Theymay not reflectan industrial application or real situation. 4. Brief Introduction to Process Economic Analysis During the conceptual design phase 80% of capital costs are determined and 95% of your operating costs are determined at this phase. Operating costs are typically 2-3 times the amount of capital costs. Decisions made during the conceptual design process have a major impact on the final project – so it is important to make the right decisions based on rigorous cost estimates instead of guesswork. The typical workflow of the cost estimationprocessisshownbelow.
  • 569.
    Design-003H Revised:Nov7,2012 3 Typical Workflowof Cost Estimation 5. Aspen HYSYS Solution The followingflowsheetwasdevelopedfora closed loopAmmoniaSynthesisprocess. 5.01. Openthe solution.hscfile forthe closedloopAmmoniaSynthesis. (Design_002_AmmoniaSynthesis_ClosedLoop.hsc)
  • 570.
    Design-003H Revised:Nov7,2012 4 5.02. Thefinal stepof Design_002 was to run a Case Study. This alteredthe Temperature of streamS6, and thuschangedthe purityof stream NH3. Double clickonstream S6. In the Worksheet| Conditions page, change the Temperature back to 26.85°C. 5.03. Next,double clickon TEE-100 and set the FlowRatio of Purge to .019. We are now readyto evaluate cost. 5.04. Firstwe will enterthe buyingandsellingpricesof ourfeedandproductstreamsinorderto determine if our processiscapable of makingmoney. Double clickthe SynGasfeedstreamandgo to the Cost Parameters formunderthe Worksheettab.SelectMassFlow for FlowBasis and enter0.26 Cost/kg for Cost Factor.
  • 571.
    Design-003H Revised:Nov7,2012 5 5.05. Next,doubleclickthe productstream NH3. Inthe Cost Parameters form,selectMassFlow forFlow Basis and enter500 Cost/ton for Cost Factor.
  • 572.
    Design-003H Revised:Nov7,2012 6 5.06. Toviewthe total stream costs,go to the Economics tab in the ribbonandselect Stream Price. 5.07. Thiswill openupthe Model Summary Grid.Here youcan view the total cost foreach material stream. SynGas hasa total cost of $15,941/hr, while the productstream NH3 has a value of $28,794.7/hr. In thiscase the productstreamis roughlytwice asvaluable asthe feedstream.Thisisa goodsignand indicates thatthisprocess maybe profitable.
  • 573.
    Design-003H Revised:Nov7,2012 7 5.08. Nextwewill estimate costsfor utilities. Double clickonenergystream Q-Comp1. SelectPowerfor UtilityType.
  • 574.
    Design-003H Revised:Nov7,2012 8 5.09. Doubleclickonenergystream Q-Comp2and selectPowerforUtilityType. 5.10. Double clickonenergystream Q-Heaterand selectFiredHeat(1000) forUtilityType.
  • 575.
    Design-003H Revised:Nov7,2012 9 5.11. Doubleclick energystreamQ-CoolerandselectCoolingWaterforUtilityType. 5.12. Double click Q-Reacand selectCoolingWaterforUtilityType.
  • 576.
    Design-003H Revised:Nov7,2012 10 5.13. Toviewthe utilitysummary,click FlowsheetSummaryinthe Home tab of the ribbon. 5.14. The FlowsheetSummary windowwill appear. Goto the UtilitySummary tab. Here youcan viewthe cost of each utilityandthe total costs of utilities. The Total Costs of Hot Utilitiesare $2792/hr, andthe Total Costs of ColdUtilitiesare $25.47/hr. 5.15. The operatingprofitof thisprocessisequal to:
  • 577.
    Design-003H Revised:Nov7,2012 11 The operatingprofitofthisprocessis $10,036.23 perhour. The nextstepisto evaluate the capital costs of the process. 5.16. Thissimulationhassofar takenintoaccount the massand energybalancesbutithas yetto consider realisticequipmentdesignconstraints.Thissimulationishighlysimplifiedandhasservedtoprove this processhas potential tobe profitable.The next stepistotransformthishighlysimplifieddesignintoa ‘real-life’designwhichwillprovide more accurate estimationsforcapital andoperatingcosts. Thisis done usingthe builtin economics inAspen HYSYS. Transformsimplified design using built in Economic Analyzer 5.17. Go to the Economicstab, and selectActivate Economics. This will enablethe EconomicAnalysis functionalityinAspen HYSYS. 5.18. Whenthe economicanalysisis Activated, the IntegratedEconomicsbuttonsare enabled andreadyto applyeconomiccalculations. Next,clickthe Mapbutton. 5.19. The map functionisa keystepindeterminingprojectscope and cost.Thisfunctionenablesunit operationsfromthe simulation modeltobe mappedto“real-world”equipmentsothatpreliminary equipmentsizingcanbe performed. This mappingprocessisanalogoustoequipmentselectionand sizingandwill serve asthe basisindeterminingcosts. Whenthe Mapbuttonis clicked,the following windowwill appear.Press OKto continue.
  • 578.
    Design-003H Revised:Nov7,2012 12 5.20. Thefollowingwindow titledMapPreviewwillallow youtochange the mappingforcertainunit operations. The EconomicAnalysis haspre-defineddefaultmappings forunitoperations. However, these maybe changedto create a more realistic costevaluation. Forexample,the defaultmappingfor heatersare floating headshell andtube exchangers,but heaterblock E-100 isa furnace whichburns natural gas. SelectE-100 and click the dropdownmenuunder EquipmentType.
  • 579.
    Design-003H Revised:Nov7,2012 13 5.21. Anewwindowwillappear,select Heatexchangers,heaters and press OK. 5.22. Next,choose Furnace andclick OK.
  • 580.
    Design-003H Revised:Nov7,2012 14 5.23. Lastly,selectVerticalcylindrical process furnace andclick OK.
  • 581.
    Design-003H Revised:Nov7,2012 15 5.24. Youhave nowsuccessfullychangedthe mappingof E-100 and itscost will be evaluatedaccordingly. We mustalso change the mappingof the reactor froman agitatedtank to a plugflow reactor. For this processitis sufficienttomodel the reactoras a shell andtube heatexchanger,because the reactorwill be a vessel containingtubes.Selectthe CRV-100 andclick the dropdownmenuto change equipment type. SelectHeatexchangers,heaters | Heat Exchanger | Fixedtube sheetshell and tube exchanger. ClickOK inthe mappingwindowtocompletethe mappingprocess. 5.25. Next,clickon Size. The sizingprocesswill complete. 5.26. SelectViewEquipmenttoviewthe resultsof the sizing.
  • 582.
    Design-003H Revised:Nov7,2012 16 5.27. TheEconomic Evaluation EquipmentSummary Grid will open. Goto the Equipmenttab. You may encounteranerror forCRV-10 involvingboth the shell andtube streamsbeingheated.Thiscanbe addressedbychangingthe outlettemperature (stream S5V) fromCRV-10to 481.8 °C, whichassures that the shell streamwill decrease intemperature. 5.28. We are ready to evaluate. Clickthe Evaluate buttoninthe ribbon. The economicengine will perform the analysis,itmaytake a fewmoments.
  • 583.
    Design-003H Revised:Nov7,2012 17 5.29. ClickViewEquipment,andgoto the Equipmenttab to view anyerrorsthat occurred duringevaluation. These errorswill tell youwhatinputsorchangesare requiredinorderto cost the simulationmore realistically. 5.30. The evaluation error for compressor E-100 states that the material specified is inadequate for design conditions. To fix this, go to the EFU VERTICAL tab and select a suitable material for construction. Select304S (stainlesssteel) forMaterial.
  • 584.
    Design-003H Revised:Nov7,2012 18 5.31. Theerror for K-100 is that the inlet temperature is too high. To fix this we will had a cooler before the compressortocool downthe inletstream. 5.32. Double click K-100 and remove streamSynGasas an Inletstream. Create an Inlet streamcalled SynGas2. Adda Coolerblockto the flowsheetandselectSynGasasthe Inletstream, SynGas2 as the Outletstream,and create an Energy streamcalled Q-Cooler2. SpecifyaDeltaP of 0 and an outlet Temperature of 300 K. Double clickstream Q-Cooler2andspecify CoolingWaterasthe UtilityType. The flowsheetshouldnowlooklikethe following. 5.33. The errors for both E-101 and CRV-100 are thatthere are no materialsinthe database thatare suited for sucha hightemperature andpressure combination. These materialswill likelyhave tobe custom made for thisspecificprocessandpricedaccordingly. Howeverforthissimplifiedsimulation,we cantry loweringthe operatingpressure inordertogeta cost estimate. Inreal life itmaynotbe plausable to
  • 585.
    Design-003H Revised:Nov7,2012 19 change theoperatingconditions,asthe reaction kineticsmaybe verydependentontemperatureand pressure. However,forthissimulationwe are notusingkinetics. Therefore the reactionwillnotbe affected. 5.34. Double clickeachcompressorandchange the outletpressure to 190 bar_g. The processwill now operate at lowerpressures,allowingeconomicevaluationtoproduce acost estimate. 5.35. Repeatthe mappingandsizingprocesssince anew piece of equipmentnow existsonthe flowsheet. Whenready,click Evaluate. The equipmentresultswillnow looklikethe followinginthe Economic Evaluation EquipmentEquipmentGrid.There shouldnotbe any errors. 5.36. Go the Summary tab to viewresults. 5.37. Thistable displaysthe differentcostsassociatedwithconstructingandoperatingthisprocessaswell as the total productsalesperyear. This processappearstohave the potential of beingahighlyprofitable investment,withapayoff periodof only 3.64 years. 5.38. Clickon the InvestmentAnalysisbutton.
  • 586.
    Design-003H Revised:Nov7,2012 20 5.39. Thiswillopenupa MicrosoftExcel spreadsheetthat summarizesthe results. Inthe Excel spreadsheet there will be the followingsheets: RunSummary, Executive Summary, Cash Flow,ProjectSummary, Equipment,UtilitySummary, UtilityResource Summary, Raw Material Summary, and Product Summary. 5.40. The Executive Summary sheetisa veryuseful sheetwhichdisplaysthe projectname,capacity,plant location,description,scheduling,andinvestmentinformation.Thisisshownbelow. 5.41. The Cash Flowsheetisalso useful anddisplaysvariouscostsandassumptionsthatwentintomakingthe economicestimations.
  • 587.
    Design-003H Revised:Nov7,2012 21 6. Conclusion AspenHYSYS along with the economic analyzer tool can quickly create first approximations of process sizing and costs. This is very useful when attempting to compare several process designs to decide which design will have the best potential to be profitable. If a process has proven to be profitable at this level of analysis, costing engineers will then take this preliminary design and fine tune it in a more detailed costing application such as Aspen Capital Cost Estimator. Taking a conceptual design from a process simulator and being able to accurately estimate the associated costs is extremely valuable and can be the difference between a successful investment and a companygoingout of business.
  • 588.
    Design-003H Revised:Nov7,2012 22 7. Copyright Copyright© 2012 by Aspen Technology, Inc. (“AspenTech”). All rights reserved. This work may not be reproduced or distributed in any form or by any means without the prior written consent of AspenTech. ASPENTECH MAKES NO WARRANTY OR REPRESENTATION, EITHER EXPRESSED OR IMPLIED, WITH RESPECT TO THIS WORK and assumes no liability for any errors or omissions. In no event will AspenTech be liable to you for damages, including any loss of profits, lost savings, or other incidental or consequential damages arising out of the use of the information contained in, or the digital files supplied with or for use with, thiswork. This workand itscontentsare providedforeducational purposesonly. AspenTech®, aspenONE®, and the Aspen leaf logo, are trademarks of Aspen Technology, Inc.. Brands and productnamesmentionedinthisdocumentationare trademarksorservice marksof theirrespective companies.
  • 589.
  • 590.
    PET-001H Revised:Nov6,2012 1 Gas OilSeparation Process with Aspen HYSYS® V8.0 1. Lesson Objectives  Understand the gas oil separationprocess(GOSP)  Understandhowto utilize Conceptual DesignBuilderinAspenHYSYS 2. Prerequisites  Aspen HYSYS V8.0 3. Background An oil well commonlyproducesthe crude consistingof gas,oil,water,andcontaminants. A gasoil separation process(GOSP) handles the crude fromthe well and separatesoil,gas,water,andcontaminants.The processed oil and gas can thenbe sentto oil refineriesandgasprocessingplants,respectively. For fielddevelopmentresearchandassessment,anumberof processscenariosmustbe quicklygeneratedand assignedwithdifferentprobabilities. AspenHYSYS andthe Conceptual DesignBuilderallow youtoquickly generate the necessaryiterated,individual scenariosnecessaryforfielddevelopmentresearchandassessment. The examplespresentedare solelyintendedtoillustrate specificconceptsand principles. Theymay not reflectan industrial application or real situation. 4. Problem Statement and Aspen HYSYS Solution Problem Statement An oil field produces crude oil withthe followingspecificationsthatisprocessedinagas oil separationplant:  Gas/oil ratio(GOR):200  Water/oil ratio(WOR):0.02  Production rate:2000 barrels/day UsingAspenHYSYS and the Conceptual DesignBuilder,determinethe oil,gas,andwater productionrate from thisprocess. Aspen HYSYS Solution 4.01. Start AspenHYSYS V8.0. Clickthe Conceptual DesignBuilderbuttonfrom the GetStarted tab of the ribbonto initialize ConceptualDesignBuilder (CDB).
  • 591.
    PET-001H Revised:Nov6,2012 2 4.02. Fromthe ProjectSetup tab of the CDB window,selectOil FieldforFieldType,Highfor both Environmental SensitivityandPolitical Risk Sensitivity,andLow for PopulationDensity.The latter three specificationsare forreportingpurposes. 4.03. Go to the ProjectSpecificationtab.Enter a Production Rate of 2000 barrels/day, GORof 200, andWOR of 0.02 vol/vol.
  • 592.
    PET-001H Revised:Nov6,2012 3 4.04. Goto the DesignPreferences tab.Inthe Separation frame,select3Stages for the Numberof Stages. Thiswill provide athree-stageseparationtrainforthe process. Clickthe Run DesignCase button from the Home tab of the ribbon.
  • 593.
    PET-001H Revised:Nov6,2012 4 4.05. TheConceptual DesignBuilderwill now automaticallyconstructthe flowsheetin HYSYSaccordingthe specificationsandpreferences.Navigatebackto AspenHYSYS, anda flowsheetshouldbe constructed like the screenshot below.The generatedprocessconsistsof GOSP(Gas-oil separation),gas compression,gassweetening,anddehydrationsections. 4.06. Openthe stream WellFluid2andgoto the Worksheet| Conditions page.Confirmthe Temperature and Pressure is40 °C and48.99 bar_g, respectively.
  • 594.
    PET-001H Revised:Nov6,2012 5 4.07. Goto the Worksheet|Oil & Gas Feed page.Confirmthatthe Total GORand Total WORis 200 and 0.02, respectively,asspecifiedinthe CDB.
  • 595.
    PET-001H Revised:Nov6,2012 6 4.08. TheGOSP unitutilizesathree-stageseparationprocesstoseparate the oil,gas,andwater.Openthe GOSP_1 and clickthe Sub-FlowsheetEnvironmentbuttontoenterthe sub-flowsheetenvironment. 4.09. From the sub-flowsheet,threestagesof 3Phase Separatorsare includedin GOSP_1.The gas,oil,and waterexitthe separatorsas vapor,lightliquid,andheavyliquid,respectively. 4.10. In orderto returnto the main flowsheet,clickthe ViewParentbuttonfromthe Flowsheet/Modifytab of the ribbon.
  • 596.
    PET-001H Revised:Nov6,2012 7 4.11. Openthestream Produced_Water.The waterproductionrate from the processis 297.9 kg/hr. 4.12. Openthe stream Export_Oil. The oil productionrate fromthe processis 11152 kg/hr.
  • 597.
    PET-001H Revised:Nov6,2012 8 4.13. Openthestream ExportGas. The gas productionrate fromthe processis 1987 kg/hr. 5. Conclusions An oil fieldproduces 13510 kg/hrof crude from the well andisprocessedviaagas oil separationprocess (GOSP). The GOSP produced11152 kg/hr,1987 kg/hr,and 297.9 kg/hr of oil,gas,and water,respectively. The detailedAspenHYSYSsimulationcase wasgeneratedfromthe preliminaryfielddata,reducingthe financial risk whendevelopingasuitable engineeringdesign. 6. Copyright Copyright© 2012 by AspenTechnology,Inc.(“AspenTech”).All rightsreserved. Thisworkmaynot be reproducedordistributedinanyformor byany meanswithoutthe priorwrittenconsentof AspenTech. ASPENTECHMAKESNOWARRANTYOR REPRESENTATION,EITHER EXPRESSEDOR IMPLIED, WITH RESPECT TO THIS WORK and assumesnoliabilityforanyerrorsor omissions. Innoeventwill AspenTechbe liable toyoufordamages,includinganylossof profits,lostsavings,orotherincidental orconsequential damagesarisingoutof the use of the informationcontainedin,orthe digital filessuppliedwithorforuse with, thiswork. This workand itscontentsare providedforeducational purposesonly. AspenTech®,aspenONE®,andthe Aspenleaf logo,are trademarksof AspenTechnology,Inc.. Brandsand productnamesmentionedinthisdocumentationare trademarksorservice marksof theirrespective companies.
  • 598.
    PET-002H Revised:Nov 30,2012 1 HydrateFormation in Gas Pipelines with Aspen HYSYS® V8.0 1. Lesson Objectives  Understand the hydrate formationcalculationwithinapipeline modelinAspenHYSYS 2. Prerequisites  Aspen HYSYS V8.0 3. Background Hydratesare commonlyformedinnatural gaspipelineswhenwateriscondensedinthe presence of methaneat highpressures. Natural gashydratesare basicallymodifiedice structuresthatenclose methane andother hydrocarbons. The issue withhydratesis thatat highpressurestheyhave highermeltingpointsthanice andcan cause blockagesinpipelinesandotherprocessingequipment. There are several methodsusedtopreventhydrate formationinpipelinessuchasheatingor reducingthe pressure. A commonmethodusedisto adda hydrate inhibitor(anti-freeze) suchasethyleneglycol whichwill decrease the temperature thathydrateswill form. Inthisdemowe will be simulatingthe pipingnetworkthat mixesstreamsfrom3 gas wells beforetheyare senttoa gas-oil separator. The ambienttemperatureis0°C,and as the gas streamscool due to heatlossinthe pipeline,the riskof hyrdate formationincreases. The examplespresentedare solelyintendedtoillustrate specificconceptsand principles. Theymay not reflectan industrial application or real situation. 4. Problem Statement and Aspen HYSYS Solution Problem Statement Usingthe pre-builtAspenHYSYSflowsheet PET-002H_Hydrate_Formation_Start.hsc, determinethe flowrateof ethylene glycol thatis requiredtopreventanyhydratesfrom beingformedinthe gaspipeline. Aspen HYSYS Solution 4.01. Start AspenHYSYS V8.0. Openthe file named PET-002H_Hydrate_Formation_Start.hsc. 4.02. Once the case file loads andsolves,youwillsee thatthere are three gaswell streamsandan ethylene glycol inhibitorstreambeingfedintoan AspenHydraulicsSub-Flowsheet(AH-100).
  • 599.
    PET-002H Revised:Nov 30,2012 2 4.03.The Aspen Hydraulics Sub-Flowsheetallowsforsimulationof pipes,junctions,mixers,swages,and valves. Pipeline andhydraulicnetworksimulationscanbe solvedinSteadyState mode orDynamic mode. Rightclickon AH-100 and selectOpenFlowsheetasNewTab.
  • 600.
    PET-002H Revised:Nov 30,2012 3 4.04.FlowsheetTPL1 will appear. Here youwill see the pipingnetworkusedtomix the gaswell streamsand the ethylene glycolinhibitor. 4.05. If you place the mouse overthe EG Inhibitorstream, a tool tip will appearshowingyouthe temperature, pressure,andflowof the stream. The ethylene glycolstreamcurrentlyhasaflow rate of 0.1 kg/h. 4.06. We wouldnowlike tocheckif any hydratesare beingformedwiththe currentflow rate of inhibitor. Double clickonthe pipe segment Pipe-104. Go to the FlowAssurance tab and selectthe Hydratesform. In the plotyouwill see ablue line anda redline. The redline representsthe temperatureateachpoint alongthe pipe andthe blue line representsthe temperature atwhichhydrateswill begintoform. With the current flowof ethyleneglycol youcansee thathydrateswill begintoformatapproximately40 metersintothe pipe. Thissuggeststhatinorderto preventhydrate formationwe will needtoaddmore inhibitortothe pipeline.
  • 601.
    PET-002H Revised:Nov 30,2012 4 4.07.Move backto the mainflowsheet(FlowsheetMain). Double clickonthe EG Inhibitorstream and change the flowrate to 50 kg/h. The flowsheetwill solve afterafew moments.
  • 602.
    PET-002H Revised:Nov 30,2012 5 4.08.Nowif you go backto the AspenHydraulics Sub-Flowsheetandview the HydratesformforPipe-104 youwill see the following. The hydrate formationtemperature isnow lowerbuthydratesstill beginto formin the pipe.
  • 603.
    PET-002H Revised:Nov 30,2012 6 4.09.We will nowincrease the ethylene glycolflow again. Goto the mainflowsheetandchange the mass flowof stream EG Inhibitorto 100 kg/h. The flowsheetwill solve afterafew moments.
  • 604.
    PET-002H Revised:Nov 30,2012 7 4.10.The hydrate formationplotnowlookslike the following.
  • 605.
    PET-002H Revised:Nov 30,2012 8 4.11.The blue line (hydrate formationtemperature) isnow completelybelowthe redline (temperature profile). Thisindicatesthathydrate formationisunlikelyforthispipelinewithaninhibitorflowrateof 100 kg/h. 5. Conclusions UsingAspenHYSYS V8.0 we were able to determinethe amountof ethylene glycolisrequiredtoprevent hydrate formationina pipeline network. Itwas determinedthatanethylene glycol flowrate of 100 kg/his sufficientforthisgaspipeline. 6. Copyright Copyright© 2012 by Aspen Technology,Inc.(“AspenTech”).All rightsreserved. Thisworkmaynot be reproducedordistributedinanyformor byany meanswithoutthe priorwrittenconsentof AspenTech. ASPENTECHMAKESNOWARRANTYOR REPRESENTATION,EITHER EXPRESSEDOR IMPLIED, WITH RESPECT TO THIS WORK and assumesnoliabilityforanyerrorsor omissions. Innoeventwill AspenTechbe liable toyoufordamages,includinganylossof profits,lostsavings,orotherincidental orconsequential damagesarisingoutof the use of the informationcontainedin,orthe digital filessuppliedwithorforuse with, thiswork. This workand itscontentsare providedforeducational purposesonly.
  • 606.
    PET-002H Revised:Nov 30,2012 9 AspenTech®,aspenONE®,andtheAspenleaf logo,are trademarksof AspenTechnology,Inc.. Brandsand productnamesmentionedinthisdocumentationare trademarksorservice marksof theirrespective companies.