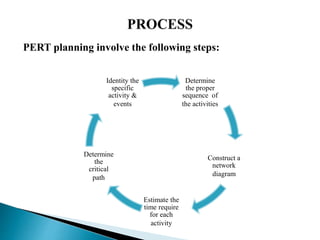
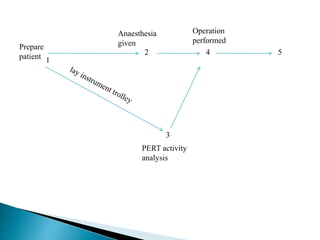
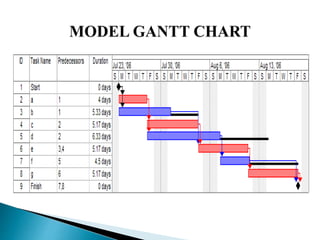
PRESENTED BY- MR. YOGESH A. DENGALE
 PERT was developed in the late 1950 in the US the Polaris
submarine missile programme. It has the potential to reduce
both the time & cost require to complete a project.
 PERT shows the time taken by each component of project & the
total time required for its completion .PERT breaks down the
project into events, activity & lays down their proper sequence
relationship & duration in the form of network.
 PERT is a technique of representing project plan in network.
This is represented in a graphic from known as network
diagram .
 The program (or project) evaluation and review technique,
commonly abbreviated PERT, is a statistical tool, used in
project management, which was designed to analyze and
represent the tasks involved in completing a given project & to
illustrate the flow of events in a project.
There are two types of network diagrams,
 Activity on arrow (AOA) –
In the first variant the duration is denoted on arrow connecting
diagram nodes. Such diagram type called AOA.
 Activity on node (AON)-
in such diagram the information about the task duration is
denoted in the diagram node & each task is represented in the
form of rectangle with definite set of fields.
 Prediction of deliverables
 Planning resource requirement
 Controlling resource allocation
 Internal programme review
 Performance evaluation
 Uniform wide acceptance
 Reduction in cost
 Saving time
 Determination of activities
 Elimination of risk in complex activities
 Flexibility
 Evaluation of alternatives
 Useful effective control
 Useful decision making
 Useful research work
PERT planning involve the following steps:
Determine
the proper
sequence of
the activities
Construct a
network
diagram
Estimate the
time require
for each
activity
Determine
the
critical
path
Identity the
specific
activity &
events
1. Identity Activities & events :
The activities are tasks require to complete the project. The
events marking the beginning & end of one or more
activities. It is helpful to list the tasks in a table that in later
steps can be expanded to include on sequence is duration .
2.Determine the proper sequence of the activities :
This steps may be combine with the activity identification
steps since the activity sequence is event for some task .
Other tasks may require more analysis to determine exact
order in which they must be perform .
3.Construct a network diagram :
 Using the activity sequence information , a network diagram
can be drawn showing the sequence of the serial is & parallel
activities .For the original activity –on-are model, the activities
are depicted by arrowed lines & milestones are depicted by
circles.
4.Estimate the time required for activity :
 A distinguishing feature of PERT is its ability to deal with
uncertainty in activity completion times
For each activity , the model usually includes three time
estimates;-
Optimistic time:
 Generally the shortest time in which the activity can be
completed .
Most likely time :
The completion time having the highest probability note that
this time is different for the expected time.
Pessimistic time :
The longest time that an activity might require.
5. Determine the critical path :
 The critical path is determine by adding the times for the
activities in each sequence & determining the longest path in
project. The critical path determines the total time require.
6.Update the PERT chart as the project progresses :
 Make adjustment in the PERT chart as the project progresses.
As the project unfolds ,the estimated times can be replaced
with actual times. The PERT chart may be modified &
improved to reflect the new situation.
 Simple to understand and use.
 Show whether the project is on schedule; or behind /ahead of
the schedule.
 Identify the activities that need closer attention
 Determine the flexibility available with activities
 Show potential risk with activities
 Provide good documentation of the project activities
 Help to set priorities among activities & resource allocation as
per priority
 Used in research and development projects
 For developing, tooling and introducing a new project
 To plan and execute the acquisition and installation of an
electronic system
 Development and administration of various training
programmes
 For management development and organizational planning
 A major disadvantages of PERT has been its emphasis only
on time, not on costs.
 The cost of setting up such system are extensive
 It is difficult to estimate accurate time & cost of various
activities involved in a project Errors in estimation makes the
PERT charts ,unreliable as a control aid .
 These systems will not help managers to solve all their
problem.
Activity Events
 Prepare patient Patient prepare
 Give anaesthesia Anaesthesia given
 Prepare instrument-trolley Instrument trolley prepared
 Perform operation operation performed
2 4 5
3
1
Prepare
patient
Anaesthesia
given
Operation
performed
PERT activity
analysis
 During the era of scientific management ,a Gantt chart is a
horizontal bar chart developed as a production control tool in
1917 by Henry L. Gantt, an American engineer & social scientist
 A Gantt chart provides a graphical illustration of a schedule that
helps to plan, coordinate & track specific tasks in a project.
 The horizontal axis of the Gantt chart is a time scale , expressed
either in absolute time or in relative time referenced to the
beginning of the project. The resolution depends on the project.
 A chart in which a series of horizontal lines shows the
amount of work done in certain periods of time in
relation to the amount planned for those periods.
 Avoid Completion Confusion
 Keep Everyone on the Same Page
 Understand Task Relationships
 Effectively Allocate Resources
 Get a Handle on the Future
Avoid Completion Confusion:
Gantt charts were created to keep users on track, providing a visual
timeline for starting and finishing specific tasks. By providing a visual
overview of milestones and other key dates.
Keep Everyone on the Same Page:
Where there is a visual framework for the work to be done, there are
fewer chances for misunderstanding, especially when it comes to
highly complex tasks
Understand Task Relationships:
These charts can make clear how various tasks are interrelated and
perhaps rely on the completion of another to meet specific objectives.
 A Gantt charts makes it very easy to visualize related tasks
Effectively Allocate Resources:
 The more closely the chart is followed, the better chance there
is of keeping project costs within budget while also better
assuring on-time completion.
Get a Handle on the Future:
 Gantt chart advantages include helping decision-makers look
farther ahead to ensure each given project is working toward
the achievement the organization’s long-term strategic
objectives.
1. Identify the Purpose
2. Define the Project Timeline
3. Break the Project Down into Manageable Pieces
4. Create Progress Bars
5. Define the Critical Path
6. Add Milestone Markers
1. Identify the Purpose
 It is helpful to first decide whether this is a project or a
process, because diagramming a process might work better
with a flow chart.
2. Define the Project Timeline
 Decide how to divide the increments of time for the duration
of the project. Each one should have a start date, end date,
3. Break the Project Down into Manageable Pieces
 Divide the project into major components, then tasks and
subtasks. Continue breaking them down until they are each
straight forward tasks. They should be of short enough
duration that timeframes can be accurately estimated.
4. Create Progress Bars
 The next step is to create a progress bar for each task. A
progress bar is simply a horizontal bar that should be in line
with the task name it represents and should begin beneath
its start date and end beneath its end date.
5. Define the Critical Path
 What is a critical path? It is a method of looking at all of the
activities in the Gantt chart, considering the timing and
dependent relationships of each, and calculating the longest
path from start to completion of the project.
6. Add Milestone Markers
 Choose a symbol to represent milestones, that is, major
events that either have a large part in the process or must be
completed before progress can continue. Place them on the
chart beneath the date or time when they occur.
 It helps in planning and monitoring the work of project
 Time is explicitly expressed in the chart
 All tasks are visibly at a glance in relation to other
 Deadlines are depicted in the chart.
 Gantt charts, because of their success, form the most easy to
use and the most widely used scheduling tools. But these
charts are also accompanied with some limitation
 In such charts, it is very necessary to keep on updating the
charts, in order to keep it in current form.
 The charts is not able to directly reveal the costs of the
alternate loadings.
 These charts also do not consider the varying
processing times among work centers.
 Other limitations include the inability to include
certain constraints like time, scope, and costs.
i. Textbook of nursing service and education, nisha clement,
page num- 366-380.
ii. Textbook of nursing administration, BT Basvanthappa, page
num- 190 to 193.
iii. Textbook of management of nursing services and education,
PV Publication, page num- 416 to 419.
Pert and gantt chart

Pert and gantt chart

  • 1.
    PRESENTED BY- MR.YOGESH A. DENGALE
  • 2.
     PERT wasdeveloped in the late 1950 in the US the Polaris submarine missile programme. It has the potential to reduce both the time & cost require to complete a project.  PERT shows the time taken by each component of project & the total time required for its completion .PERT breaks down the project into events, activity & lays down their proper sequence relationship & duration in the form of network.  PERT is a technique of representing project plan in network. This is represented in a graphic from known as network diagram .
  • 3.
     The program(or project) evaluation and review technique, commonly abbreviated PERT, is a statistical tool, used in project management, which was designed to analyze and represent the tasks involved in completing a given project & to illustrate the flow of events in a project.
  • 4.
    There are twotypes of network diagrams,  Activity on arrow (AOA) – In the first variant the duration is denoted on arrow connecting diagram nodes. Such diagram type called AOA.  Activity on node (AON)- in such diagram the information about the task duration is denoted in the diagram node & each task is represented in the form of rectangle with definite set of fields.
  • 5.
     Prediction ofdeliverables  Planning resource requirement  Controlling resource allocation  Internal programme review  Performance evaluation  Uniform wide acceptance  Reduction in cost  Saving time
  • 6.
     Determination ofactivities  Elimination of risk in complex activities  Flexibility  Evaluation of alternatives  Useful effective control  Useful decision making  Useful research work
  • 7.
    PERT planning involvethe following steps: Determine the proper sequence of the activities Construct a network diagram Estimate the time require for each activity Determine the critical path Identity the specific activity & events
  • 8.
    1. Identity Activities& events : The activities are tasks require to complete the project. The events marking the beginning & end of one or more activities. It is helpful to list the tasks in a table that in later steps can be expanded to include on sequence is duration . 2.Determine the proper sequence of the activities : This steps may be combine with the activity identification steps since the activity sequence is event for some task . Other tasks may require more analysis to determine exact order in which they must be perform .
  • 9.
    3.Construct a networkdiagram :  Using the activity sequence information , a network diagram can be drawn showing the sequence of the serial is & parallel activities .For the original activity –on-are model, the activities are depicted by arrowed lines & milestones are depicted by circles. 4.Estimate the time required for activity :  A distinguishing feature of PERT is its ability to deal with uncertainty in activity completion times
  • 10.
    For each activity, the model usually includes three time estimates;- Optimistic time:  Generally the shortest time in which the activity can be completed . Most likely time : The completion time having the highest probability note that this time is different for the expected time. Pessimistic time : The longest time that an activity might require.
  • 11.
    5. Determine thecritical path :  The critical path is determine by adding the times for the activities in each sequence & determining the longest path in project. The critical path determines the total time require.
  • 12.
    6.Update the PERTchart as the project progresses :  Make adjustment in the PERT chart as the project progresses. As the project unfolds ,the estimated times can be replaced with actual times. The PERT chart may be modified & improved to reflect the new situation.
  • 13.
     Simple tounderstand and use.  Show whether the project is on schedule; or behind /ahead of the schedule.  Identify the activities that need closer attention  Determine the flexibility available with activities  Show potential risk with activities  Provide good documentation of the project activities  Help to set priorities among activities & resource allocation as per priority
  • 14.
     Used inresearch and development projects  For developing, tooling and introducing a new project  To plan and execute the acquisition and installation of an electronic system  Development and administration of various training programmes  For management development and organizational planning
  • 15.
     A majordisadvantages of PERT has been its emphasis only on time, not on costs.  The cost of setting up such system are extensive  It is difficult to estimate accurate time & cost of various activities involved in a project Errors in estimation makes the PERT charts ,unreliable as a control aid .  These systems will not help managers to solve all their problem.
  • 16.
    Activity Events  Preparepatient Patient prepare  Give anaesthesia Anaesthesia given  Prepare instrument-trolley Instrument trolley prepared  Perform operation operation performed
  • 17.
  • 19.
     During theera of scientific management ,a Gantt chart is a horizontal bar chart developed as a production control tool in 1917 by Henry L. Gantt, an American engineer & social scientist  A Gantt chart provides a graphical illustration of a schedule that helps to plan, coordinate & track specific tasks in a project.  The horizontal axis of the Gantt chart is a time scale , expressed either in absolute time or in relative time referenced to the beginning of the project. The resolution depends on the project.
  • 20.
     A chartin which a series of horizontal lines shows the amount of work done in certain periods of time in relation to the amount planned for those periods.
  • 21.
     Avoid CompletionConfusion  Keep Everyone on the Same Page  Understand Task Relationships  Effectively Allocate Resources  Get a Handle on the Future
  • 22.
    Avoid Completion Confusion: Ganttcharts were created to keep users on track, providing a visual timeline for starting and finishing specific tasks. By providing a visual overview of milestones and other key dates. Keep Everyone on the Same Page: Where there is a visual framework for the work to be done, there are fewer chances for misunderstanding, especially when it comes to highly complex tasks Understand Task Relationships: These charts can make clear how various tasks are interrelated and perhaps rely on the completion of another to meet specific objectives.  A Gantt charts makes it very easy to visualize related tasks
  • 23.
    Effectively Allocate Resources: The more closely the chart is followed, the better chance there is of keeping project costs within budget while also better assuring on-time completion. Get a Handle on the Future:  Gantt chart advantages include helping decision-makers look farther ahead to ensure each given project is working toward the achievement the organization’s long-term strategic objectives.
  • 24.
    1. Identify thePurpose 2. Define the Project Timeline 3. Break the Project Down into Manageable Pieces 4. Create Progress Bars 5. Define the Critical Path 6. Add Milestone Markers
  • 25.
    1. Identify thePurpose  It is helpful to first decide whether this is a project or a process, because diagramming a process might work better with a flow chart. 2. Define the Project Timeline  Decide how to divide the increments of time for the duration of the project. Each one should have a start date, end date,
  • 26.
    3. Break theProject Down into Manageable Pieces  Divide the project into major components, then tasks and subtasks. Continue breaking them down until they are each straight forward tasks. They should be of short enough duration that timeframes can be accurately estimated. 4. Create Progress Bars  The next step is to create a progress bar for each task. A progress bar is simply a horizontal bar that should be in line with the task name it represents and should begin beneath its start date and end beneath its end date.
  • 27.
    5. Define theCritical Path  What is a critical path? It is a method of looking at all of the activities in the Gantt chart, considering the timing and dependent relationships of each, and calculating the longest path from start to completion of the project. 6. Add Milestone Markers  Choose a symbol to represent milestones, that is, major events that either have a large part in the process or must be completed before progress can continue. Place them on the chart beneath the date or time when they occur.
  • 29.
     It helpsin planning and monitoring the work of project  Time is explicitly expressed in the chart  All tasks are visibly at a glance in relation to other  Deadlines are depicted in the chart.
  • 30.
     Gantt charts,because of their success, form the most easy to use and the most widely used scheduling tools. But these charts are also accompanied with some limitation  In such charts, it is very necessary to keep on updating the charts, in order to keep it in current form.  The charts is not able to directly reveal the costs of the alternate loadings.
  • 31.
     These chartsalso do not consider the varying processing times among work centers.  Other limitations include the inability to include certain constraints like time, scope, and costs.
  • 32.
    i. Textbook ofnursing service and education, nisha clement, page num- 366-380. ii. Textbook of nursing administration, BT Basvanthappa, page num- 190 to 193. iii. Textbook of management of nursing services and education, PV Publication, page num- 416 to 419.