Downloaded 20 times
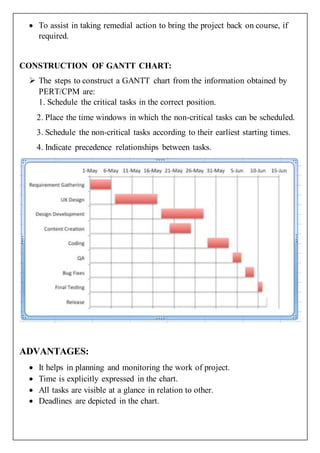
A Gantt chart is a bar chart that illustrates a project schedule and the phases and activities of a project work breakdown structure. It was introduced by Henry Gantt around 1910-1915. A Gantt chart shows the current schedule status, measures task duration in the project, and represents cost, time and scope. It is useful for planning, scheduling, and monitoring projects by laying out task order and allowing visualization of progress. The steps to construct a Gantt chart include scheduling critical and non-critical tasks based on precedence relationships and earliest start times.


