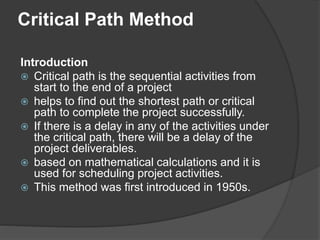
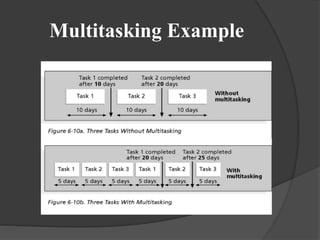
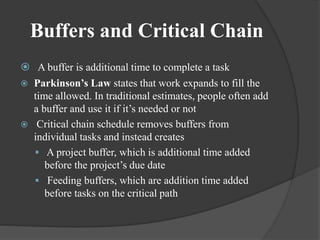
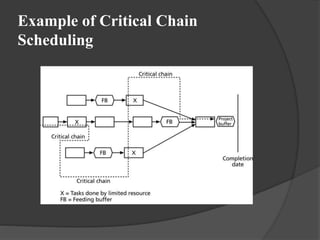
Table of contents
 Gantt charts
 Pert chart
 Critical path method
 Critical chain scheduling
 Reality Checks on Scheduling
 Words of Caution on Using Project
Management Software
Gantt chart
Introduction
 invented Henry Gantt in 1910. Since the invention, Gantt
chart has come a long way.
 A type of a bar chart used for illustrating project
schedules.
 can be used in any projects that involve effort, resources,
milestones and deliveries.
 Allow project managers to track the progress of the entire
project.
 Can keep a track of the individual tasks as well as of the
overall project progression.
 Can also be used for tracking the utilization of the
resources in the project. These resources can be human
resources as well as materials used.
The Use of Gantt chart
 for project management purposes
 First of all, the project should have a sufficiently
detailed Work Breakdown Structure (WBS).
 Secondly, the project should have identified its
milestones and deliveries.
 Gantt charts can be successfully used in projects of
any scale. When using Gantt charts for large
projects, there can be an increased complexity when
tracking the tasks.
 This problem of complexity can be successfully
overcome by using computer software packages
designed for offering Gantt chart functionalities.
Tools Available of Gantt
chart
 Dozens of Gantt chart tools can be used for successful
project tracking. These tools usually vary by the feature
offered.
 The simplest kind of Gantt chart can be created using a
software tool such as Microsoft Excel.
 If the project is small scale and does not involve many
parallel tasks, a spreadsheet based Gantt chart can be the
most effective type.
 Microsoft Project is one of the key Gantt chart tools used
today.
 There are many other Gantt chart tools available for free and
for price.
Program Evaluation and Review
Technique
 Introduction
 Before any activity begins related to the work of a
project, every project requires an advanced,
accurate time estimate. Without an accurate
estimate, no project can be completed within the
budget and the target completion date.
 Developing an estimate is a complex task. If the
project is large and has many stakeholders, things
can be more complex.
 PERT (Program Evaluation and Review Technique)
is one of the successful and proven methods among
the many other techniques, such as, CPM, Function
Point Counting, Top-Down Estimating, WAVE, etc.
 PERT was created by the US Navy in the late 1950s.
The PERT Basics
 PERT is all about management probabilities. Therefore, PERT involves in
many simple statistical methods as well.
 Sometimes, people categorize and put PERT and CPM together. Although
CPM (Critical Path Method) shares some characteristics with PERT, PERT
has a different focus.
 Same as most of other estimation techniques, PERT also breaks down the
tasks into detailed activities.
 In this map, a node represents each event. The activities are represented
as arrows and they are drawn from one event to another, based on the
sequence.
The Three Chances of PERT
1. Optimistic Time Estimate (TOPT)
This is the fastest time an activity can be completed. For
this, the assumption is made that all the necessary
resources are available and all predecessor activities are
completed as planned.
2. Most Likely Time Estimate (TLIKELY),
Most of the times, project managers are asked only to
submit one estimate. In that case, this is the estimate that
goes to the upper management.
3. Pessimistic Time Estimate (TPESS)
This is the maximum time required to complete an activity.
In this case, it is assumed that many things go wrong
related to the activity. A lot of rework and resource
unavailability are assumed when this estimation is derived.
The PERT Mathematics
 BETA probability distribution is what
works behind PERT. The expected
completion time (E) is calculated as
below:
 E = (TOPT + 4 x TLIEKLY + TPESS) / 6
How to make PERT & CPM
 https://www.youtube.com/watch?v=LdR
ZN5o08eM
 https://www.youtube.com/watch?v=d6-
bb9oDsSA
 https://www.youtube.com/watch?v=Os1
XRKt8ABA
Critical Path Method
Introduction
 Critical path is the sequential activities from
start to the end of a project
 helps to find out the shortest path or critical
path to complete the project successfully.
 If there is a delay in any of the activities under
the critical path, there will be a delay of the
project deliverables.
 based on mathematical calculations and it is
used for scheduling project activities.
 This method was first introduced in 1950s.
Key Steps in Critical Path
Method
 Step 1: Activity specification
 Step 2: Activity sequence establishment
 Step 3: Network diagram
 Step 4: Estimates for each activity
 Step 5: Identification of the critical path
 Step 6: Critical path diagram to show project
progresses
Critical Chain Scheduling
(CCS)
 Critical chain scheduling is a method of
scheduling that takes limited resources into
account when creating a project schedule and
includes buffers to protect the project
completion date.
 Critical chain scheduling assumes resources do
not multitask because it often delays task
completions and increases total durations
Multitasking Example
Buffers and Critical Chain
 A buffer is additional time to complete a task
 Parkinson’s Law states that work expands to fill the
time allowed. In traditional estimates, people often add
a buffer and use it if it’s needed or not
 Critical chain schedule removes buffers from
individual tasks and instead creates
 A project buffer, which is additional time added
before the project’s due date
 Feeding buffers, which are addition time added
before tasks on the critical path
Example of Critical Chain
Scheduling
Reality Checks on Scheduling
 Should have realistic schedule goals
 Review the schedule
 Preparation of detailed schedule
 Seeking stakeholders’ approval
 Don’t plan for everyone to work at 100% capacity all
the time
 Alert top management well in advance if there are
schedule problems
 Involvement and commitment from all team members,
top management, the customer, and other key
stakeholders
 Progress meetings with stakeholders
Working With People Issues
 Strong leadership helps projects succeed more than
good PERT charts
 Project managers should use:
 Empowerment
 Incentives
 Discipline
 Negotiation
Using Software to Assist in Time
Management
 Software for facilitating communications helps people
exchange schedule-related information
 Decision support models help analyze trade-offs that
can be made
 Project management software can help in various time
management areas
Words of Caution on Using Project
Management Software
 Many people misuse project management software
because they don’t understand important concepts and
have not had good training
 You must enter dependencies to have dates adjust
automatically and to determine the critical path
 You must enter actual schedule information to compare
planned and actual progress
References
 http://www.tutorialspoint.com/software_engineering/software
_project_management.htm
 https://sites.google.com/a/gctstudents.com/home/technical-
paper/production-engineering/critical-path-analysis
 http://www.referenceforbusiness.com/management/Pr-
Sa/Program-Evaluation-and-Review-Technique-and-Critical-
Path-Method.html
 https://www.passionatepm.com/blog/critical-path-versus-
critical-chain-pmp-concept-17

PM scheduling techniques

  • 2.
    Table of contents Gantt charts  Pert chart  Critical path method  Critical chain scheduling  Reality Checks on Scheduling  Words of Caution on Using Project Management Software
  • 3.
    Gantt chart Introduction  inventedHenry Gantt in 1910. Since the invention, Gantt chart has come a long way.  A type of a bar chart used for illustrating project schedules.  can be used in any projects that involve effort, resources, milestones and deliveries.  Allow project managers to track the progress of the entire project.  Can keep a track of the individual tasks as well as of the overall project progression.  Can also be used for tracking the utilization of the resources in the project. These resources can be human resources as well as materials used.
  • 4.
    The Use ofGantt chart  for project management purposes  First of all, the project should have a sufficiently detailed Work Breakdown Structure (WBS).  Secondly, the project should have identified its milestones and deliveries.  Gantt charts can be successfully used in projects of any scale. When using Gantt charts for large projects, there can be an increased complexity when tracking the tasks.  This problem of complexity can be successfully overcome by using computer software packages designed for offering Gantt chart functionalities.
  • 5.
    Tools Available ofGantt chart  Dozens of Gantt chart tools can be used for successful project tracking. These tools usually vary by the feature offered.  The simplest kind of Gantt chart can be created using a software tool such as Microsoft Excel.  If the project is small scale and does not involve many parallel tasks, a spreadsheet based Gantt chart can be the most effective type.  Microsoft Project is one of the key Gantt chart tools used today.  There are many other Gantt chart tools available for free and for price.
  • 6.
    Program Evaluation andReview Technique  Introduction  Before any activity begins related to the work of a project, every project requires an advanced, accurate time estimate. Without an accurate estimate, no project can be completed within the budget and the target completion date.  Developing an estimate is a complex task. If the project is large and has many stakeholders, things can be more complex.  PERT (Program Evaluation and Review Technique) is one of the successful and proven methods among the many other techniques, such as, CPM, Function Point Counting, Top-Down Estimating, WAVE, etc.  PERT was created by the US Navy in the late 1950s.
  • 7.
    The PERT Basics PERT is all about management probabilities. Therefore, PERT involves in many simple statistical methods as well.  Sometimes, people categorize and put PERT and CPM together. Although CPM (Critical Path Method) shares some characteristics with PERT, PERT has a different focus.  Same as most of other estimation techniques, PERT also breaks down the tasks into detailed activities.  In this map, a node represents each event. The activities are represented as arrows and they are drawn from one event to another, based on the sequence.
  • 8.
    The Three Chancesof PERT 1. Optimistic Time Estimate (TOPT) This is the fastest time an activity can be completed. For this, the assumption is made that all the necessary resources are available and all predecessor activities are completed as planned. 2. Most Likely Time Estimate (TLIKELY), Most of the times, project managers are asked only to submit one estimate. In that case, this is the estimate that goes to the upper management. 3. Pessimistic Time Estimate (TPESS) This is the maximum time required to complete an activity. In this case, it is assumed that many things go wrong related to the activity. A lot of rework and resource unavailability are assumed when this estimation is derived.
  • 9.
    The PERT Mathematics BETA probability distribution is what works behind PERT. The expected completion time (E) is calculated as below:  E = (TOPT + 4 x TLIEKLY + TPESS) / 6
  • 10.
    How to makePERT & CPM  https://www.youtube.com/watch?v=LdR ZN5o08eM  https://www.youtube.com/watch?v=d6- bb9oDsSA  https://www.youtube.com/watch?v=Os1 XRKt8ABA
  • 11.
    Critical Path Method Introduction Critical path is the sequential activities from start to the end of a project  helps to find out the shortest path or critical path to complete the project successfully.  If there is a delay in any of the activities under the critical path, there will be a delay of the project deliverables.  based on mathematical calculations and it is used for scheduling project activities.  This method was first introduced in 1950s.
  • 12.
    Key Steps inCritical Path Method  Step 1: Activity specification  Step 2: Activity sequence establishment  Step 3: Network diagram  Step 4: Estimates for each activity  Step 5: Identification of the critical path  Step 6: Critical path diagram to show project progresses
  • 13.
    Critical Chain Scheduling (CCS) Critical chain scheduling is a method of scheduling that takes limited resources into account when creating a project schedule and includes buffers to protect the project completion date.  Critical chain scheduling assumes resources do not multitask because it often delays task completions and increases total durations
  • 14.
  • 15.
    Buffers and CriticalChain  A buffer is additional time to complete a task  Parkinson’s Law states that work expands to fill the time allowed. In traditional estimates, people often add a buffer and use it if it’s needed or not  Critical chain schedule removes buffers from individual tasks and instead creates  A project buffer, which is additional time added before the project’s due date  Feeding buffers, which are addition time added before tasks on the critical path
  • 16.
    Example of CriticalChain Scheduling
  • 17.
    Reality Checks onScheduling  Should have realistic schedule goals  Review the schedule  Preparation of detailed schedule  Seeking stakeholders’ approval  Don’t plan for everyone to work at 100% capacity all the time  Alert top management well in advance if there are schedule problems  Involvement and commitment from all team members, top management, the customer, and other key stakeholders  Progress meetings with stakeholders
  • 18.
    Working With PeopleIssues  Strong leadership helps projects succeed more than good PERT charts  Project managers should use:  Empowerment  Incentives  Discipline  Negotiation
  • 19.
    Using Software toAssist in Time Management  Software for facilitating communications helps people exchange schedule-related information  Decision support models help analyze trade-offs that can be made  Project management software can help in various time management areas
  • 20.
    Words of Cautionon Using Project Management Software  Many people misuse project management software because they don’t understand important concepts and have not had good training  You must enter dependencies to have dates adjust automatically and to determine the critical path  You must enter actual schedule information to compare planned and actual progress
  • 21.
    References  http://www.tutorialspoint.com/software_engineering/software _project_management.htm  https://sites.google.com/a/gctstudents.com/home/technical- paper/production-engineering/critical-path-analysis http://www.referenceforbusiness.com/management/Pr- Sa/Program-Evaluation-and-Review-Technique-and-Critical- Path-Method.html  https://www.passionatepm.com/blog/critical-path-versus- critical-chain-pmp-concept-17