Downloaded 636 times
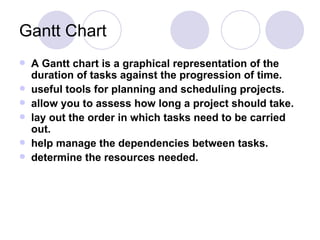
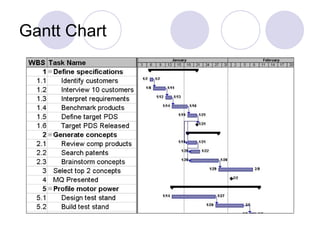
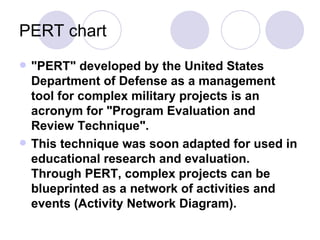
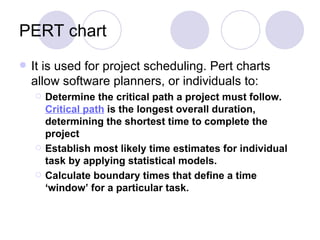
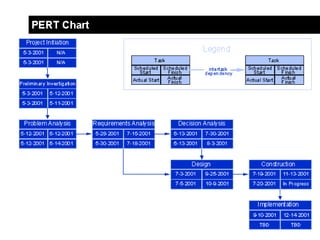
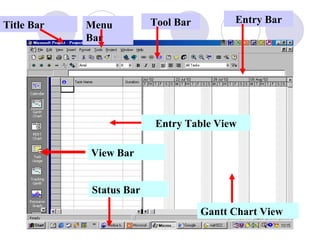
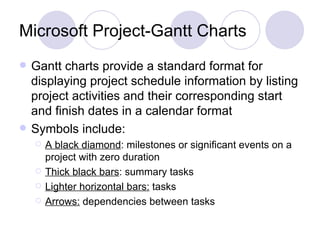
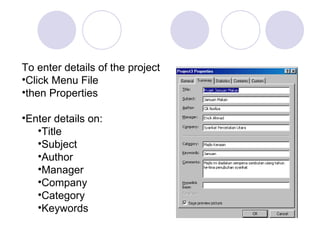
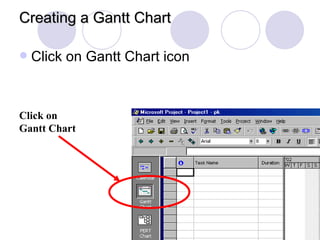
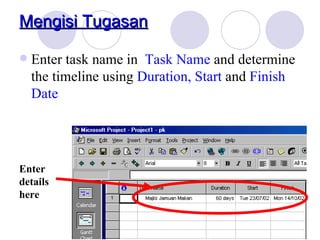
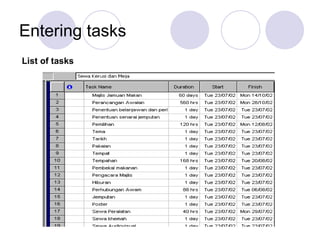
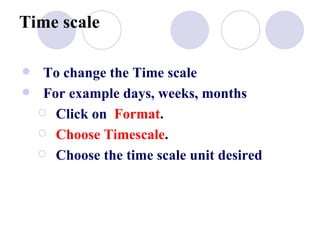
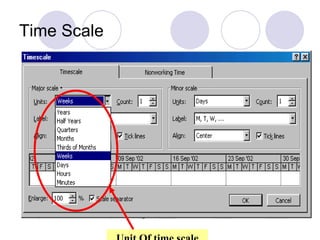
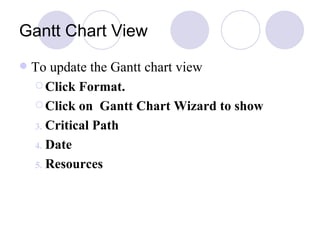
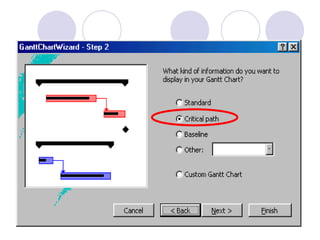
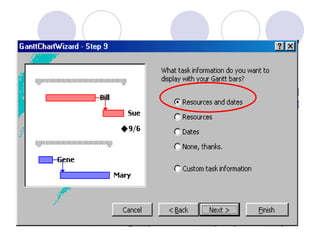
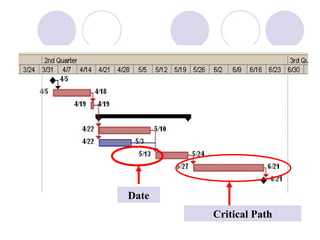
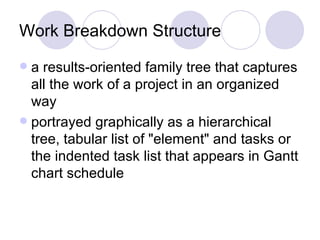
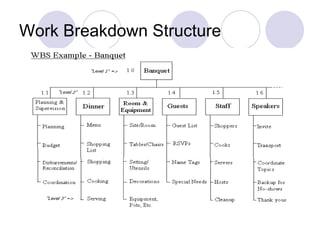
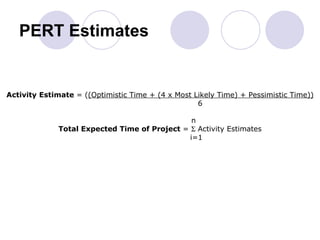
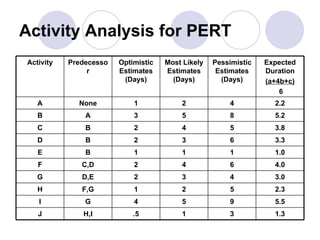
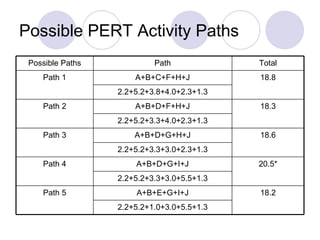

- The document discusses various charts used for project management including Gantt charts, PERT charts, and work breakdown structures. - Gantt charts show the duration of tasks visually on a timeline and are useful for planning, scheduling, and monitoring project progress. PERT charts model the dependencies between tasks through network diagrams. - Microsoft Project is a project management software that allows creating and editing Gantt charts, PERT charts, work breakdown structures, and performing tasks like determining critical paths.


![Bab7 pengembangan perniagaan[1]](https://cdn.slidesharecdn.com/ss_thumbnails/bab7-pengembanganperniagaan1-120106022348-phpapp01-thumbnail.jpg?width=640&height=640&fit=bounds)


