Download to read offline


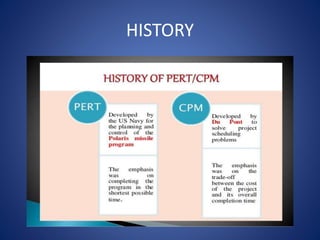


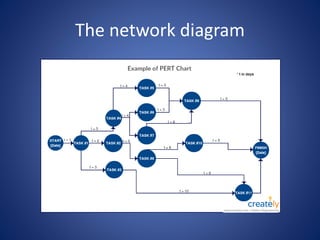
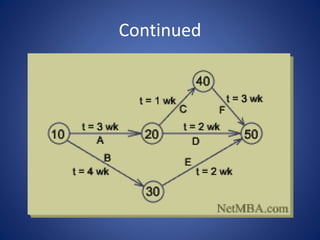
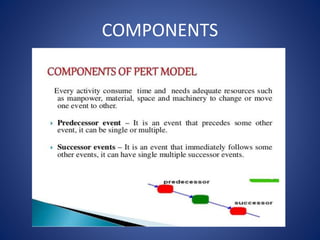


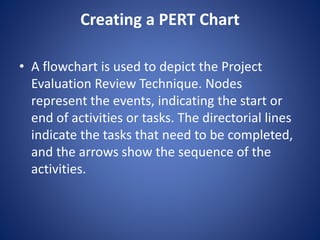


The document discusses the Project Evaluation Review Technique (PERT), a project management tool used to estimate the time required to complete tasks and manage project scheduling. It outlines the history, components, and steps involved in creating a PERT chart, as well as its advantages, disadvantages, and limitations. The content emphasizes the importance of PERT in project management, particularly in health care services, and concludes with references for further reading.