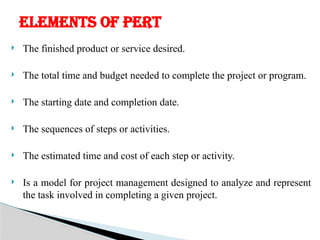
SEMINAR
ON
PERT
PRESENTED BY
MRS. TIKESHWARI SAHU
PERT is a method of analyzing the tasks involved in completing a given project,
especially the time needed to complete each task, and to identify the minimum
time needed to complete the total project. PERT was developed primarily to
simplify the planning and scheduling of large and complex projects.
 The program evaluation & review technique (PERT) was developed by the
Special Projects Office of the U.S. Navy and applied to the planning &control of
the Polaris Weapon system in 1958. It worked then, it still works; and it has been
widely applied as a controlling process in business & industry.
 In project management, the Project Evaluation Review Technique, or PERT, is
used to identify the time it takes to finish a particular task or activity. It is a
system that helps in proper scheduling and coordination of all tasks throughout a
project. It also helps in keeping track of the progress, or lack thereof, of the
overall project. In the 1958, the Project Evaluation Review Technique was
developed by Booz Allen Hamilton, the US Navy to manage the Polaris
submarine missile program of their Special Projects Office.
INTRODUCTION
PERT is a work model devised to complete the project
work in time. It analyses the actual work time required
to complete a task.
OR
 "PERT is a network system model for planning and
control under uncertain conditions. It involves
identifying the key activities in a project, sequencing
the activities in a flow diagram, and assigning the
duration of each phase of the work."
DEFINITION
 A PERT chart is a graphical representation of the
activities of a project, showing the sequence that has to
be performed continuously.
 It has the critical path of tasks that has to be finished in
time.
 This chart helps to focus only the needed activity and
omit the unwanted ones , therefore it saves time, energy
and material.
PERT CHART
 PERT EVENT: A point that marks the start or completion of one or more
activities. It consumes no time and uses no resources. When it marks the
completion of one or more tasks, it is not “reached” (does not occur) until
all of the activities leading to that event have been completed.
 Predecessor event – It is an event that precedes some other event, it can be
single or multiple.
 Successor events – It is an event that immediately follows some other events, it
can have single multiple successor events.
TERMINOLOGIES OF PERT MODEL
 PERT ACTIVITY: The actual performance of a task which
consumes time and requires resources (such as labor, materials,
space, machinery). It can be understood as representing the
time, effort, and resources required to move from one event to
another. A PERT activity cannot be performed until the
predecessor event has occurred.
 Optimistic Time (O) – It is the minimum possible time
required to complete the task anticipating that every event has
occurred better than usually expected.
 Pessimistic Time (P) - This means the maximum possible
time required to complete the given task, expecting or
assuming everything goes wrong except the main catastrophes.
 Most likely Time (M) – The actual and the best time required
to complete the task assuming everything goes in a usual way.
 Float or slack time – it is the amount of time that can be
floated without causing delay in the total completion of the
work.
 Critical paths – it is the longest possible and the actual
total time required to complete the full task. It is otherwise
called as total calendar time.
 Critical total float activity – it is an activity that has total
float equal to zero. No float time is required in the critical
path.
 Lead time – this refers to the time taken by the
predecessor to complete the task. In this there is
sufficient time for the subsequent activities that can
follow the predecessor.
 Lag time – the earliest time taken by the successor
event to take place, which follows the specific PERT
activity .
 Expected time or the very best time (TH) – The accurate
or the actual time required to complete the task, it is the
most reliable and valid time estimated to complete a task.
It can be calculated using the following relation
TH = (O + 4M – P) ÷ 6
e.g. TH = ( 5min + 4X 10 min – 15 min) ÷ 6
= 5 min
 ACTIVITY ON ARROW (AOA):
 In the first variant the duration is denoted on
arrow connecting diagram nodes. Such
diagram type called AOA.
 ACTIVITY ON NODE (AON):
 In such diagram the information about the task
duration is denoted in the diagram node &
each task is represented in the form of
rectangle with definite set of fields.
TYPES:-
 Prediction of deliverables
 Planning resource requirement
 Controlling resource allocation
 Internal programme review
 Performance evaluation
 Uniform wide acceptance
 Reduction in cost
NEED OF PERT:-
 Saving time
 Determination of activities
 Elimination of risk in complex activities
 Flexibility
 Evaluation of alternatives
 Useful effective control
 Useful decision making
 Useful research work
CONTINUE…..
 The finished product or service desired.
 The total time and budget needed to complete the project or program.
 The starting date and completion date.
 The sequences of steps or activities.
 The estimated time and cost of each step or activity.
 Is a model for project management designed to analyze and represent
the task involved in completing a given project.
ELEMENTS OF PERT
PERT involves the following steps
 Specific activities and milestones.
 Sequence of the activities.
 Network diagram.
 Estimate the time.
 Critical path.
 Update the PERT chart.
STEPS IN THE PERT PLANNING PROCESS
IDENTIFY THE SPECIFIC ACTIVITIES AND MILESTONES
 Activities.
 Milestones.
 It is helpful to list the tasks in a table.
Determine the proper sequence of the activities
May be combined with the activity identification
step
oSince the activity sequence is evident for some
tasks.
Other tasks may require more analysis
oTo determine the exact order in which they must
be performed.
Construct a network diagram.
Activity sequence information
 A network diagram can be drawn showing the
sequence of the serial and parallel activities.
Each activity represents: A node in the network,
The arrows represent: The relation between activities.
Software packages simplify this task
 By automatically converting tabular activity
information into a network diagram.
Estimate the time required for each activity.
Weeks are a commonly used unit of time for activity
completion.
A distinguishing feature of PERT.
 Its ability to deal with uncertainty in activity
completion time.
Optimistic time(O)
 The shortest time in which the activity can be
completed.
 To specify optimistic time to be three standards
deviations from the mean.
Most likely time(M)
 The completion time having the highest
probability.
Pessimistic time (P)
 the maximum possible time required to accomplish a
task, assuming everything goes wrong (but excluding
major catastrophes).
PERT assumes a beta probability distribution for the time
estimates.
Estimated Time(TE)
 The best estimate of the time required to accomplish a
task, accounting for the fact that things don't always
proceed as normal.
TE = (O + 4M + P) ÷ 6
Determine the Critical Path
The critical path is
 Determined by adding the times for the activities
in each sequence.
 Determining the longest path in the project.
The critical path determines the total calendar time
required for the project.
If activities outside the critical path speed up or slow down
(within limits), the total project time does not change.
The amount of time that a non – critical path activity can
be delayed without the project is referred to as a slack time.
Critical Path is helpful to determine
 ES – Earliest Start time
 EF - Earliest Finish time
 LS – Latest Start time
 LF - Latest Finish time
The variance in the project completion time can be
calculated by summing the variances in the
completion times of the activities in the critical path.
The project can be accelerated by adding the
resources required to decrease the time for the
activities in the critical path.
Shortening of the project sometimes is referred to as
Project Crashing.
Update the PERT chart as the project progresses.
Make adjustments in the PERT chart as the project
progresses.
As the project unfolds, the estimated times can be replaced
with actual times.
In cases where
 There are delays,
 Additional resources may be needed to stay on schedule
 The PERT chart may be modified to reflect the new
situation.
 Expected project completion time.
 Probability of completion before a specified date.
 The critical path activities that directly impact the completion time.
 The activities that have stack time and that can lend resources to
critical path activities.
 Activity start and end dates.
 It helps maximize the use of resources
 It makes project planning more manageable
 It’s useful even if there is little or no previous schedule data
 It enables project managers to better estimate or determines a more
definite completion date
BENEFITS OF PERT
 The activity time estimates are somewhat subjective and depend
on judgment. In other cases, if the person or group performing
the activity estimates the time there may be bias in the estimate.
 Even if the activity times are well – estimated, PERT assumes a
beta distribution for these time estimates, but the actual
distribution may be different.
 Even if the beta distribution assumption holds, PERT assumes
that the probability distribution of the project completion time is
the same as the that of the critical path,
LIMITATIONS
 It encourages logical discipline in planning, scheduling
and control of project.
 It encourages more long range and detailed project
planning.
 It provides a standard method of documenting and
communicating project plans, schedules and time and
cost – performance.
ADVANTAGES OF PERT (MODERN AND PHILLPS )
 It identifies the most critical elements in the plan, thus
focusing management attention i.e. most constraining on
the schedule.
 It illustrate the effects technical procedural changes on
overall schedules.
OTHER ADVANTAGES
 It explicitly defines and makes visible dependencies
(precedence relationship) between the WBS elements.
 It facilitates identification of the critical path and
makes this visible.
 It facilitates identification of early start, late start and
slack for each activity.
 It provides for potentially reduced project duration due
to better understanding of dependencies leading to
improved overlapping of activities and tasking where
feasible.
 There can be potentially hundreds or thousands of
activities and individual dependency relationship.
 The network charts tend to be large and unwieldy
requiring several pages to print and requiring special
size paper.
DISADVANTAGES
 The lack of a timeframe on most PERT/CPM (Critical
path method) charts makes it harder to show status
although colors can help( e.g. specific color for
completed nodes)
 When the PERT/CPM ( Critical path method) charts
become unwieldy, they are no longer used to manage
the project.
 PERT is intended for very large-scale, one-time, non-
routine, complex projects with a high degree of inter-
task dependency, projects which require a series of
activities, some of which must be performed
sequentially and others that can be performed in
parallel with other activities.
 Used in research and development projects
 For developing, tooling and introducing a new project
 To plan and execute the acquisition of various training
programmes
 For management development and organizational
planning
APPLICATION OF PERT
•Nurse administrators can use this model
to delegate and assign the work schedule
to the nurses in a hospital.
•It not only evidences the cost
effectiveness of nursing care but also has
great impact on reducing the expenditure
by the patient.
•This model helps to reduce the patient’s
hospital stay by judging beforehand the
actual care time, manpower, money and
the material required.
•Therefore, following this model helps to
prevent waste of time, money and
material, benefiting the patient and the
hospital management.
EXAMPLE TO PERFORM AN OPERATION FOR A PATIENT:
Prepare patient
Anaesthesia
given
Instrument
trolley prepared
PERT ACTIVITY
ANALYSIS
operation
performed
SUMMARY
PERT.pptx pert is a model devised to complete the under the content.

PERT.pptx pert is a model devised to complete the under the content.

  • 1.
  • 2.
    PERT is amethod of analyzing the tasks involved in completing a given project, especially the time needed to complete each task, and to identify the minimum time needed to complete the total project. PERT was developed primarily to simplify the planning and scheduling of large and complex projects.  The program evaluation & review technique (PERT) was developed by the Special Projects Office of the U.S. Navy and applied to the planning &control of the Polaris Weapon system in 1958. It worked then, it still works; and it has been widely applied as a controlling process in business & industry.  In project management, the Project Evaluation Review Technique, or PERT, is used to identify the time it takes to finish a particular task or activity. It is a system that helps in proper scheduling and coordination of all tasks throughout a project. It also helps in keeping track of the progress, or lack thereof, of the overall project. In the 1958, the Project Evaluation Review Technique was developed by Booz Allen Hamilton, the US Navy to manage the Polaris submarine missile program of their Special Projects Office. INTRODUCTION
  • 3.
    PERT is awork model devised to complete the project work in time. It analyses the actual work time required to complete a task. OR  "PERT is a network system model for planning and control under uncertain conditions. It involves identifying the key activities in a project, sequencing the activities in a flow diagram, and assigning the duration of each phase of the work." DEFINITION
  • 4.
     A PERTchart is a graphical representation of the activities of a project, showing the sequence that has to be performed continuously.  It has the critical path of tasks that has to be finished in time.  This chart helps to focus only the needed activity and omit the unwanted ones , therefore it saves time, energy and material. PERT CHART
  • 7.
     PERT EVENT:A point that marks the start or completion of one or more activities. It consumes no time and uses no resources. When it marks the completion of one or more tasks, it is not “reached” (does not occur) until all of the activities leading to that event have been completed.  Predecessor event – It is an event that precedes some other event, it can be single or multiple.  Successor events – It is an event that immediately follows some other events, it can have single multiple successor events. TERMINOLOGIES OF PERT MODEL
  • 8.
     PERT ACTIVITY:The actual performance of a task which consumes time and requires resources (such as labor, materials, space, machinery). It can be understood as representing the time, effort, and resources required to move from one event to another. A PERT activity cannot be performed until the predecessor event has occurred.  Optimistic Time (O) – It is the minimum possible time required to complete the task anticipating that every event has occurred better than usually expected.  Pessimistic Time (P) - This means the maximum possible time required to complete the given task, expecting or assuming everything goes wrong except the main catastrophes.  Most likely Time (M) – The actual and the best time required to complete the task assuming everything goes in a usual way.
  • 9.
     Float orslack time – it is the amount of time that can be floated without causing delay in the total completion of the work.  Critical paths – it is the longest possible and the actual total time required to complete the full task. It is otherwise called as total calendar time.  Critical total float activity – it is an activity that has total float equal to zero. No float time is required in the critical path.
  • 10.
     Lead time– this refers to the time taken by the predecessor to complete the task. In this there is sufficient time for the subsequent activities that can follow the predecessor.  Lag time – the earliest time taken by the successor event to take place, which follows the specific PERT activity .
  • 11.
     Expected timeor the very best time (TH) – The accurate or the actual time required to complete the task, it is the most reliable and valid time estimated to complete a task. It can be calculated using the following relation TH = (O + 4M – P) ÷ 6 e.g. TH = ( 5min + 4X 10 min – 15 min) ÷ 6 = 5 min
  • 12.
     ACTIVITY ONARROW (AOA):  In the first variant the duration is denoted on arrow connecting diagram nodes. Such diagram type called AOA.  ACTIVITY ON NODE (AON):  In such diagram the information about the task duration is denoted in the diagram node & each task is represented in the form of rectangle with definite set of fields. TYPES:-
  • 13.
     Prediction ofdeliverables  Planning resource requirement  Controlling resource allocation  Internal programme review  Performance evaluation  Uniform wide acceptance  Reduction in cost NEED OF PERT:-
  • 14.
     Saving time Determination of activities  Elimination of risk in complex activities  Flexibility  Evaluation of alternatives  Useful effective control  Useful decision making  Useful research work CONTINUE…..
  • 15.
     The finishedproduct or service desired.  The total time and budget needed to complete the project or program.  The starting date and completion date.  The sequences of steps or activities.  The estimated time and cost of each step or activity.  Is a model for project management designed to analyze and represent the task involved in completing a given project. ELEMENTS OF PERT
  • 16.
    PERT involves thefollowing steps  Specific activities and milestones.  Sequence of the activities.  Network diagram.  Estimate the time.  Critical path.  Update the PERT chart. STEPS IN THE PERT PLANNING PROCESS
  • 17.
    IDENTIFY THE SPECIFICACTIVITIES AND MILESTONES  Activities.  Milestones.  It is helpful to list the tasks in a table.
  • 18.
    Determine the propersequence of the activities May be combined with the activity identification step oSince the activity sequence is evident for some tasks. Other tasks may require more analysis oTo determine the exact order in which they must be performed.
  • 19.
    Construct a networkdiagram. Activity sequence information  A network diagram can be drawn showing the sequence of the serial and parallel activities. Each activity represents: A node in the network, The arrows represent: The relation between activities. Software packages simplify this task  By automatically converting tabular activity information into a network diagram.
  • 20.
    Estimate the timerequired for each activity. Weeks are a commonly used unit of time for activity completion. A distinguishing feature of PERT.  Its ability to deal with uncertainty in activity completion time. Optimistic time(O)  The shortest time in which the activity can be completed.
  • 21.
     To specifyoptimistic time to be three standards deviations from the mean. Most likely time(M)  The completion time having the highest probability.
  • 22.
    Pessimistic time (P) the maximum possible time required to accomplish a task, assuming everything goes wrong (but excluding major catastrophes). PERT assumes a beta probability distribution for the time estimates. Estimated Time(TE)  The best estimate of the time required to accomplish a task, accounting for the fact that things don't always proceed as normal. TE = (O + 4M + P) ÷ 6
  • 23.
    Determine the CriticalPath The critical path is  Determined by adding the times for the activities in each sequence.  Determining the longest path in the project. The critical path determines the total calendar time required for the project.
  • 24.
    If activities outsidethe critical path speed up or slow down (within limits), the total project time does not change. The amount of time that a non – critical path activity can be delayed without the project is referred to as a slack time. Critical Path is helpful to determine  ES – Earliest Start time  EF - Earliest Finish time  LS – Latest Start time  LF - Latest Finish time
  • 25.
    The variance inthe project completion time can be calculated by summing the variances in the completion times of the activities in the critical path. The project can be accelerated by adding the resources required to decrease the time for the activities in the critical path. Shortening of the project sometimes is referred to as Project Crashing.
  • 26.
    Update the PERTchart as the project progresses. Make adjustments in the PERT chart as the project progresses. As the project unfolds, the estimated times can be replaced with actual times. In cases where  There are delays,  Additional resources may be needed to stay on schedule  The PERT chart may be modified to reflect the new situation.
  • 27.
     Expected projectcompletion time.  Probability of completion before a specified date.  The critical path activities that directly impact the completion time.  The activities that have stack time and that can lend resources to critical path activities.  Activity start and end dates.  It helps maximize the use of resources  It makes project planning more manageable  It’s useful even if there is little or no previous schedule data  It enables project managers to better estimate or determines a more definite completion date BENEFITS OF PERT
  • 28.
     The activitytime estimates are somewhat subjective and depend on judgment. In other cases, if the person or group performing the activity estimates the time there may be bias in the estimate.  Even if the activity times are well – estimated, PERT assumes a beta distribution for these time estimates, but the actual distribution may be different.  Even if the beta distribution assumption holds, PERT assumes that the probability distribution of the project completion time is the same as the that of the critical path, LIMITATIONS
  • 29.
     It encourageslogical discipline in planning, scheduling and control of project.  It encourages more long range and detailed project planning.  It provides a standard method of documenting and communicating project plans, schedules and time and cost – performance. ADVANTAGES OF PERT (MODERN AND PHILLPS )
  • 30.
     It identifiesthe most critical elements in the plan, thus focusing management attention i.e. most constraining on the schedule.  It illustrate the effects technical procedural changes on overall schedules. OTHER ADVANTAGES  It explicitly defines and makes visible dependencies (precedence relationship) between the WBS elements.
  • 31.
     It facilitatesidentification of the critical path and makes this visible.  It facilitates identification of early start, late start and slack for each activity.  It provides for potentially reduced project duration due to better understanding of dependencies leading to improved overlapping of activities and tasking where feasible.
  • 32.
     There canbe potentially hundreds or thousands of activities and individual dependency relationship.  The network charts tend to be large and unwieldy requiring several pages to print and requiring special size paper. DISADVANTAGES
  • 33.
     The lackof a timeframe on most PERT/CPM (Critical path method) charts makes it harder to show status although colors can help( e.g. specific color for completed nodes)  When the PERT/CPM ( Critical path method) charts become unwieldy, they are no longer used to manage the project.
  • 34.
     PERT isintended for very large-scale, one-time, non- routine, complex projects with a high degree of inter- task dependency, projects which require a series of activities, some of which must be performed sequentially and others that can be performed in parallel with other activities.  Used in research and development projects  For developing, tooling and introducing a new project  To plan and execute the acquisition of various training programmes  For management development and organizational planning APPLICATION OF PERT
  • 35.
    •Nurse administrators canuse this model to delegate and assign the work schedule to the nurses in a hospital. •It not only evidences the cost effectiveness of nursing care but also has great impact on reducing the expenditure by the patient. •This model helps to reduce the patient’s hospital stay by judging beforehand the actual care time, manpower, money and the material required. •Therefore, following this model helps to prevent waste of time, money and material, benefiting the patient and the hospital management.
  • 36.
    EXAMPLE TO PERFORMAN OPERATION FOR A PATIENT: Prepare patient Anaesthesia given Instrument trolley prepared PERT ACTIVITY ANALYSIS operation performed
  • 37.

Editor's Notes

  • #17 -1-The activities are the tasks required to complete a project. -2-The milestones are the events marking the beginning and the end of one or more activities. -3-It is helpful to list the tasks in a table that in later steps can be expanded to include information on sequence and duration.
  • #20 -1-Weeks are a commonly used unit of time for activity completion, any consistent unit of time can be used. -3-2-So that there is a approximately a 1% chance that the activity will be completed within the optimistic time. -4-Note that this time is different from the expected time.
  • #22 The implication being that the expected time is the average time the task would require if the task were repeated on a number of occasions over an extended period of time.