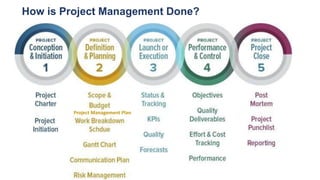
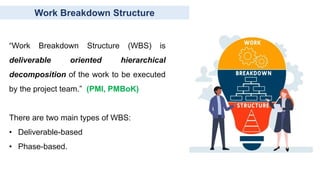
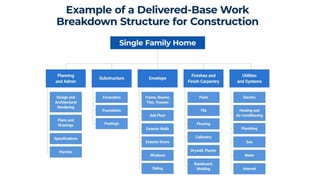
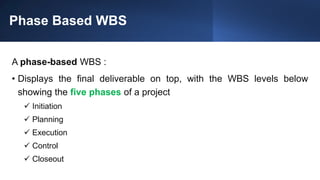
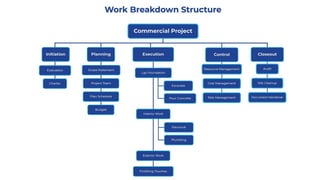
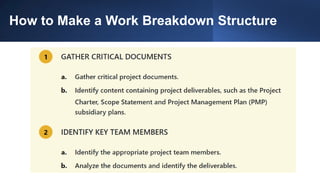
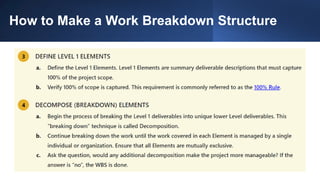
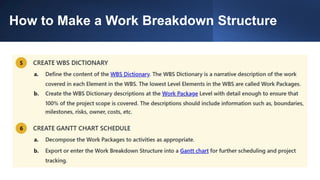
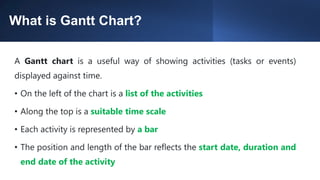
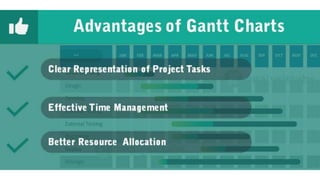
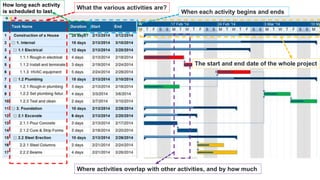
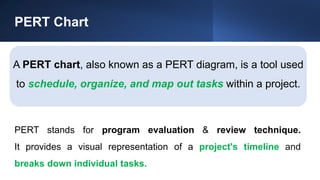
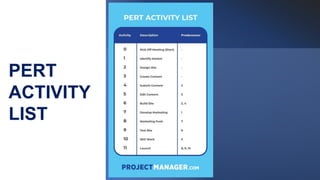
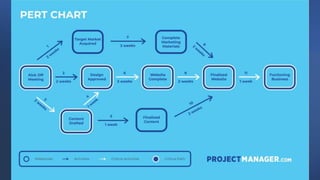
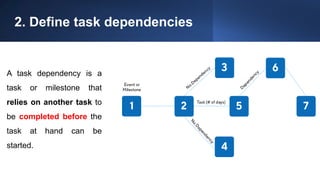
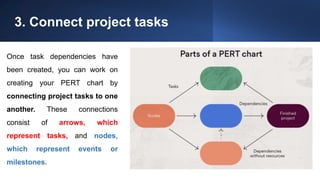
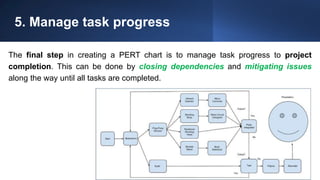
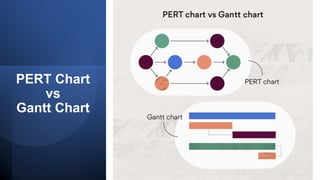
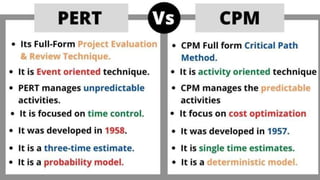
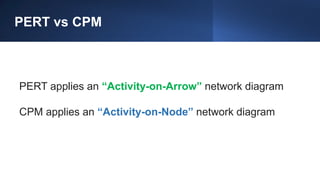
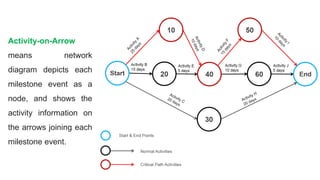
LECTURE BY DR MUHAMMAD ASIM
SYSTEMS ENGINEERING PROJECT MANAGEMENT
Previous
Lecture
• Project Management
 What is Project Management Plan?
 Why we need Project Management Plan?
 How is Project Management Plan made?
• Product Management
 Concept generation
 Steps involved
 Test product concept
Today’s
Lecture
 What is Work Breakdown Structure?
 What is Gantt Chart?
 What is PERT?
 What is CPM?
How is Project Management Done?
Project Management Plan
WORK BREAKDOWN STRUCTURE
Work Breakdown Structure
“Work Breakdown Structure (WBS) is
deliverable oriented hierarchical
decomposition of the work to be executed
by the project team.” (PMI, PMBoK)
There are two main types of WBS:
• Deliverable-based
• Phase-based.
Deliverable Based WBS
A deliverable-based WBS :
• First breaks down the project into all the major areas of the project
scope as control accounts
• Secondly, it divides those into project deliverables and work
packages.
Phase Based WBS
A phase-based WBS :
• Displays the final deliverable on top, with the WBS levels below
showing the five phases of a project
 Initiation
 Planning
 Execution
 Control
 Closeout
How to Make a Work Breakdown Structure
GANTT CHART
What is Gantt Chart?
A Gantt chart is a useful way of showing activities (tasks or events)
displayed against time.
• On the left of the chart is a list of the activities
• Along the top is a suitable time scale
• Each activity is represented by a bar
• The position and length of the bar reflects the start date, duration and
end date of the activity
What the various activities are?
When each activity begins and ends
How long each activity
is scheduled to last
Where activities overlap with other activities, and by how much
The start and end date of the whole project
PERT Chart
A PERT chart, also known as a PERT diagram, is a tool used
to schedule, organize, and map out tasks within a project.
PERT stands for program evaluation & review technique.
It provides a visual representation of a project's timeline and
breaks down individual tasks.
How to make
a PERT
chart?
PERT
ACTIVITY
LIST
1. Identify project tasks
The first step in creating a successful PERT chart involves identifying
and collecting necessary project information and tasks. This can
include:
• A business case
• A communication plan
• An initial kick-off meeting
2. Define task dependencies
A task dependency is a
task or milestone that
relies on another task to
be completed before the
task at hand can be
started.
3. Connect project tasks
Once task dependencies have
been created, you can work on
creating your PERT chart by
connecting project tasks to one
another. These connections
consist of arrows, which
represent tasks, and nodes,
which represent events or
milestones.
4. Estimate project time frame
Time estimates can be calculated based on the following:
• Optimistic time: The minimum amount of time needed to accomplish a task.
• Pessimistic time: The maximum amount of time needed to accomplish a task.
• Most likely time: The best estimate of how long it will likely take to accomplish a task.
The objective is to find the longest path that will take the most time to
complete in order to estimate the shortest overall project duration.
4. Estimate project time frame
We can use the PERT formula to calculate the expected duration of a task and completion
time using:
(O + (4 × M) + P) ÷ 6
This can be measured by minutes, hours, days, or even weeks.
For example,
If the optimistic time is 30 minutes,
the pessimistic time is 60 minutes,
and the most likely time is 45 minutes,
the PERT formula would be: (30min + (4 × 45min) + 60min) ÷ 6 = 45 minutes.
O= Optimistic
P= Pessimistic
M=Minutes
5. Manage task progress
The final step in creating a PERT chart is to manage task progress to project
completion. This can be done by closing dependencies and mitigating issues
along the way until all tasks are completed.
Glossary of Terms Related to PERT Charts
• Nodes: These are the symbols used to visualize milestones and project tasks.
They can be represented by circles or triangles.
• Arrows: Visual representation of the sequence of a task, diverging arrows
indicate tasks that can be completed at the same time. They can be solid or
dotted, depending on the nature of the sequence.
• PERT Event: The start or end of a task.
• Slack: The amount of time a task can be delayed without causing an overall
delay to the project or other tasks, also known as float.
Glossary of Terms Related to PERT Charts
• Critical Path: The critical path is the longest task sequence of a project. PERT charts
are used to determine the critical path of a project to estimate its duration.
• Critical Path Activity: An activity with no slack.
• Critical Path Method: The critical path method (CPM) is a project planning and
scheduling technique used to visualize task dependencies and estimate the duration of
projects.
• Lead Time: How much time you should complete a task or activity without impacting
the following ones.
Glossary of Terms Related to PERT Charts
• Lag Time: The earliest time in which a task can follow another.
• Fast Tracking: Fast tracking is a schedule compression technique that consists in
executing tasks or activities at the same time.
• Crashing Critical Path: Shortening the time of a task. This is the longest path from the
starting milestone to the finish. If you experience a delay on the critical path, it will
impact the entire project.
• Network Diagram: A type of diagram used for project management charts. The PERT
chart network diagram is known as an activity on arrow (AoA) network diagram.
• Predecessor: An activity that precedes another, and must finish before its successor
can start.
PERT Chart
vs
Gantt Chart
PERT vs CPM
PERT vs CPM
PERT applies an “Activity-on-Arrow” network diagram
CPM applies an “Activity-on-Node” network diagram
Activity-on-Arrow
means network
diagram depicts each
milestone event as a
node, and shows the
activity information on
the arrows joining each
milestone event.
Activity-on-Node
shows the activity
information as a node,
and links one activity to
the next, rather than
linking one milestone to
the next.
THANK YOU

9a. SEPM LECTURE # 06 - PERT (1).pptx

  • 1.
    LECTURE BY DRMUHAMMAD ASIM SYSTEMS ENGINEERING PROJECT MANAGEMENT
  • 2.
    Previous Lecture • Project Management What is Project Management Plan?  Why we need Project Management Plan?  How is Project Management Plan made? • Product Management  Concept generation  Steps involved  Test product concept
  • 3.
    Today’s Lecture  What isWork Breakdown Structure?  What is Gantt Chart?  What is PERT?  What is CPM?
  • 4.
    How is ProjectManagement Done? Project Management Plan
  • 5.
  • 6.
    Work Breakdown Structure “WorkBreakdown Structure (WBS) is deliverable oriented hierarchical decomposition of the work to be executed by the project team.” (PMI, PMBoK) There are two main types of WBS: • Deliverable-based • Phase-based.
  • 7.
    Deliverable Based WBS Adeliverable-based WBS : • First breaks down the project into all the major areas of the project scope as control accounts • Secondly, it divides those into project deliverables and work packages.
  • 9.
    Phase Based WBS Aphase-based WBS : • Displays the final deliverable on top, with the WBS levels below showing the five phases of a project  Initiation  Planning  Execution  Control  Closeout
  • 11.
    How to Makea Work Breakdown Structure
  • 12.
    How to Makea Work Breakdown Structure
  • 13.
    How to Makea Work Breakdown Structure
  • 14.
  • 15.
    What is GanttChart? A Gantt chart is a useful way of showing activities (tasks or events) displayed against time. • On the left of the chart is a list of the activities • Along the top is a suitable time scale • Each activity is represented by a bar • The position and length of the bar reflects the start date, duration and end date of the activity
  • 17.
    What the variousactivities are? When each activity begins and ends How long each activity is scheduled to last Where activities overlap with other activities, and by how much The start and end date of the whole project
  • 19.
    PERT Chart A PERTchart, also known as a PERT diagram, is a tool used to schedule, organize, and map out tasks within a project. PERT stands for program evaluation & review technique. It provides a visual representation of a project's timeline and breaks down individual tasks.
  • 20.
    How to make aPERT chart?
  • 21.
  • 23.
    1. Identify projecttasks The first step in creating a successful PERT chart involves identifying and collecting necessary project information and tasks. This can include: • A business case • A communication plan • An initial kick-off meeting
  • 24.
    2. Define taskdependencies A task dependency is a task or milestone that relies on another task to be completed before the task at hand can be started.
  • 25.
    3. Connect projecttasks Once task dependencies have been created, you can work on creating your PERT chart by connecting project tasks to one another. These connections consist of arrows, which represent tasks, and nodes, which represent events or milestones.
  • 26.
    4. Estimate projecttime frame Time estimates can be calculated based on the following: • Optimistic time: The minimum amount of time needed to accomplish a task. • Pessimistic time: The maximum amount of time needed to accomplish a task. • Most likely time: The best estimate of how long it will likely take to accomplish a task. The objective is to find the longest path that will take the most time to complete in order to estimate the shortest overall project duration.
  • 27.
    4. Estimate projecttime frame We can use the PERT formula to calculate the expected duration of a task and completion time using: (O + (4 × M) + P) ÷ 6 This can be measured by minutes, hours, days, or even weeks. For example, If the optimistic time is 30 minutes, the pessimistic time is 60 minutes, and the most likely time is 45 minutes, the PERT formula would be: (30min + (4 × 45min) + 60min) ÷ 6 = 45 minutes. O= Optimistic P= Pessimistic M=Minutes
  • 28.
    5. Manage taskprogress The final step in creating a PERT chart is to manage task progress to project completion. This can be done by closing dependencies and mitigating issues along the way until all tasks are completed.
  • 29.
    Glossary of TermsRelated to PERT Charts • Nodes: These are the symbols used to visualize milestones and project tasks. They can be represented by circles or triangles. • Arrows: Visual representation of the sequence of a task, diverging arrows indicate tasks that can be completed at the same time. They can be solid or dotted, depending on the nature of the sequence. • PERT Event: The start or end of a task. • Slack: The amount of time a task can be delayed without causing an overall delay to the project or other tasks, also known as float.
  • 30.
    Glossary of TermsRelated to PERT Charts • Critical Path: The critical path is the longest task sequence of a project. PERT charts are used to determine the critical path of a project to estimate its duration. • Critical Path Activity: An activity with no slack. • Critical Path Method: The critical path method (CPM) is a project planning and scheduling technique used to visualize task dependencies and estimate the duration of projects. • Lead Time: How much time you should complete a task or activity without impacting the following ones.
  • 31.
    Glossary of TermsRelated to PERT Charts • Lag Time: The earliest time in which a task can follow another. • Fast Tracking: Fast tracking is a schedule compression technique that consists in executing tasks or activities at the same time. • Crashing Critical Path: Shortening the time of a task. This is the longest path from the starting milestone to the finish. If you experience a delay on the critical path, it will impact the entire project. • Network Diagram: A type of diagram used for project management charts. The PERT chart network diagram is known as an activity on arrow (AoA) network diagram. • Predecessor: An activity that precedes another, and must finish before its successor can start.
  • 32.
  • 33.
  • 34.
    PERT vs CPM PERTapplies an “Activity-on-Arrow” network diagram CPM applies an “Activity-on-Node” network diagram
  • 35.
    Activity-on-Arrow means network diagram depictseach milestone event as a node, and shows the activity information on the arrows joining each milestone event.
  • 36.
    Activity-on-Node shows the activity informationas a node, and links one activity to the next, rather than linking one milestone to the next.
  • 37.