Downloaded 127 times
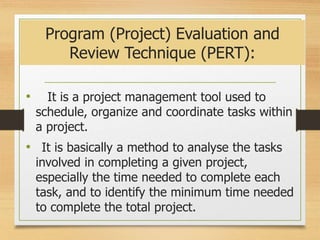


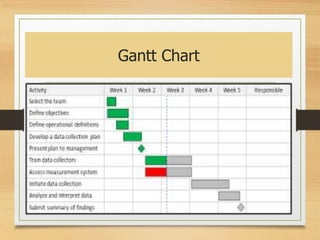
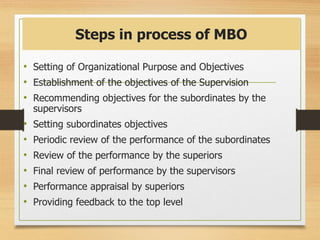
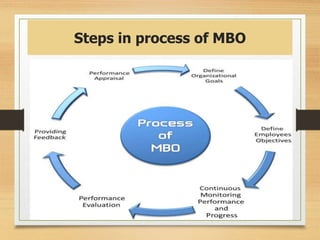


This document discusses Project Evaluation and Review Technique (PERT), Gantt charts, and Management by Objectives (MBO). PERT is a project management tool used to schedule tasks, analyze time needed to complete tasks, and identify the minimum time to complete a project. Gantt charts are graphical representations of project schedules that show tasks, resources, and timelines. MBO is a comprehensive management system that integrates key activities to effectively achieve organizational objectives through goal-setting and periodic performance reviews.


