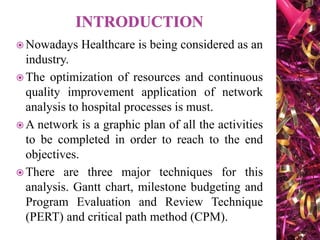
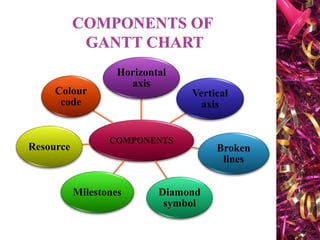
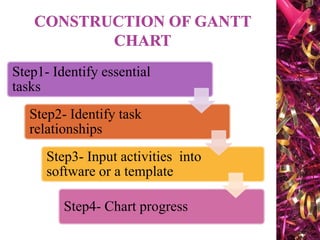
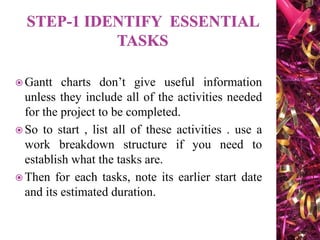
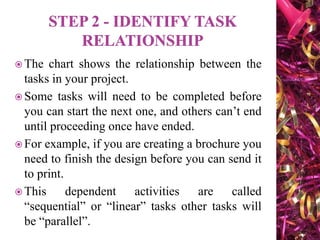
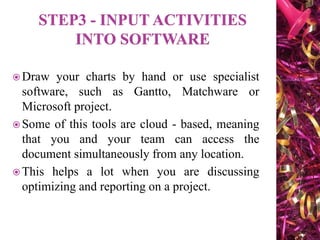
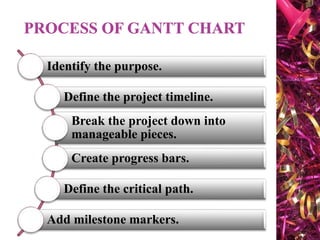
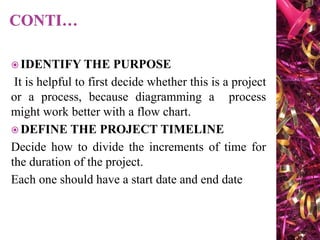
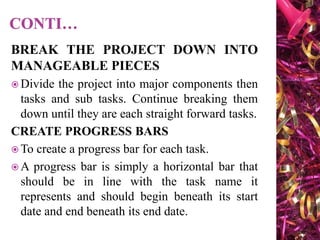
The document discusses Gantt charts and their use for project planning and scheduling. It defines what a Gantt chart is and its key components such as the horizontal and vertical axis, broken lines, diamond symbols, and milestones. It also outlines the steps to create a basic Gantt chart which includes identifying essential tasks, task relationships, inputting activities into software, and charting progress. Limitations of Gantt charts are that they cannot display more than 30 activities easily and are only valuable for short projects.


![CTEV [ clubfoot] DR ARUN LAL ,DR MOHAMED ASHRAF travancore medical college k...](https://cdn.slidesharecdn.com/ss_thumbnails/ctevclubfootdrarunlaldrmohamedashraftravancoremedicalcollegekollamkeralaindia-260208063247-18fc466c-thumbnail.jpg?width=640&height=640&fit=bounds)


![ONFH[AVN HIP] -TRIPLE REGIME -A NOVAL SURGICAL CONCEPT .pptx](https://cdn.slidesharecdn.com/ss_thumbnails/onfhavnhip2026koaconcalicutdrgokuldevdrmashraf-260210064517-213ec005-thumbnail.jpg?width=640&height=640&fit=bounds)


