Download to read offline


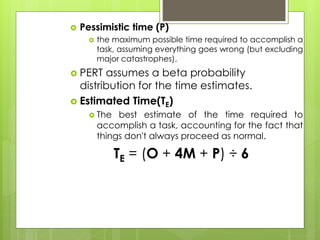
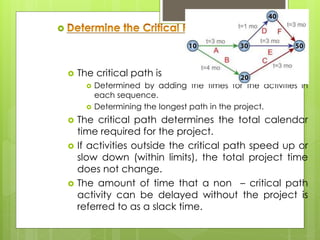


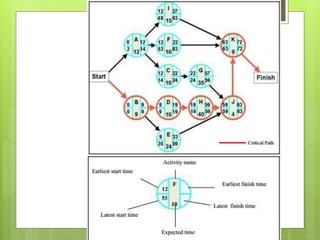


This document discusses Program Evaluation and Review Technique (PERT), a method used to analyze and represent the tasks involved in complex projects. PERT was developed by the US Navy in the 1950s to manage large-scale projects. It involves identifying activities, estimating activity times, sequencing activities, and determining the critical path. The critical path identifies the longest sequence of activities to complete the project. PERT helps schedule projects and identify slack time to reduce time and costs for complex, non-routine projects.


