Downloaded 183 times


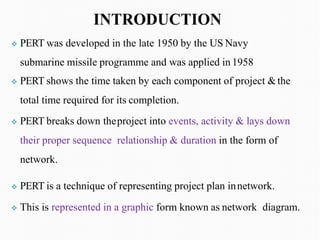
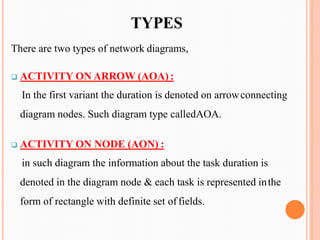


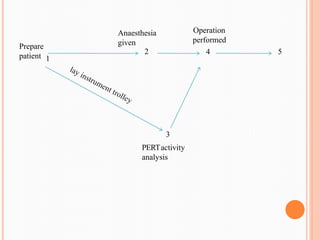


PERT (Program/Project Evaluation and Review Technique) is a statistical tool used in project management to analyze and represent tasks involved in completing a project. It breaks a project into activities with durations, sequences them, and represents them in a network diagram. The critical path is determined by identifying the longest sequence of activities. PERT was developed by the US Navy in the 1950s to manage complex projects and illustrate uncertainty in activity times. It is useful for planning, scheduling, resource allocation, risk analysis, and performance evaluation of projects.


