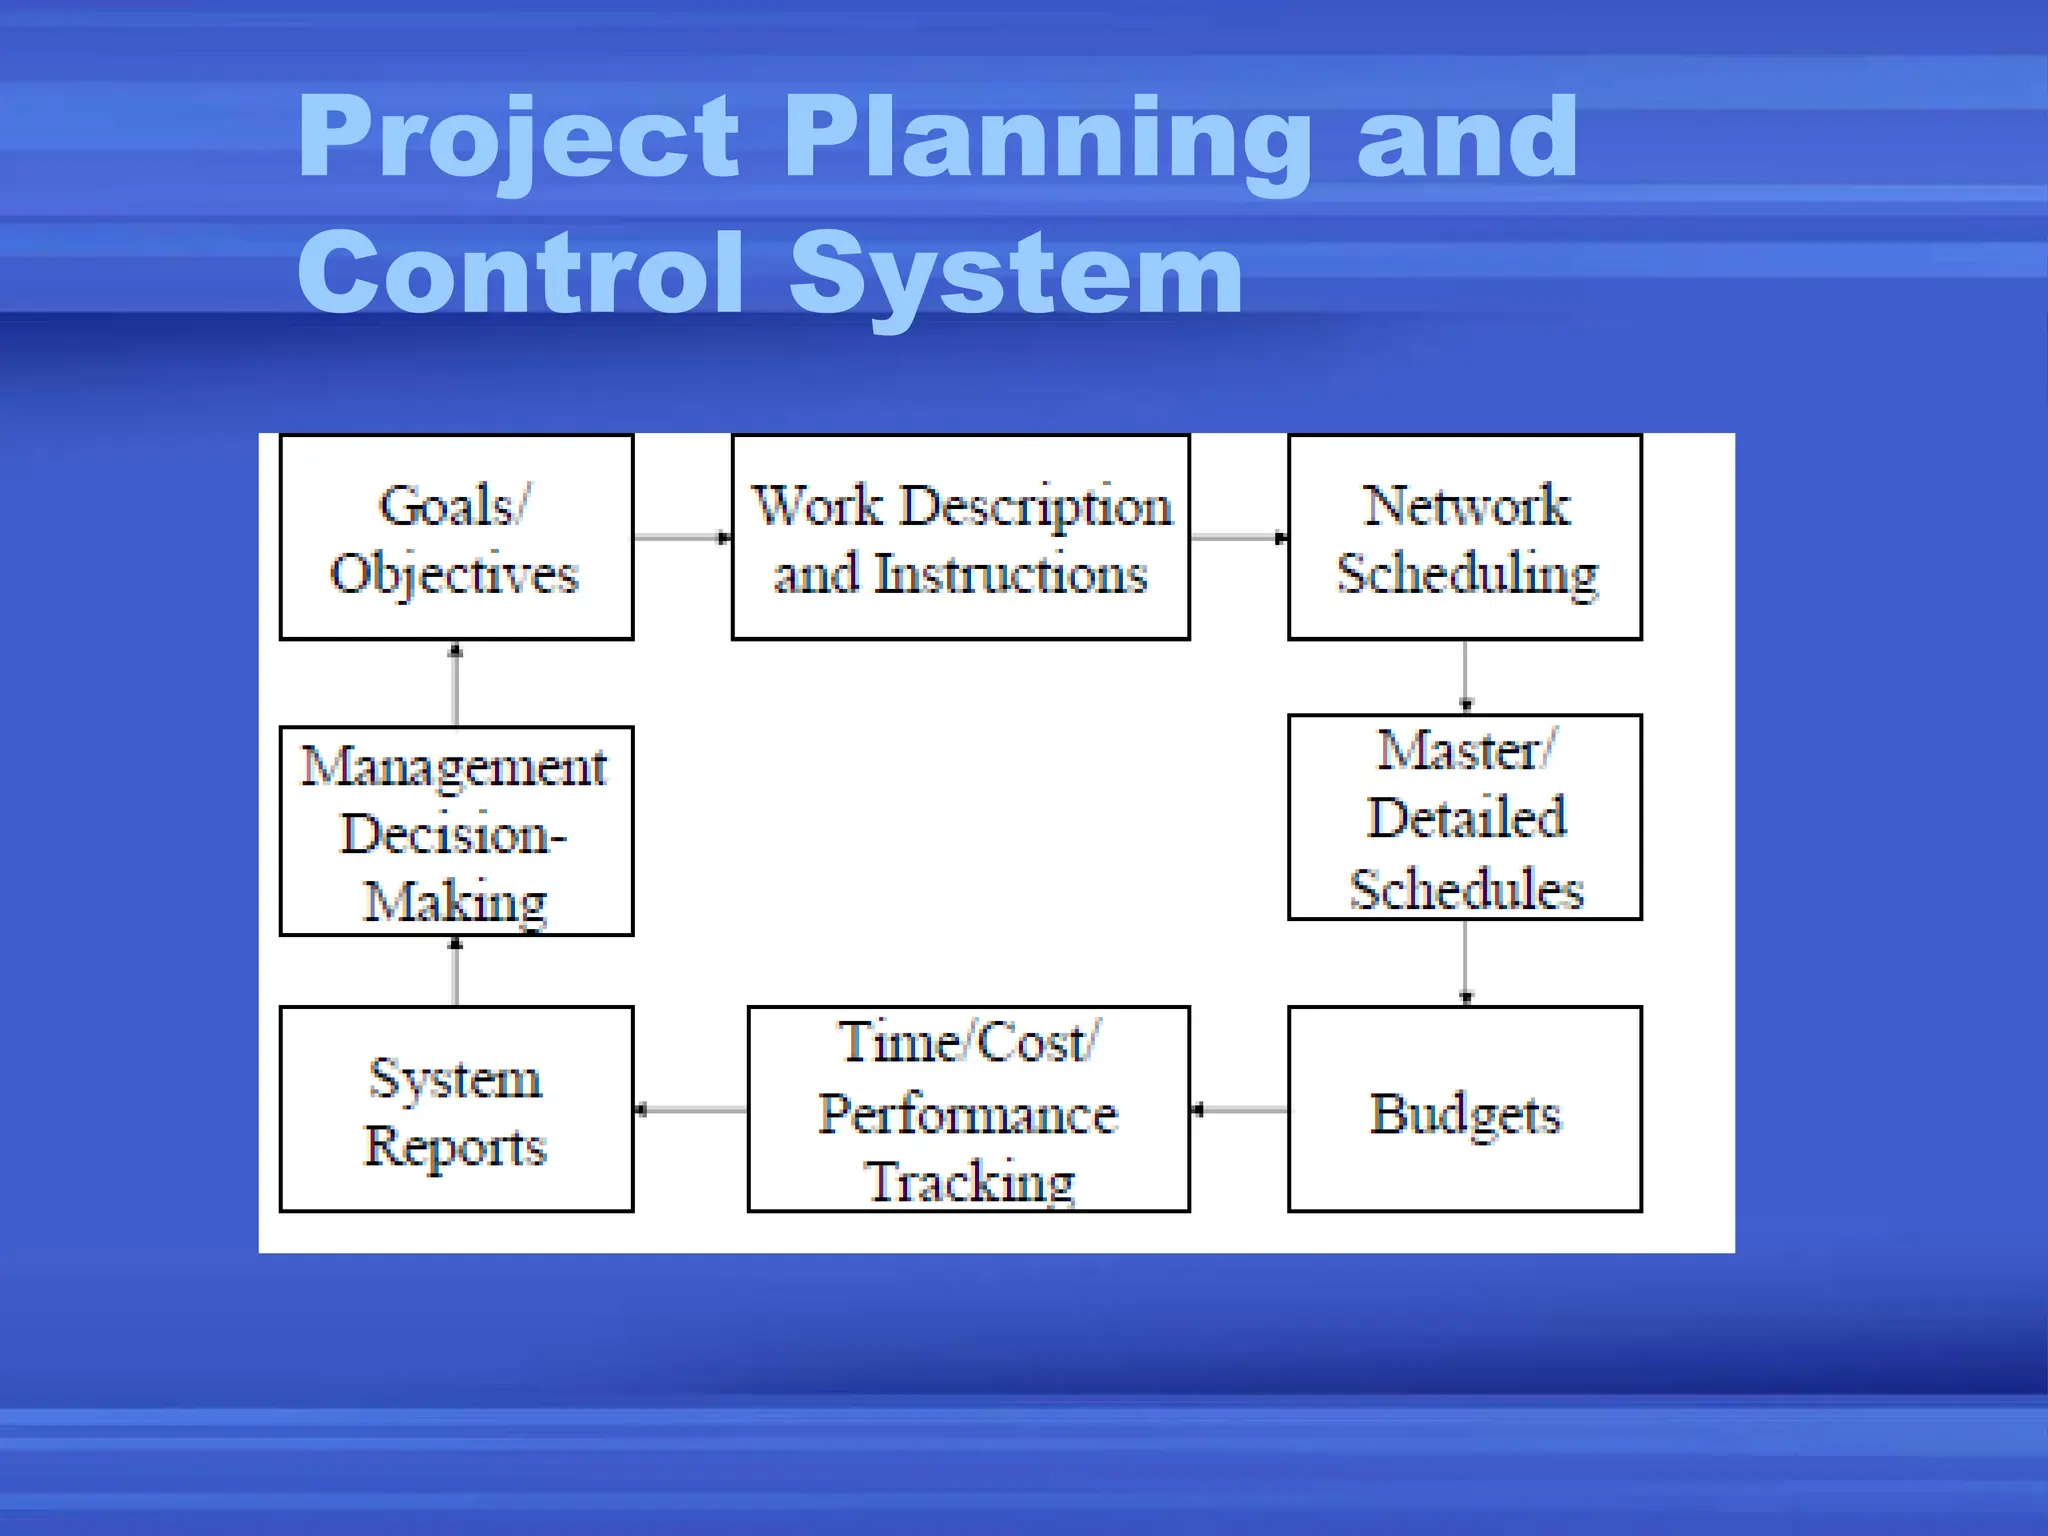
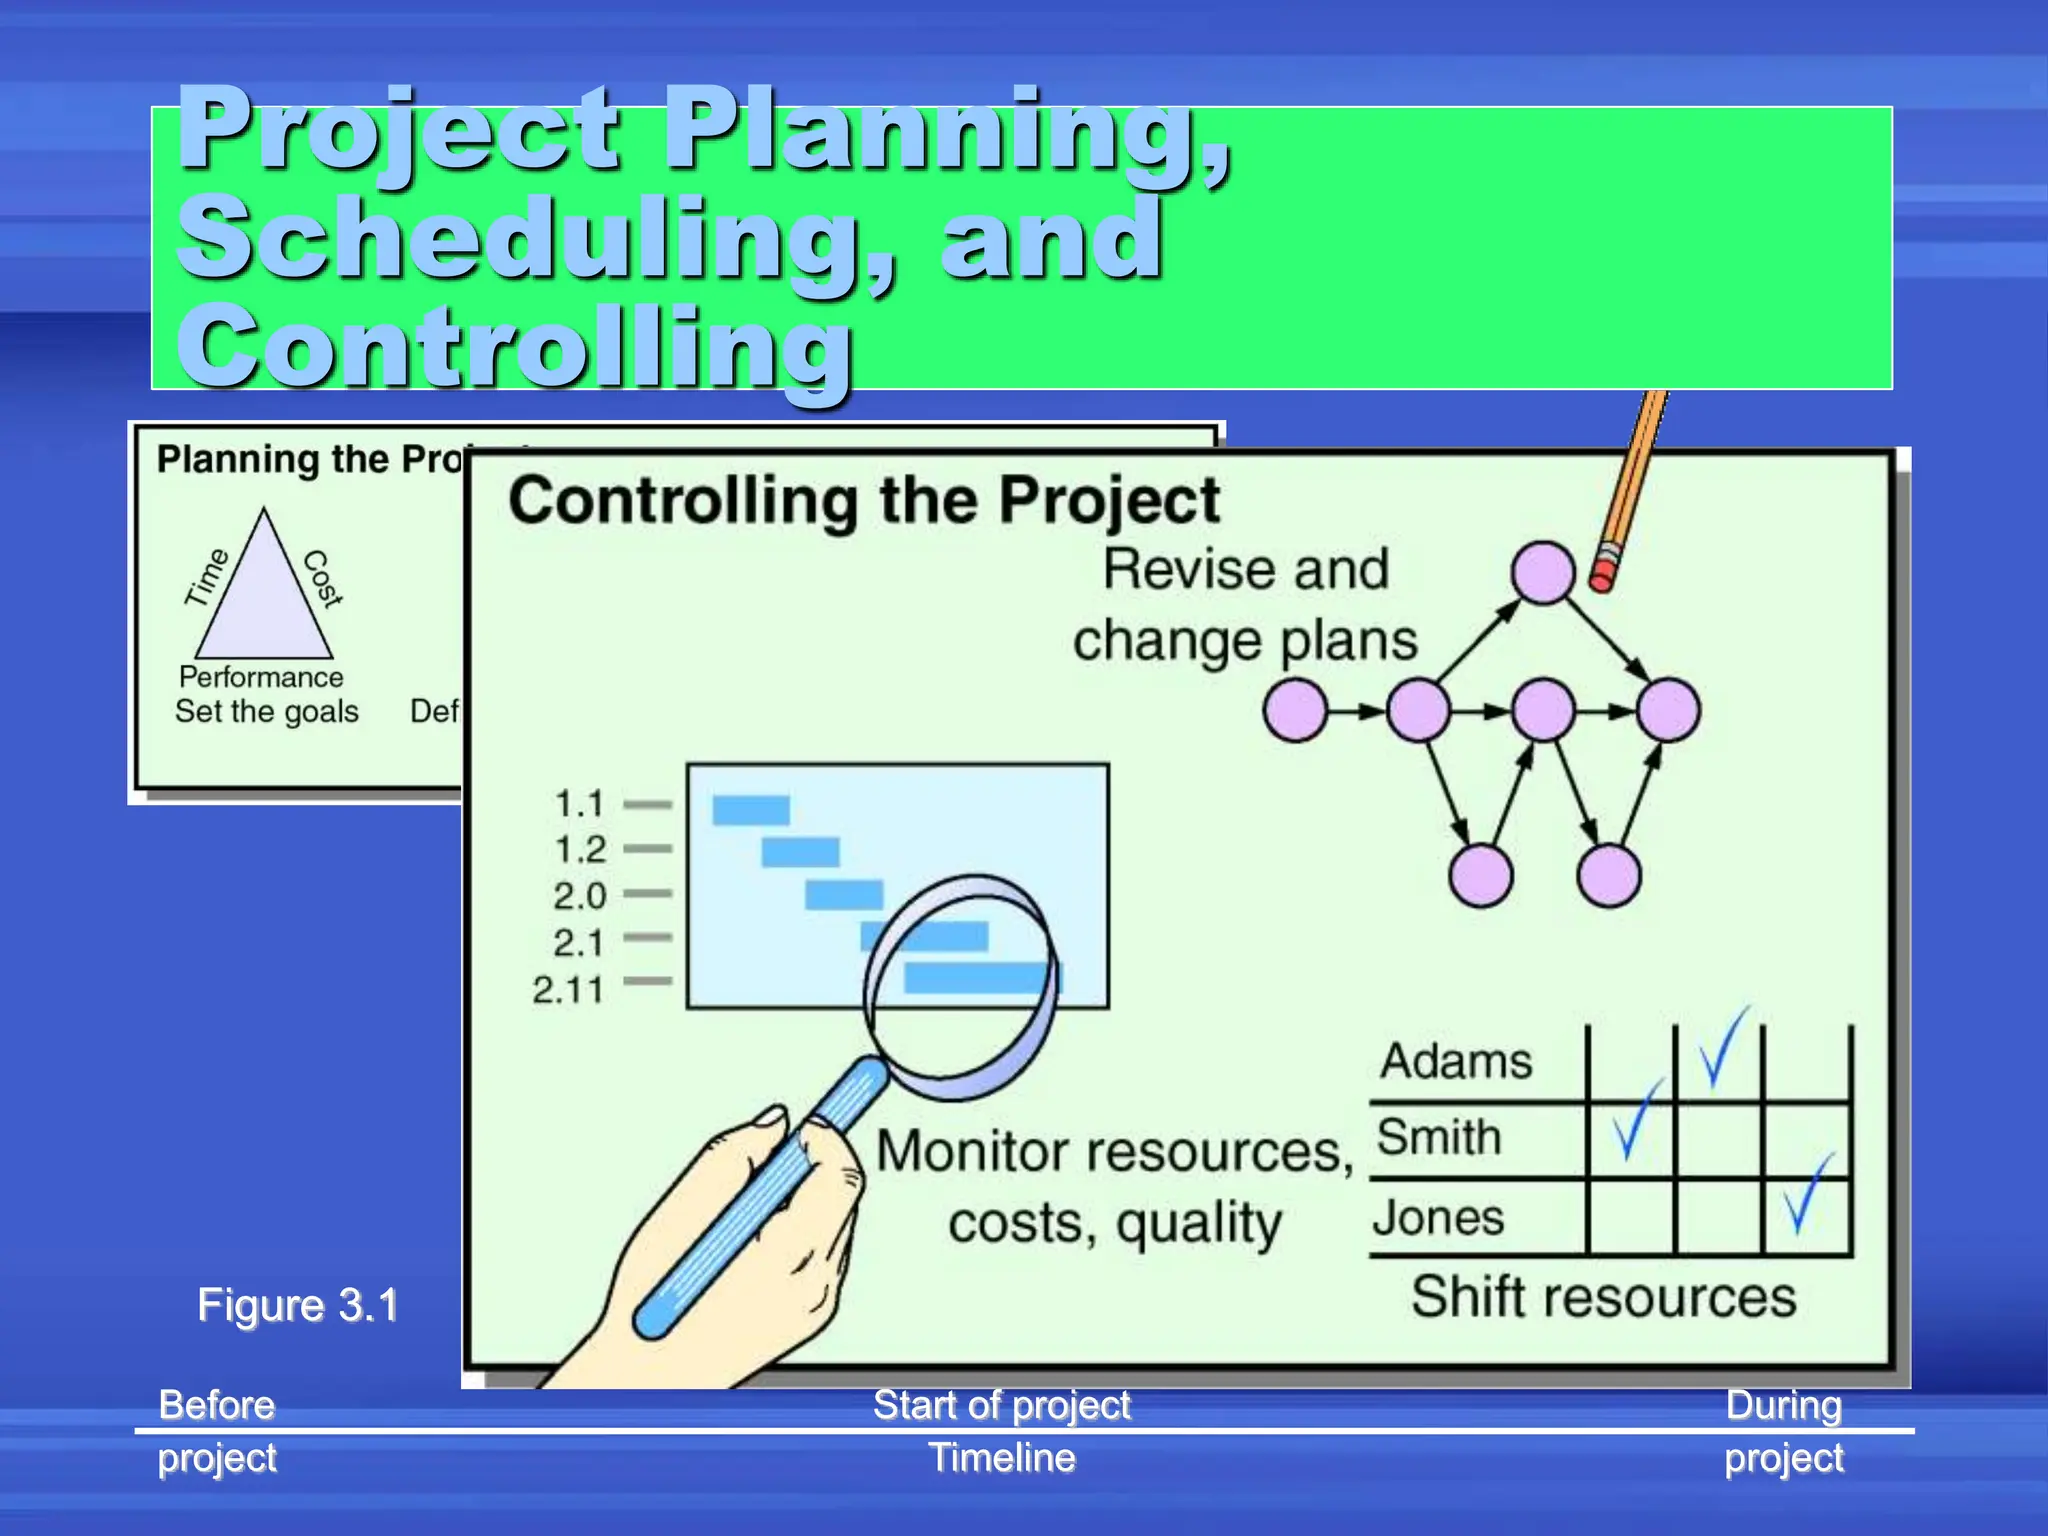
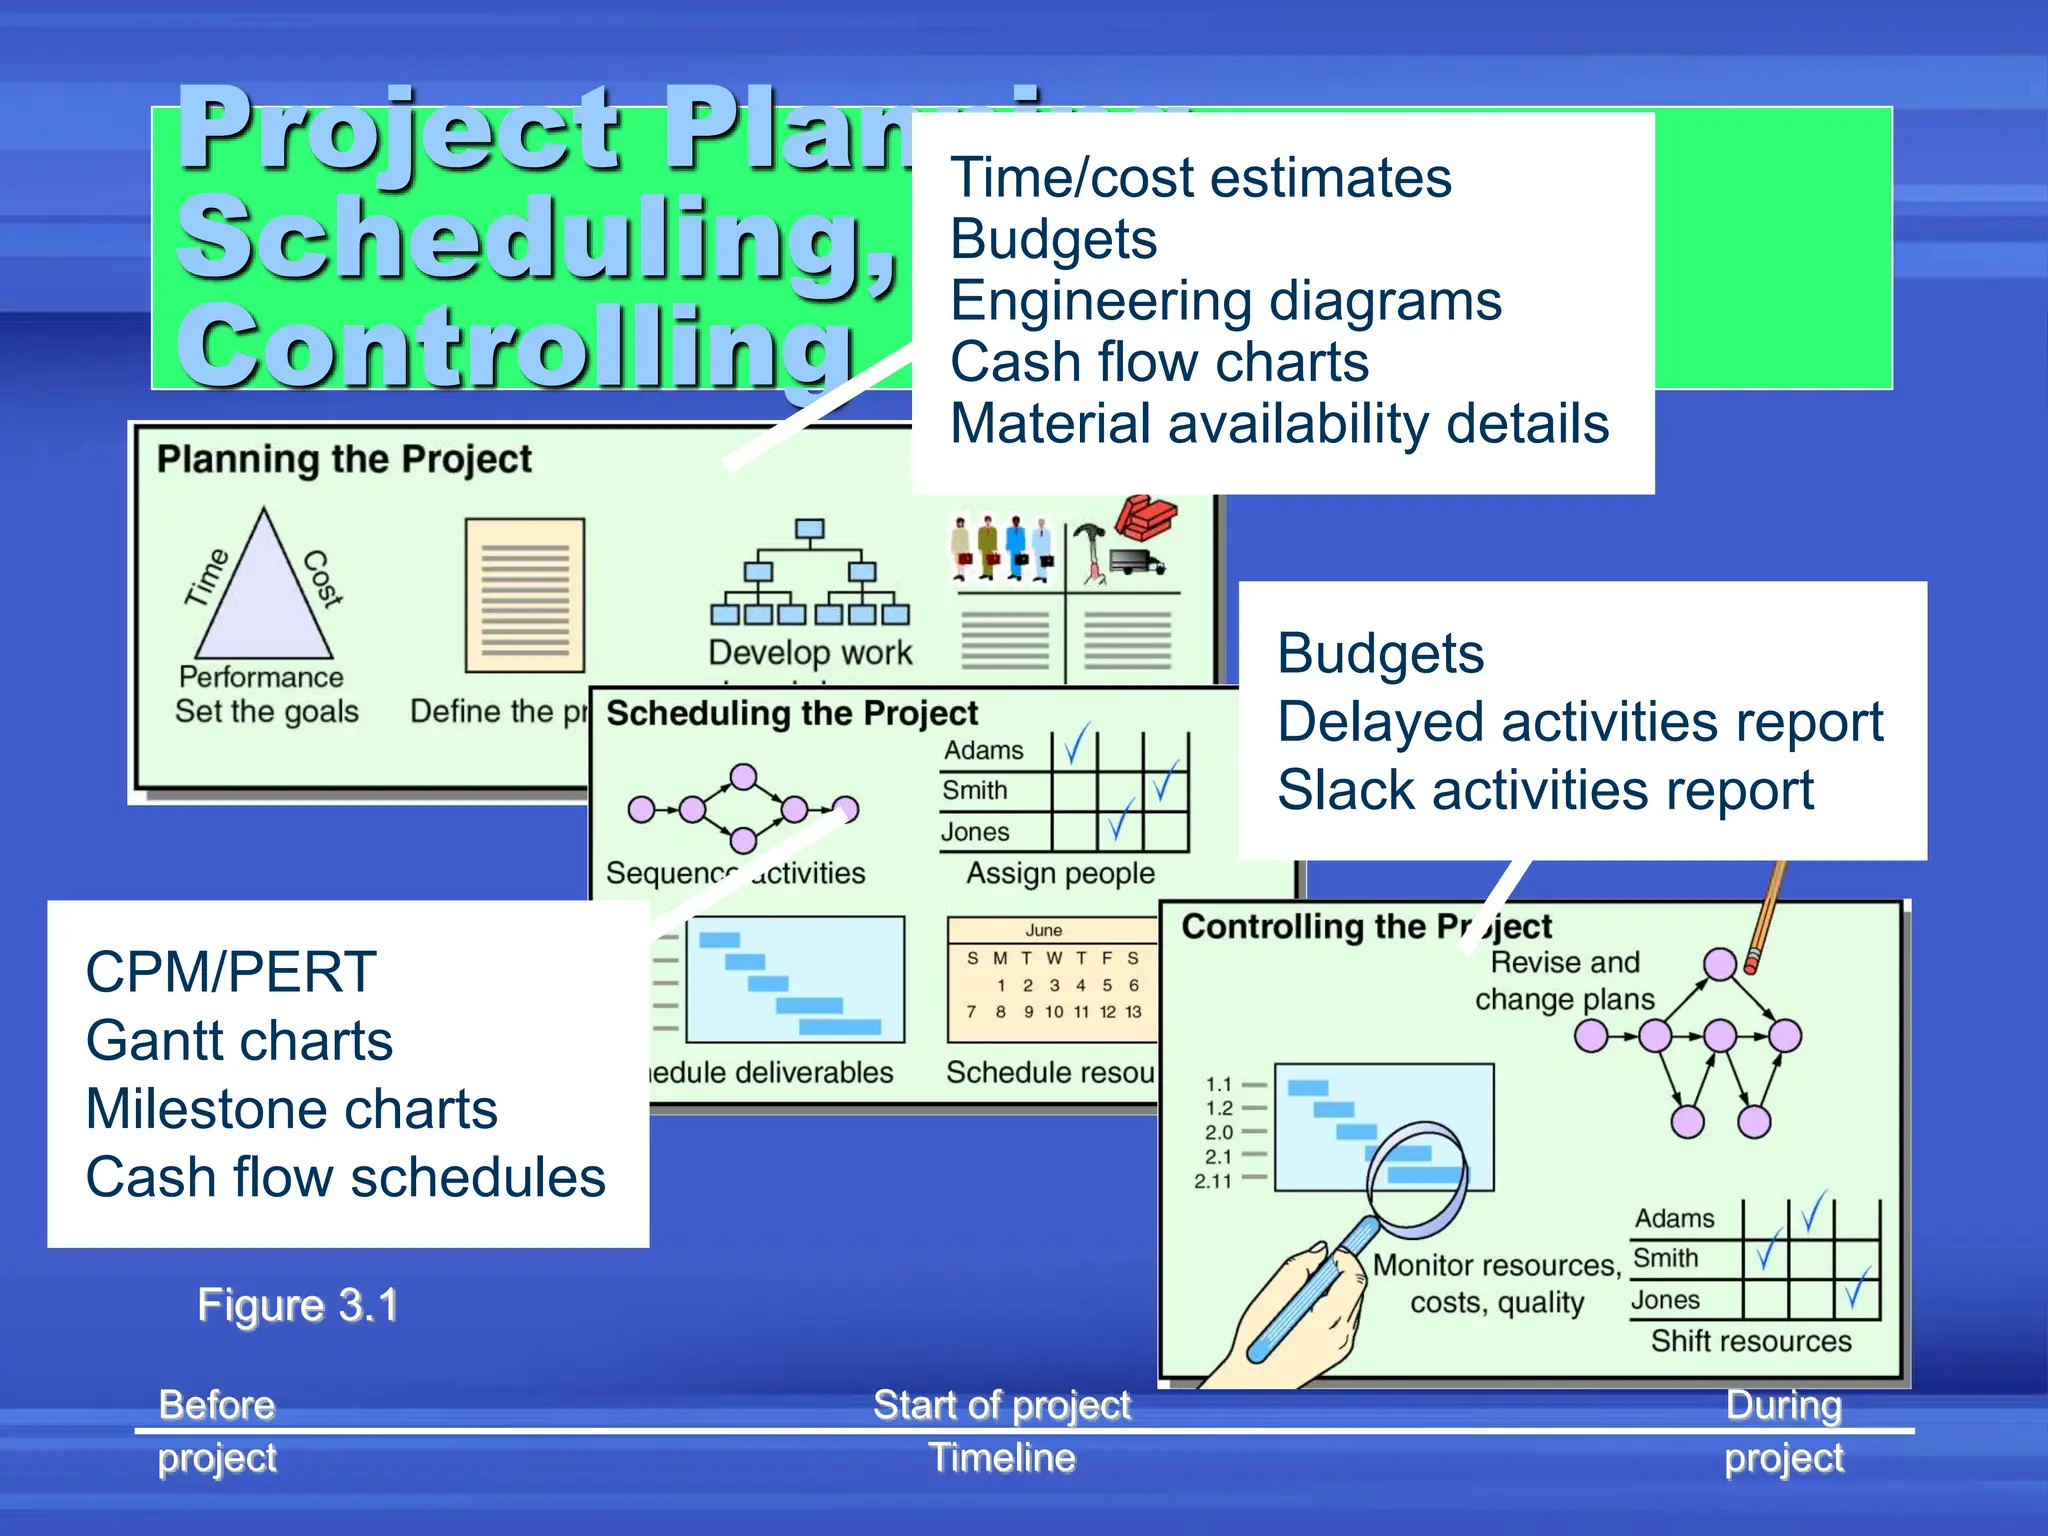
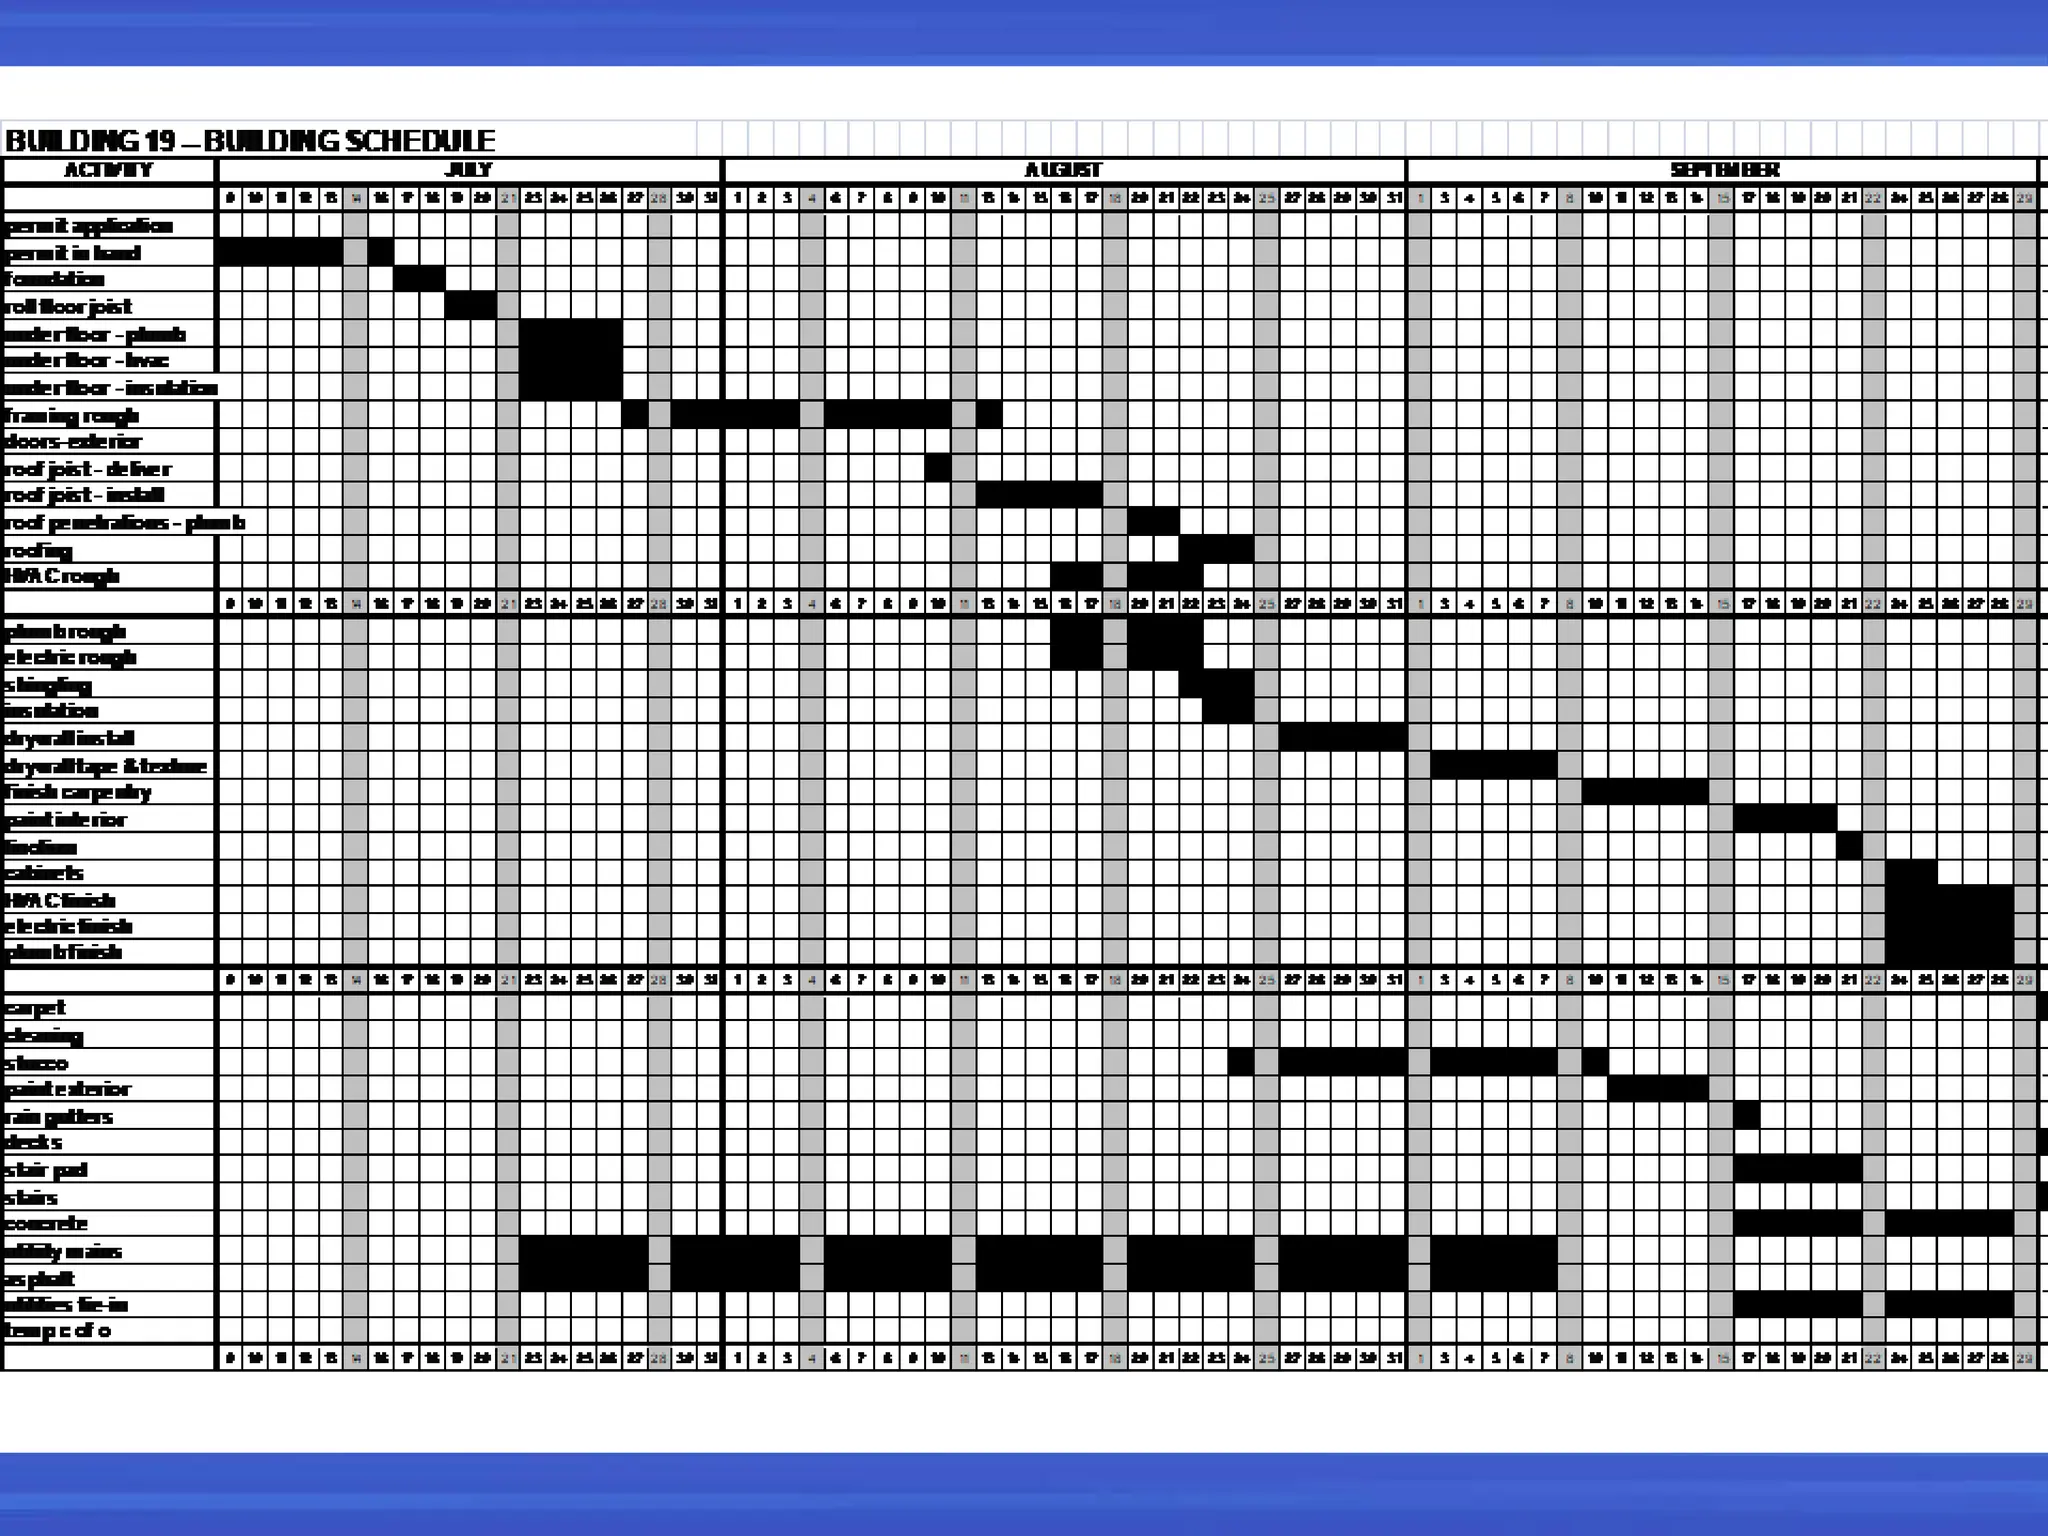
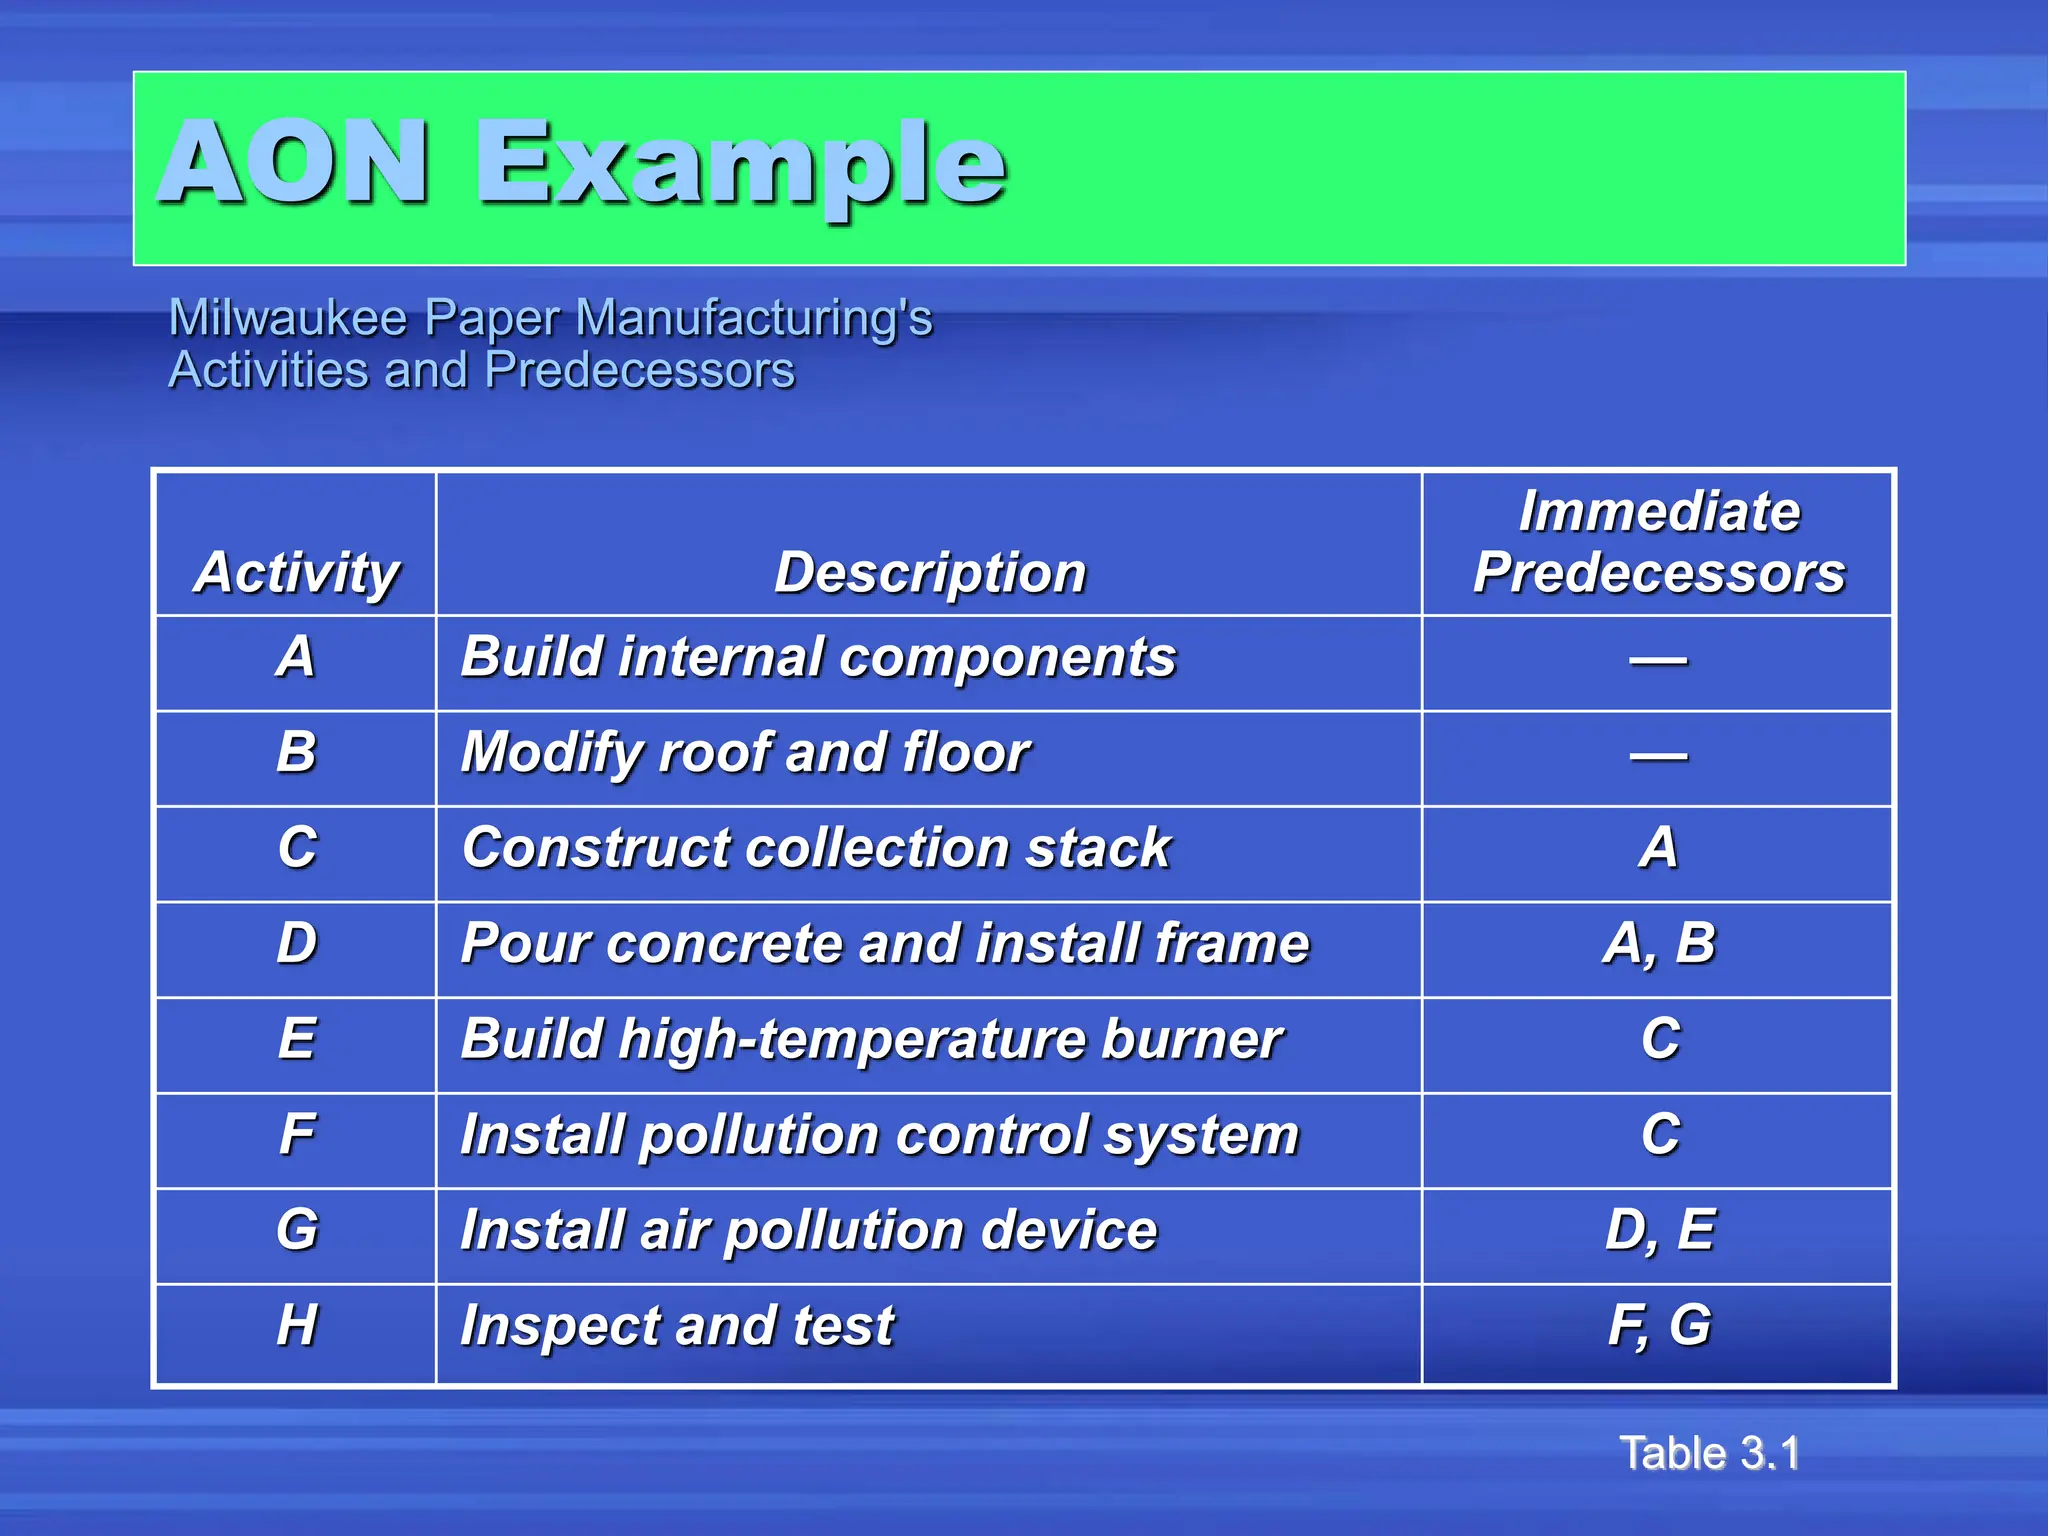
Project management involves three key phases: planning, scheduling, and controlling. Planning involves setting objectives, identifying activities, and estimating resources and costs. Scheduling determines the start and finish times of activities using techniques like CPM and PERT to identify the critical path. Controlling monitors progress against the plan and allows for revisions if needed. Effective project management requires thorough planning, scheduling of activities and resources, and ongoing controlling to ensure projects are completed on time and on budget.


![Estimate follows beta distribution
Variability in Activity
Times
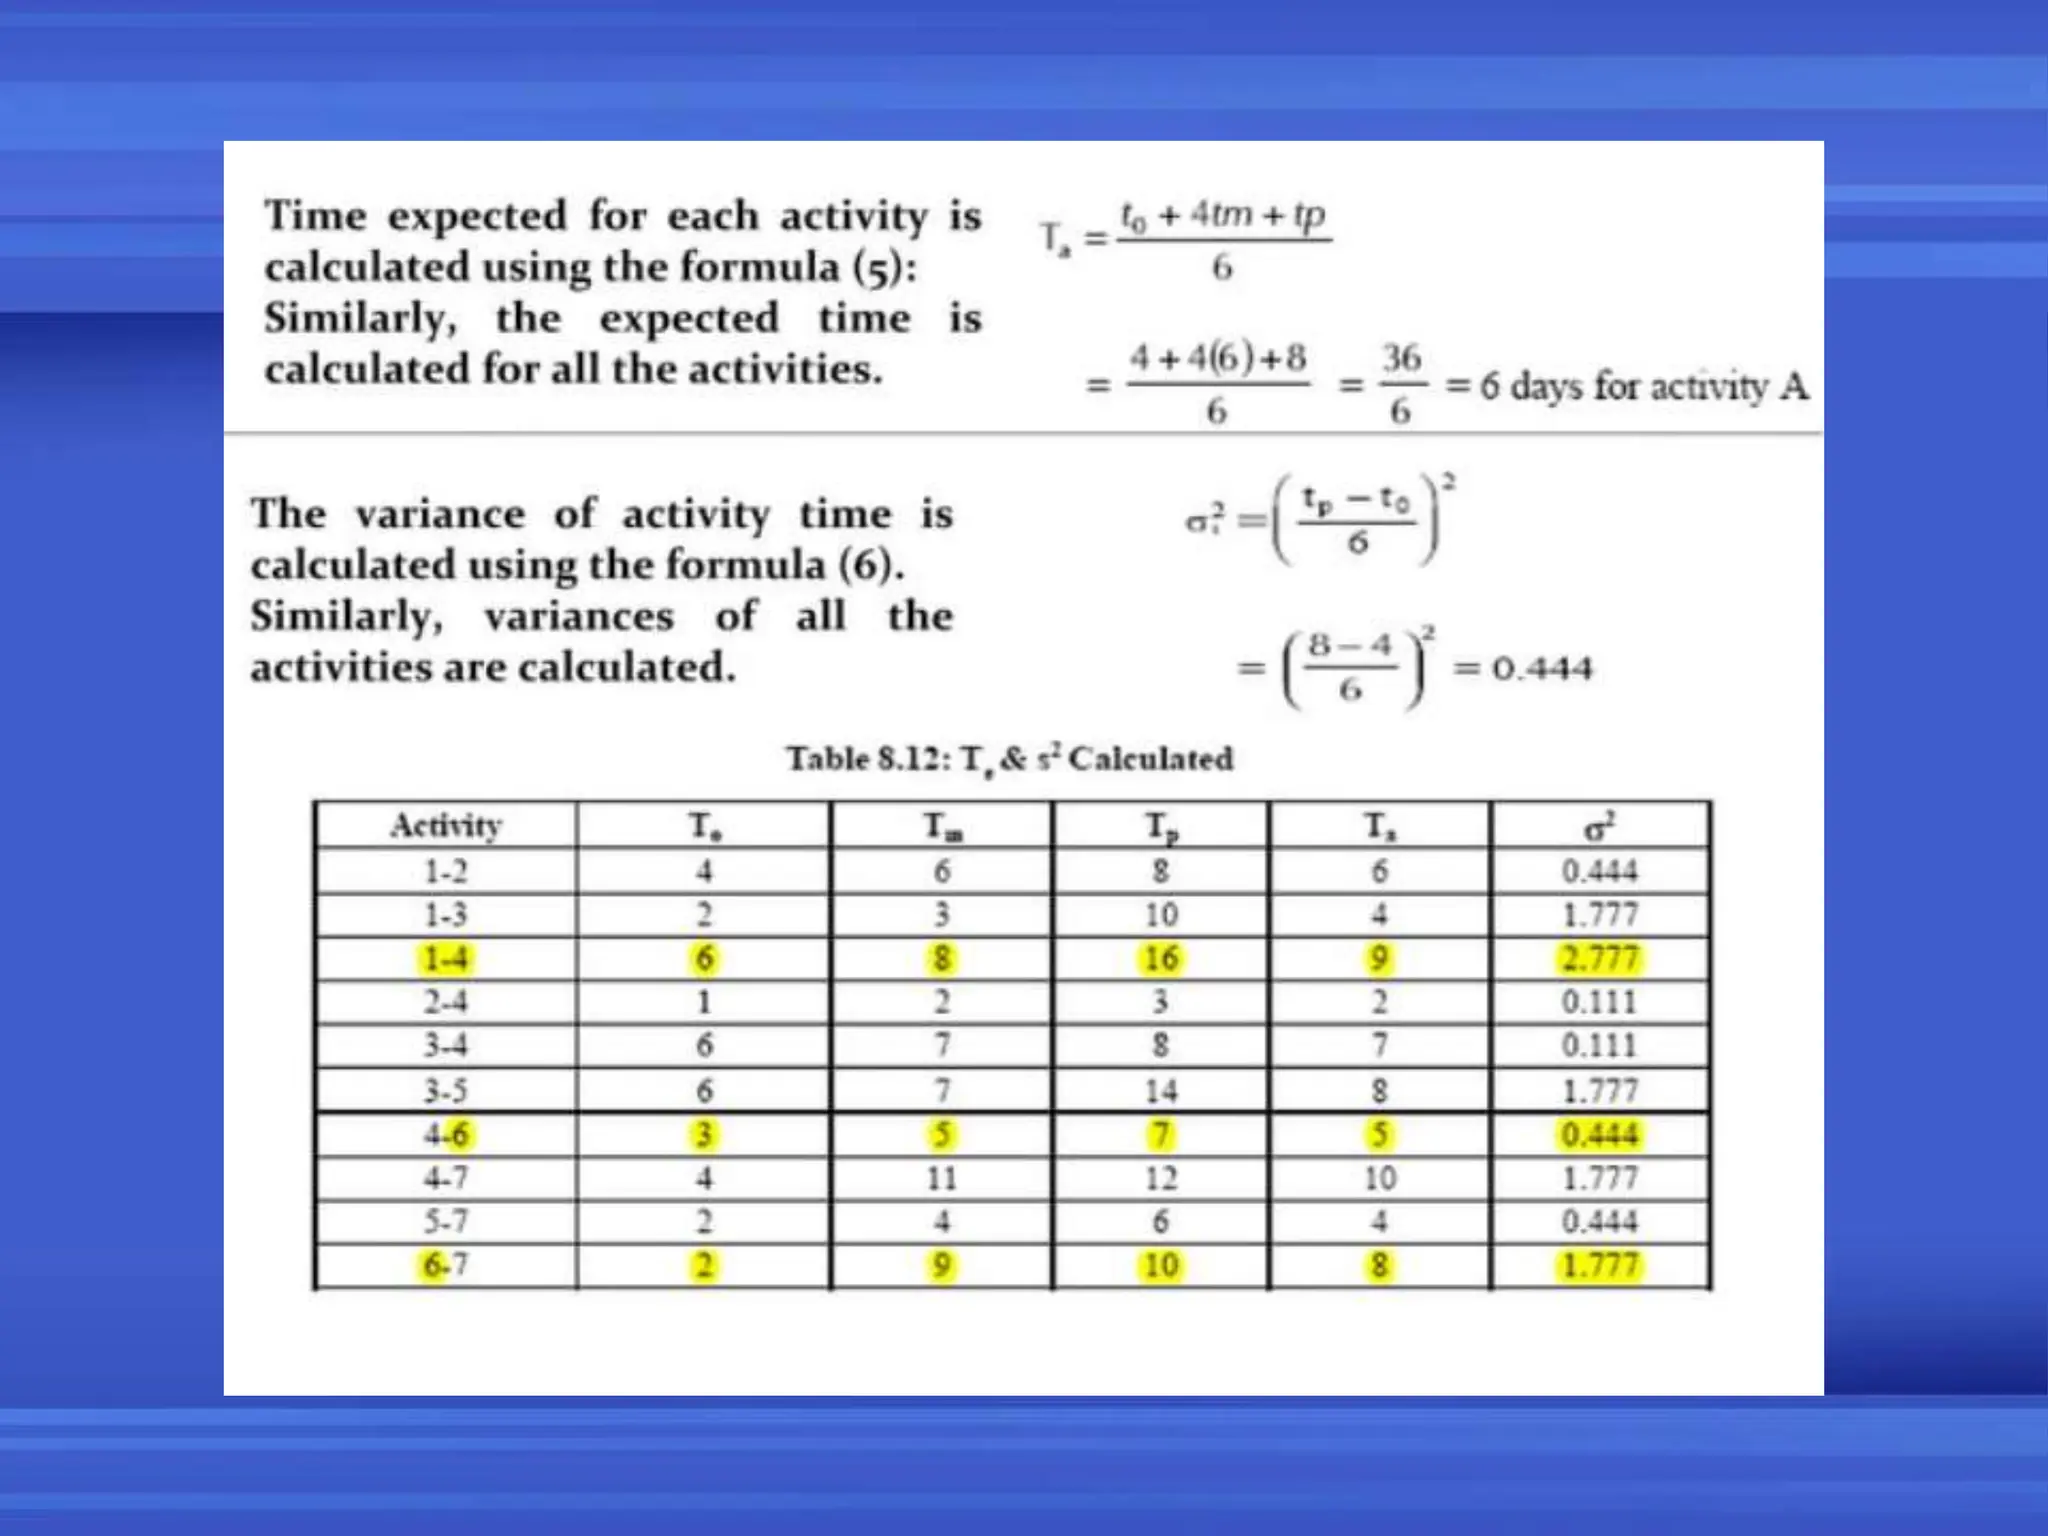
Expected time:
Variance of times:
t = (a + 4m + b)/6
v = [(b – a)/6]2](https://image.slidesharecdn.com/projectmanagement-04-231105095925-377504de/75/project-management-04-ppt-90-2048.jpg)
![Estimate follows beta distribution
Variability in Activity
Times
Expected time:
Variance of times:
t = (a + 4m + b)/6
v = [(b − a)/6]2
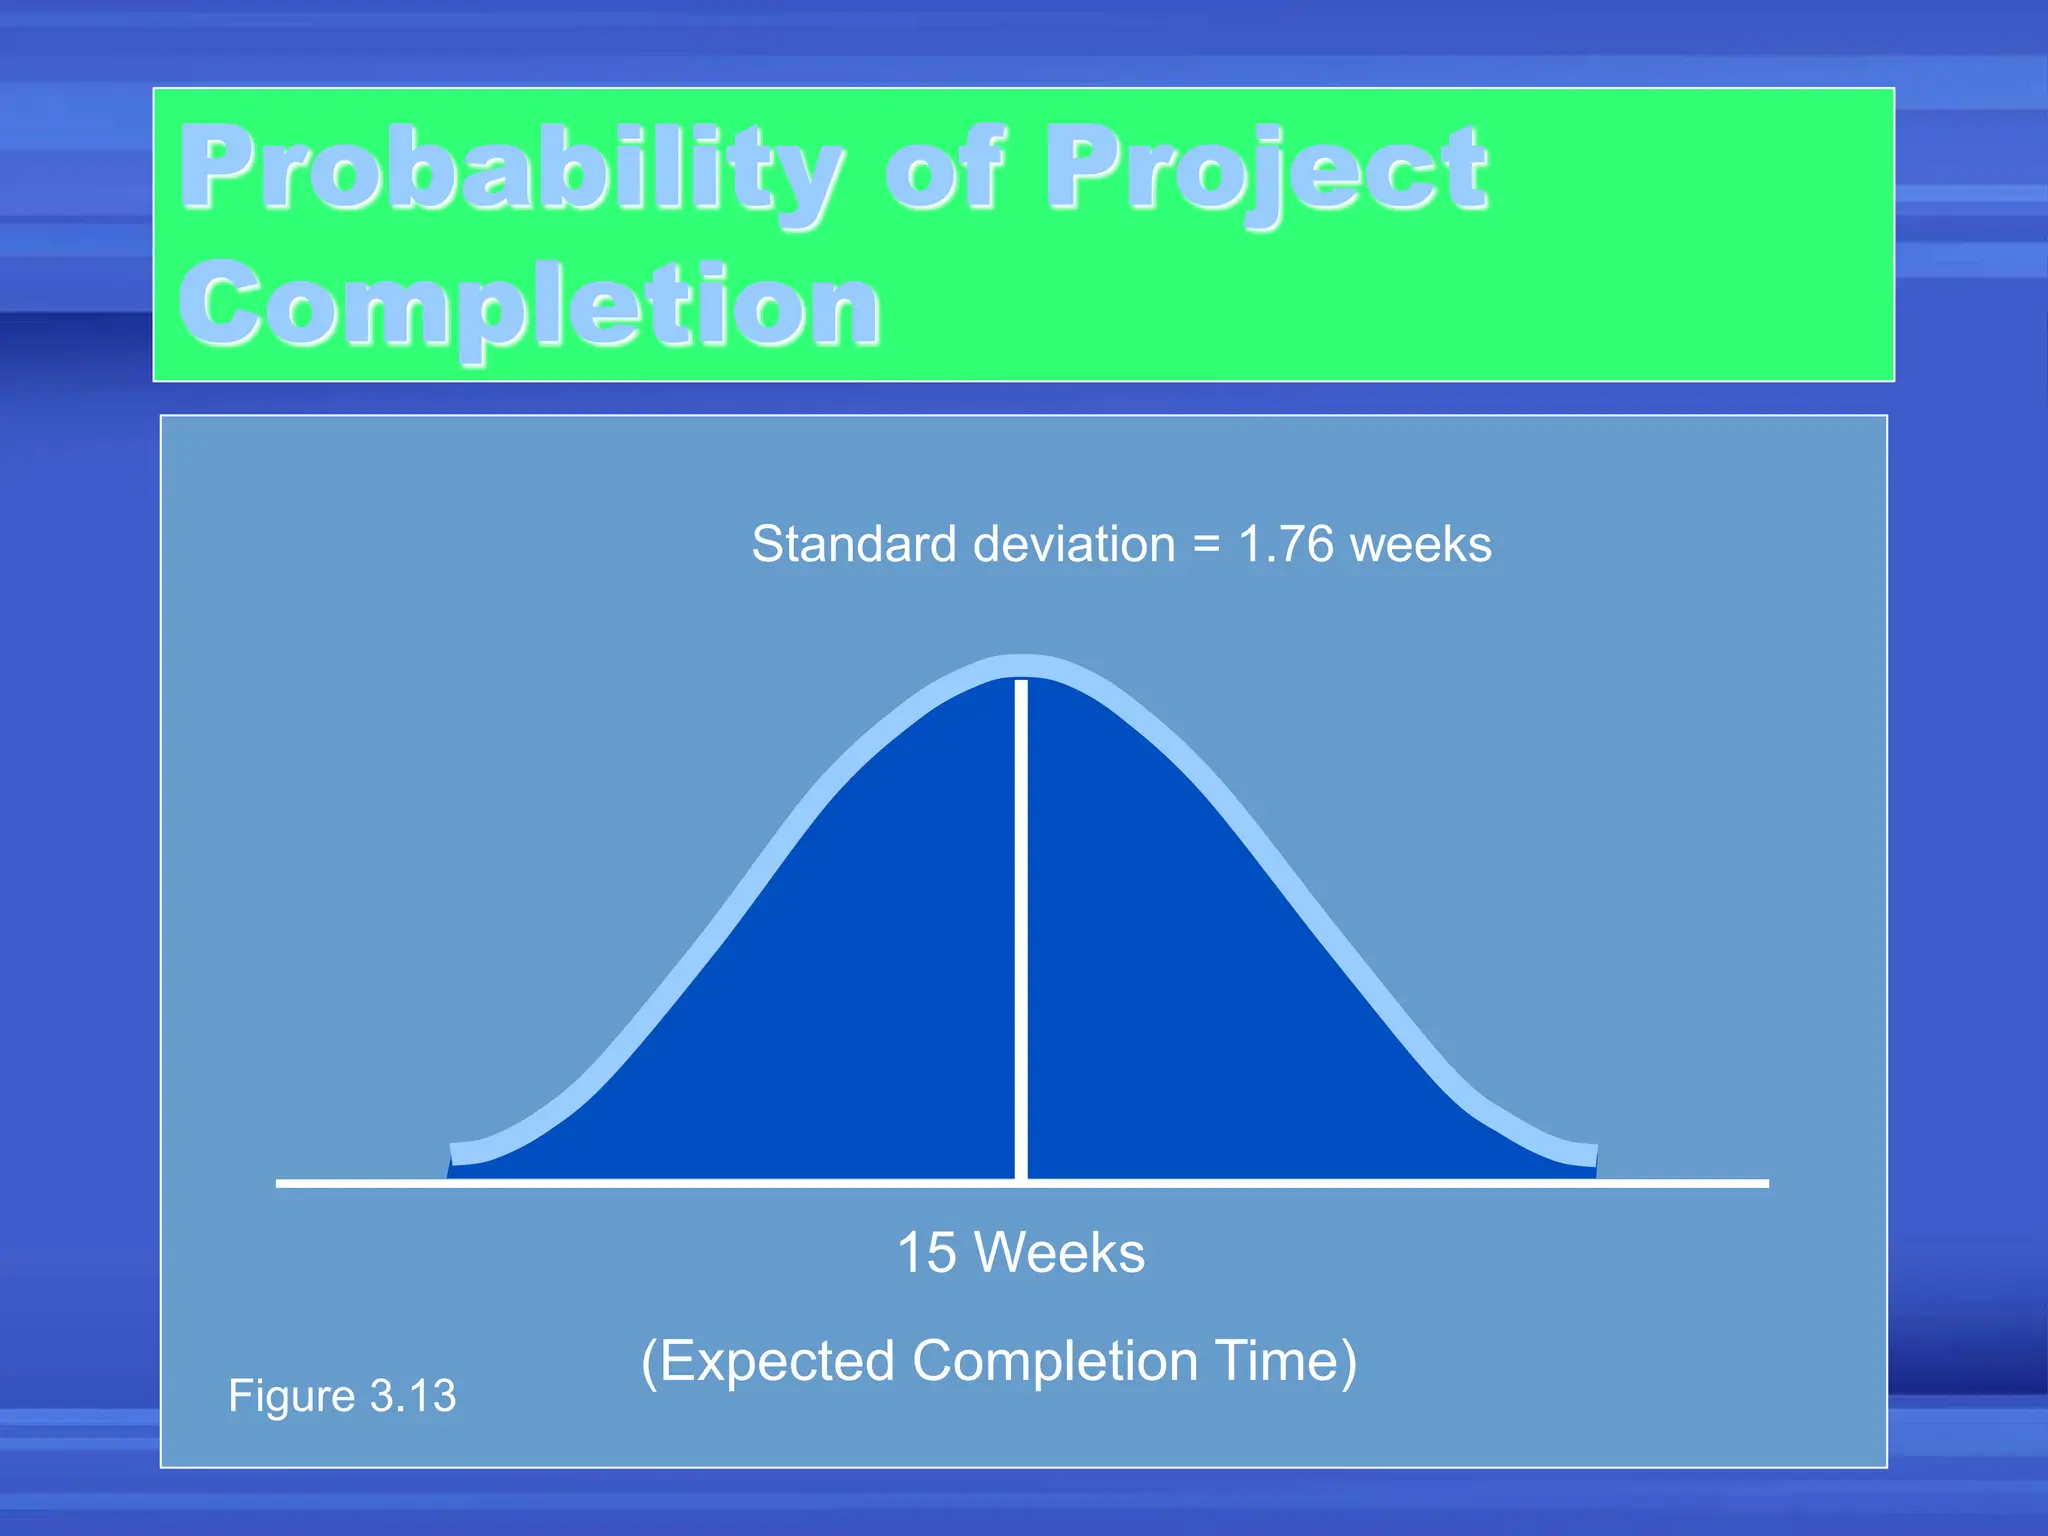
Probability of
1 in 100 of > b
occurring
Probability of
1 in 100 of
< a occurring
Probability
Optimistic
Time (a)
Most Likely Time
(m)
Pessimistic Time
(b)
Activity
Time
Figure 3.12](https://image.slidesharecdn.com/projectmanagement-04-231105095925-377504de/75/project-management-04-ppt-91-2048.jpg)
![Computing Variance
Most Expected
Optimistic Likely Pessimistic Time Variance
Activity a m b t = (a + 4m + b)/6 [(b – a)/6]2
A 1 2 3 2 .11
B 2 3 4 3 .11
C 1 2 3 2 .11
D 2 4 6 4 .44
E 1 4 7 4 1.00
F 1 2 9 3 1.78
G 3 4 11 5 1.78
H 1 2 3 2 .11
Table 3.4](https://image.slidesharecdn.com/projectmanagement-04-231105095925-377504de/75/project-management-04-ppt-92-2048.jpg)