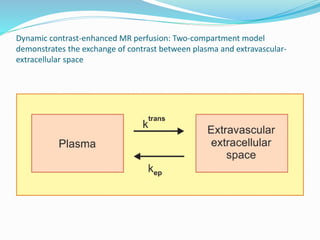
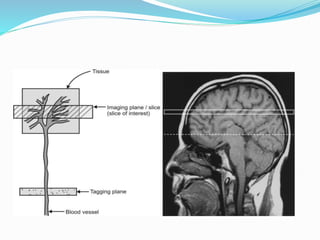
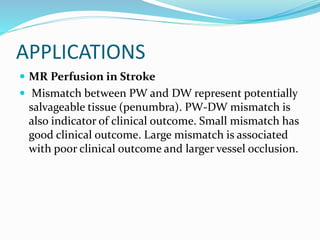
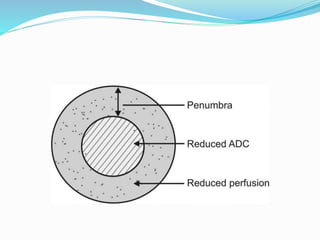
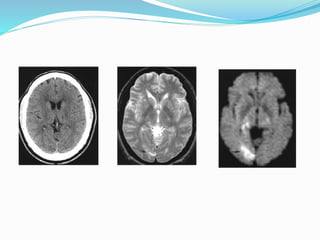
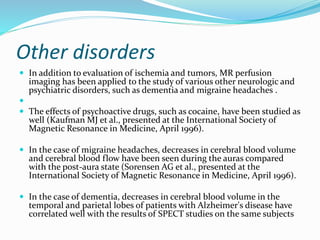
SlideShare a Scribd company logo
Presented by Dr Fahad Shafi
 Perfusion refers to the passage of blood from an arterial
supply to venous drainage through the microcirculation.
 perfusion imaging provides hemodynamic information
that complements the anatomic information attainable
with conventional imaging.
 Measurement of tissue perfusion depends on the ability to
serially measure concentration of a tracer agent in a target organ
of interest. Exogenous tracers such as iced saline solution,
iodinated radiographic contrast material, and radionuclides have
been used .
 With the advent of MR imaging, exogenous tracer agents, such
as paramagnetic contrast material, and endogenous tracer
agents, such as magnetically labeled blood, have been used
Exogenous Tracer Methods
 Dynamic Susceptibility Contrast-enhanced MR
Perfusion.
 Dynamic Contrast Enhanced MR Perfusion
Dynamic Susceptibility Contrast-
enhanced MR Perfusion
 Exploits the T2* susceptibility effects of gadolinium,
rather than the T1 shortening effects routinely
associated with contrast enhancement on
conventional imaging.
 Signal loss resulting from passage of the contrast agent
bolus on T2* weighted images can be used to calculate
the change in contrast concentration occurring in each
pixel
Image acquisition
 Comfortably positioned.
 Data is acquired by using a fast imaging technique, such as single or multishot echo
planar imaging (EPI) to produce a temporal resolution of approximately 2 seconds.
 The imaging sequence may be gradient echo which will maximize T2* weighting or
alternatively a spin echo approach can be used which will minimize the signal
contribution from large vessels.
 A series of at least five pre-contrast images should be collected prior to the passage of the
bolus to improve the estimation of the signal intensity baseline during analysis.
 A standard contrast dose (0.1 mmol/kg) is adequate in most cases although double dose
of gadolinium (0.2 mmol/Kg) may be used to improve signal to noise ratio.
 The contrast is usually injected via an 18- or 20-gauge IV catheter at a high rate (3-7
mL/sec) using a power injector. The injection should be followed by a saline flush of at
least 25 mL (20-30 mL) in order to ensure that the bolus, which enters the central
circulation is as coherent as possible
Data analysis:
 The drop in T2* signal caused by the susceptibility
effects of gadolinium is computed on a voxel-by-voxel
basis and used to construct a time-versus intensity
curve.
 The degree of signal drop is then assumed to be
proportional to the tissue concentration of
gadolinium, so that relative concentration-time curves
can be obtained (delta R2 curves)
Figure shows data analysis in DSC perfusion. (A) Time-versus MR signal intensity curve where signal
intensity decrease during passage of contrast agent bolus and is measured from a series of MR
images. (B) Tissue concentration-versus time curve where change in the relaxation rate (ΔR2*) is
calculated from signal intensity, and a baseline subtraction method is applied to measured data. (C)
Corrected ΔR2* curve after leakage correction
To obtain tissue response function, arterial concentration-time curve, or
arterial input function, must be deconvolved from measured tissue
concentration-time curve. This arterial input function may be derived directly
from imaging data
Problems with DSC MRI:
 Contrast recirculation
 Contrast leakage and tissue enhancement
 Bolus dispersion and the measurement of
absolute CBF
Dynamic Contrast Enhanced MR
Perfusion
 provides insight into the nature of the tissue
properties at the microvascular level by demonstrating
the wash-in, plateau, and washout contrast kinetics of
the tissue.
 also referred as ‘permeability’ MRI, is an entirely
different approach to MR perfusion as the main focus
is on estimating tumor permeability
 main advantage of T1- based techniques is that tumor
leakiness (enhancement) is used for data analysis
rather than considering it as an artifact as in DSC MRP.
 It has been established that quantification of contrast
leakage can provide powerful indicators of the state of
neovascular angiogenesis in pathologies, such as
tumors and inflammatory tissue;
Principle:
 measures the ‘relaxivity effects’ of the paramagnetic
contrast material.
 DCE MRP is based on a two-compartmental (plasma
space and extravascular-extracellular space)
pharmacokinetic model
Dynamic contrast-enhanced MR perfusion: Two-compartment model
demonstrates the exchange of contrast between plasma and extravascular-
extracellular space
Image acquisition:
 perform baseline T1 mapping, acquire DCE MRP
images, convert signal intensity data to gadolinium
concentration, determine the vascular input function,
and perform pharmacokinetic modeling.
 lower dose of gadolinium is administered (typically a
single dose of 0.1 mmol/kg) at a lower rate (2 mL/sec)
and repetitive acquisitions are then made through the
lesion at longer intervals, typically every 15 to 26
seconds
Data analysis:
 Simple analysis techniques: comparing the signal
intensity curves from ROI.
 simplest of these is a measurement of the time taken for
the tumor tissue to attain 90 percent of its subsequent
maximal enhancement (T90).
 Various curve shapes can also provide insight into the
quantification and calculates a standardized slope of the
enhancement curve
 Pharmacokinetic analysis techniques: several
metrics are commonly derived: the transfer constant
(ktrans), the fractional volume of the extravascular
extracellular space (ve), the rate constant (kep, kep =
ktrans/ve), and the fractional volume of the plasma
space (vp).
 intended to calculate the biological features, such as
endothelial permeability and the endothelial surface
area, which are relatively independent of imaging
approach
Problems with quantitative
measurement of DCE MRI:
 Partial volume averaging effects: excluding any
voxel which produces values over a certain threshold
(1.2/ min) as being vascular in origin or more complex
pharmacokinetic models.
 Long acquisition time: modifying the
pharmacokinetic model and describing only the first
passage of the contrast bolus. This technique also
eliminates the problems with partial volume averaging
described above and produces highly reproducible
parametric maps of both ktrans and CBV.
 Flow dependency of ktrans: in areas where there is
contrast leakage and the blood flow is inadequate to
replenish contrast at adequate rate; as a result plasma
contrast concentration decreases and ktrans will
reflect local blood flow.
Endogenous Tracer Methods Arterial Spin Labeling MR
Imaging
 Arterial blood flowing towards the region of interest is
tagged by magnetic inversion pulses (proton phase is
changed).
↓
 After a delay to allow for inflow of tagged blood,
image is acquired in slice of interest. This image is
called ‘tag image’.
↓
 Second image without in-flowing tagged blood. This
image is called ‘control image’.
↓
 Tag image is subtracted from control image
↓
 This results into perfusion image representing ‘tagged
blood’ that flowed into the image slice.
 It has poor SNR, however, ASL has better spatial and
temporal resolution than PET. Poor SNR and
sensitivity to abnormally long transit delays of tagged
protons prevents its general application.
APPLICATIONS
 MR Perfusion in Stroke
 Mismatch between PW and DW represent potentially
salvageable tissue (penumbra). PW-DW mismatch is
also indicator of clinical outcome. Small mismatch has
good clinical outcome. Large mismatch is associated
with poor clinical outcome and larger vessel occlusion.
Brain tumors
Other disorders
 In addition to evaluation of ischemia and tumors, MR perfusion
imaging has been applied to the study of various other neurologic and
psychiatric disorders, such as dementia and migraine headaches .

 The effects of psychoactive drugs, such as cocaine, have been studied as
well (Kaufman MJ et al., presented at the International Society of
Magnetic Resonance in Medicine, April 1996).
 In the case of migraine headaches, decreases in cerebral blood volume
and cerebral blood flow have been seen during the auras compared
with the post-aura state (Sorensen AG et al., presented at the
International Society of Magnetic Resonance in Medicine, April 1996).
 In the case of dementia, decreases in cerebral blood volume in the
temporal and parietal lobes of patients with Alzheimer's disease have
correlated well with the results of SPECT studies on the same subjects
DYNAMIC CONTRAST-ENHANCED
MRI
 malignant lesions usually show faster and higher levels
of enhancement than normal tissue. This
enhancement pattern of the malignant lesions reflects
increased vascularity (neoangiogenesis) and higher
endothelial permeability to the contrast molecules.
 dynamic contrast-enhanced MRI (DCE-MRI) is
modality of choice for the diagnosis and
characterization of the tumors of the brain, breast,
prostate, liver, cervix and musculoskeletal system
Principle:
 relies on fast MRI sequences obtained before, during
and after the rapid intravenous (IV) administration of
a gadolinium-based contrast agent.
 DCE-MRI is sensitive to alterations in vascular
permeability, extracellular space and blood flow. The
DCE-MRI enables the depiction of physiologic
alterations as well as morphologic changes.
Image acquisition:
 minimum of three sections
 imaging volume that includes a region outside the tumor,
such as an artery or muscle for normalization.
 injected at a constant rate with a power injector typically
using 3D T1-weighted acquisition.
 Serial image sets are obtained sequentially every 5 seconds
(ranging from 2–15 seconds) for up to 5 to 10 minutes.
Data analysis:Qualitative or visual analysis is most readily
accessible analytic but also the least standardized method
Semi-quantitative analysis:
 calculates various curve parameters and is also referred
as curveology.
 also based on the assumption of early and intense
enhancement and washout as a predictor of
malignancy.
 Parameters are obtained to characterize the shape of
the time-intensity curve, such as the time of first
contrast uptake, time to peak, maximum slope, peak
enhancement, and wash-in and washout curve shapes
 There are three common dynamic curve types after
initial uptake: type 1, persistent increase; type 2,
plateau; and type 3, decline after initial upslope. Type 3
is considered to be indicator of malignancy.
 semiquantitative approach is widely used and has the
advantage of being simple to perform
 It has limitations in terms of generalization across
acquisition protocols, sequences, and all other factors
contributing to the MR signal intensity, which in turn
affect curve metrics, such as maximum enhancement
and washout percentage.
Quantitative analysis:
 Quantitative analysis is most generalizable but most
complex method.
 It depends on contrast concentration curves over time and
use pharmacokinetic models to calculate permeability
constants.
 fundamental limitation of DCE-MRI, namely the
parameters it generates are inherently ambiguous with
regard to their physiologic significance.

More Related Content

What's hot

MR ANGIOGRAPHY PHYSICS
MR ANGIOGRAPHY PHYSICSMR ANGIOGRAPHY PHYSICS
MR ANGIOGRAPHY PHYSICS
AvinashDahatre
 
Magnetic Resonance Diffusion
Magnetic Resonance DiffusionMagnetic Resonance Diffusion
Magnetic Resonance Diffusion
Rahman Ud Din
 
magnetic resonance angiography
magnetic resonance angiographymagnetic resonance angiography
magnetic resonance angiography
qavi786
 
Diffusion Weighted Imaging- Avinesh Shrestha
Diffusion Weighted Imaging- Avinesh ShresthaDiffusion Weighted Imaging- Avinesh Shrestha
Diffusion Weighted Imaging- Avinesh Shrestha
Avinesh Shrestha
 
CT Angiography presentation
CT Angiography presentation CT Angiography presentation
CT Angiography presentation
Shatha M
 
BASIC MRI SEQUENCES
BASIC MRI SEQUENCESBASIC MRI SEQUENCES
BASIC MRI SEQUENCES
Ganesan Yogananthem
 
Dual Energy CT
Dual Energy CTDual Energy CT
Dual Energy CT
Sudil Paudyal
 
Cisternography sujan
Cisternography sujanCisternography sujan
Cisternography sujan
SUJAN KARKI
 
Presentation1.pptx, radiological imaging of spinal cord tumour.
Presentation1.pptx, radiological imaging of spinal cord tumour.Presentation1.pptx, radiological imaging of spinal cord tumour.
Presentation1.pptx, radiological imaging of spinal cord tumour.Abdellah Nazeer
 
Brachial plexus imaging
Brachial  plexus imagingBrachial  plexus imaging
Brachial plexus imaging
NeurologyKota
 
Magnetic Resonance Angiography and techniques
Magnetic Resonance Angiography and techniquesMagnetic Resonance Angiography and techniques
Magnetic Resonance Angiography and techniques
AlwineAnto
 
Magnetic resonance angiography
Magnetic resonance angiographyMagnetic resonance angiography
Magnetic resonance angiography
Rahman Ud Din
 
MRI artifacts
MRI artifactsMRI artifacts
MRI artifacts
Sudil Paudyal
 
Radiology Spotters
Radiology Spotters Radiology Spotters
Radiology Spotters
Anish Choudhary
 
MR spectroscopy
MR spectroscopyMR spectroscopy
MR spectroscopy
airwave12
 
CT RADIATION DOSE REDUCTION
CT RADIATION DOSE REDUCTION CT RADIATION DOSE REDUCTION
CT RADIATION DOSE REDUCTION
Ganesan Yogananthem
 
MRI-Magnetic Resonance Elastography (MRE) -Avinesh Shrestha
MRI-Magnetic Resonance Elastography (MRE) -Avinesh ShresthaMRI-Magnetic Resonance Elastography (MRE) -Avinesh Shrestha
MRI-Magnetic Resonance Elastography (MRE) -Avinesh Shrestha
Avinesh Shrestha
 
Diffusion weighted imaging
Diffusion  weighted imagingDiffusion  weighted imaging
Diffusion weighted imaging
Sharath Raj
 

What's hot (20)

MR ANGIOGRAPHY PHYSICS
MR ANGIOGRAPHY PHYSICSMR ANGIOGRAPHY PHYSICS
MR ANGIOGRAPHY PHYSICS
 
Magnetic Resonance Diffusion
Magnetic Resonance DiffusionMagnetic Resonance Diffusion
Magnetic Resonance Diffusion
 
magnetic resonance angiography
magnetic resonance angiographymagnetic resonance angiography
magnetic resonance angiography
 
Diffusion Weighted Imaging- Avinesh Shrestha
Diffusion Weighted Imaging- Avinesh ShresthaDiffusion Weighted Imaging- Avinesh Shrestha
Diffusion Weighted Imaging- Avinesh Shrestha
 
MRI sequences
MRI sequencesMRI sequences
MRI sequences
 
CT Angiography presentation
CT Angiography presentation CT Angiography presentation
CT Angiography presentation
 
BASIC MRI SEQUENCES
BASIC MRI SEQUENCESBASIC MRI SEQUENCES
BASIC MRI SEQUENCES
 
Dual Energy CT
Dual Energy CTDual Energy CT
Dual Energy CT
 
Cisternography sujan
Cisternography sujanCisternography sujan
Cisternography sujan
 
Presentation1.pptx, radiological imaging of spinal cord tumour.
Presentation1.pptx, radiological imaging of spinal cord tumour.Presentation1.pptx, radiological imaging of spinal cord tumour.
Presentation1.pptx, radiological imaging of spinal cord tumour.
 
Brachial plexus imaging
Brachial  plexus imagingBrachial  plexus imaging
Brachial plexus imaging
 
Magnetic Resonance Angiography and techniques
Magnetic Resonance Angiography and techniquesMagnetic Resonance Angiography and techniques
Magnetic Resonance Angiography and techniques
 
Magnetic resonance angiography
Magnetic resonance angiographyMagnetic resonance angiography
Magnetic resonance angiography
 
MRI artifacts
MRI artifactsMRI artifacts
MRI artifacts
 
Radiology Spotters
Radiology Spotters Radiology Spotters
Radiology Spotters
 
MR spectroscopy
MR spectroscopyMR spectroscopy
MR spectroscopy
 
CT RADIATION DOSE REDUCTION
CT RADIATION DOSE REDUCTION CT RADIATION DOSE REDUCTION
CT RADIATION DOSE REDUCTION
 
MRI-Magnetic Resonance Elastography (MRE) -Avinesh Shrestha
MRI-Magnetic Resonance Elastography (MRE) -Avinesh ShresthaMRI-Magnetic Resonance Elastography (MRE) -Avinesh Shrestha
MRI-Magnetic Resonance Elastography (MRE) -Avinesh Shrestha
 
Diffusion weighted imaging
Diffusion  weighted imagingDiffusion  weighted imaging
Diffusion weighted imaging
 
Dual Energy CT - SIEMENS
Dual Energy CT - SIEMENSDual Energy CT - SIEMENS
Dual Energy CT - SIEMENS
 

Viewers also liked

An introduction to MRI
An introduction to MRIAn introduction to MRI
An introduction to MRI
ghazale boroumand
 
fMRI Presentation
fMRI PresentationfMRI Presentation
fMRI Presentation
ricksw78
 
DWI/ ADC MRI principles/ applications in veterinary medicine
DWI/ ADC MRI principles/ applications  in veterinary medicineDWI/ ADC MRI principles/ applications  in veterinary medicine
DWI/ ADC MRI principles/ applications in veterinary medicine
Robert Cruz
 
Imaging in stroke
Imaging in strokeImaging in stroke
Imaging in strokeRaju Soni
 
Week 2. Diffusion magnetic resonance imaging, tractography, mapping the brain...
Week 2. Diffusion magnetic resonance imaging, tractography, mapping the brain...Week 2. Diffusion magnetic resonance imaging, tractography, mapping the brain...
Week 2. Diffusion magnetic resonance imaging, tractography, mapping the brain...Dr. Jakab András
 
Presentation1.pptx, diffusion weighted imaging in brain tumour.
Presentation1.pptx, diffusion weighted imaging in brain tumour.Presentation1.pptx, diffusion weighted imaging in brain tumour.
Presentation1.pptx, diffusion weighted imaging in brain tumour.Abdellah Nazeer
 
Advances in neuroimaging techniques
Advances in neuroimaging techniquesAdvances in neuroimaging techniques
Advances in neuroimaging techniques
Sreenivasa Raju
 
MRI Procedure of Brain
MRI Procedure of BrainMRI Procedure of Brain
MRI Procedure of BrainSudil Paudyal
 

Viewers also liked (9)

Mri contrast
Mri contrastMri contrast
Mri contrast
 
An introduction to MRI
An introduction to MRIAn introduction to MRI
An introduction to MRI
 
fMRI Presentation
fMRI PresentationfMRI Presentation
fMRI Presentation
 
DWI/ ADC MRI principles/ applications in veterinary medicine
DWI/ ADC MRI principles/ applications  in veterinary medicineDWI/ ADC MRI principles/ applications  in veterinary medicine
DWI/ ADC MRI principles/ applications in veterinary medicine
 
Imaging in stroke
Imaging in strokeImaging in stroke
Imaging in stroke
 
Week 2. Diffusion magnetic resonance imaging, tractography, mapping the brain...
Week 2. Diffusion magnetic resonance imaging, tractography, mapping the brain...Week 2. Diffusion magnetic resonance imaging, tractography, mapping the brain...
Week 2. Diffusion magnetic resonance imaging, tractography, mapping the brain...
 
Presentation1.pptx, diffusion weighted imaging in brain tumour.
Presentation1.pptx, diffusion weighted imaging in brain tumour.Presentation1.pptx, diffusion weighted imaging in brain tumour.
Presentation1.pptx, diffusion weighted imaging in brain tumour.
 
Advances in neuroimaging techniques
Advances in neuroimaging techniquesAdvances in neuroimaging techniques
Advances in neuroimaging techniques
 
MRI Procedure of Brain
MRI Procedure of BrainMRI Procedure of Brain
MRI Procedure of Brain
 

Similar to Perfusion and dynamic contrast enhanced mri

Advances in neuro-imaging
Advances in neuro-imaging Advances in neuro-imaging
Advances in neuro-imaging
Osama Ragab
 
CT_Perfusion.pptx
CT_Perfusion.pptxCT_Perfusion.pptx
CT_Perfusion.pptx
SunnySiu8
 
Quantitative CT and MR Imaging of Liver
Quantitative CT and MR Imaging of Liver Quantitative CT and MR Imaging of Liver
Quantitative CT and MR Imaging of Liver
Dr. Manoj Krishnan Sarojam
 
QILiverfinal.pptx
QILiverfinal.pptxQILiverfinal.pptx
QILiverfinal.pptx
Dr. Manoj Krishnan Sarojam
 
Cardiac MRI
Cardiac MRICardiac MRI
Cardiac MRI
NAJEEB ULLAH SOFI
 
Ecr2011 c 0603 (1)
Ecr2011 c 0603 (1)Ecr2011 c 0603 (1)
Ecr2011 c 0603 (1)
Zain Abdeen
 
Chad Hyslop - Applied Project Poster_Final
Chad Hyslop - Applied Project Poster_FinalChad Hyslop - Applied Project Poster_Final
Chad Hyslop - Applied Project Poster_FinalChad Hyslop
 
MR Elastography
MR ElastographyMR Elastography
MR Elastography
Inas Elfiky
 
Presentation1.pptx, perfusiona and specroscopy imaging in brain tumour.
Presentation1.pptx, perfusiona and specroscopy imaging in brain tumour.Presentation1.pptx, perfusiona and specroscopy imaging in brain tumour.
Presentation1.pptx, perfusiona and specroscopy imaging in brain tumour.Abdellah Nazeer
 
Hersenperfusie en het theorema van Bayes - Dr. P. Seynaeve
Hersenperfusie en het theorema van Bayes - Dr. P. SeynaeveHersenperfusie en het theorema van Bayes - Dr. P. Seynaeve
Hersenperfusie en het theorema van Bayes - Dr. P. Seynaeve
Eric Tack
 
Susceptibility Weighted Imaging (SWI)
Susceptibility Weighted Imaging (SWI)Susceptibility Weighted Imaging (SWI)
Susceptibility Weighted Imaging (SWI)
Nija Panchal
 
Discrete Wavelet Transform Based Brain Tumor Detection using Haar Algorithm
Discrete Wavelet Transform Based Brain Tumor Detection using Haar AlgorithmDiscrete Wavelet Transform Based Brain Tumor Detection using Haar Algorithm
Discrete Wavelet Transform Based Brain Tumor Detection using Haar Algorithm
IIRindia
 
Myocardial triglyceride Cardiac Amyloidosis MR Spectroscopy
Myocardial triglyceride Cardiac Amyloidosis MR SpectroscopyMyocardial triglyceride Cardiac Amyloidosis MR Spectroscopy
Myocardial triglyceride Cardiac Amyloidosis MR Spectroscopy
PRAMOD KUMAR
 
Oncology imaging
Oncology imagingOncology imaging
Oncology imaging
DrAyush Garg
 
Patient data acquisition and treatment verification.pptx
Patient data acquisition and treatment verification.pptxPatient data acquisition and treatment verification.pptx
Patient data acquisition and treatment verification.pptx
Juliyet K Joy
 
DWI/ ADC -MRI principles in veterinary medicine
DWI/ ADC -MRI  principles in veterinary medicineDWI/ ADC -MRI  principles in veterinary medicine
DWI/ ADC -MRI principles in veterinary medicine
Robert Cruz
 

Similar to Perfusion and dynamic contrast enhanced mri (20)

Advances in neuro-imaging
Advances in neuro-imaging Advances in neuro-imaging
Advances in neuro-imaging
 
CT_Perfusion.pptx
CT_Perfusion.pptxCT_Perfusion.pptx
CT_Perfusion.pptx
 
Stroke-2014
Stroke-2014Stroke-2014
Stroke-2014
 
Quantitative CT and MR Imaging of Liver
Quantitative CT and MR Imaging of Liver Quantitative CT and MR Imaging of Liver
Quantitative CT and MR Imaging of Liver
 
QILiverfinal.pptx
QILiverfinal.pptxQILiverfinal.pptx
QILiverfinal.pptx
 
Cardiac MRI
Cardiac MRICardiac MRI
Cardiac MRI
 
Ecr2011 c 0603 (1)
Ecr2011 c 0603 (1)Ecr2011 c 0603 (1)
Ecr2011 c 0603 (1)
 
Chad Hyslop - Applied Project Poster_Final
Chad Hyslop - Applied Project Poster_FinalChad Hyslop - Applied Project Poster_Final
Chad Hyslop - Applied Project Poster_Final
 
MR Elastography
MR ElastographyMR Elastography
MR Elastography
 
Presentation1.pptx, perfusiona and specroscopy imaging in brain tumour.
Presentation1.pptx, perfusiona and specroscopy imaging in brain tumour.Presentation1.pptx, perfusiona and specroscopy imaging in brain tumour.
Presentation1.pptx, perfusiona and specroscopy imaging in brain tumour.
 
Hersenperfusie en het theorema van Bayes - Dr. P. Seynaeve
Hersenperfusie en het theorema van Bayes - Dr. P. SeynaeveHersenperfusie en het theorema van Bayes - Dr. P. Seynaeve
Hersenperfusie en het theorema van Bayes - Dr. P. Seynaeve
 
Susceptibility Weighted Imaging (SWI)
Susceptibility Weighted Imaging (SWI)Susceptibility Weighted Imaging (SWI)
Susceptibility Weighted Imaging (SWI)
 
Discrete Wavelet Transform Based Brain Tumor Detection using Haar Algorithm
Discrete Wavelet Transform Based Brain Tumor Detection using Haar AlgorithmDiscrete Wavelet Transform Based Brain Tumor Detection using Haar Algorithm
Discrete Wavelet Transform Based Brain Tumor Detection using Haar Algorithm
 
Journal club
Journal clubJournal club
Journal club
 
Myocardial triglyceride Cardiac Amyloidosis MR Spectroscopy
Myocardial triglyceride Cardiac Amyloidosis MR SpectroscopyMyocardial triglyceride Cardiac Amyloidosis MR Spectroscopy
Myocardial triglyceride Cardiac Amyloidosis MR Spectroscopy
 
Fluckiger_myo_sat
Fluckiger_myo_satFluckiger_myo_sat
Fluckiger_myo_sat
 
Oncology imaging
Oncology imagingOncology imaging
Oncology imaging
 
4D Flow MRI
4D Flow MRI4D Flow MRI
4D Flow MRI
 
Patient data acquisition and treatment verification.pptx
Patient data acquisition and treatment verification.pptxPatient data acquisition and treatment verification.pptx
Patient data acquisition and treatment verification.pptx
 
DWI/ ADC -MRI principles in veterinary medicine
DWI/ ADC -MRI  principles in veterinary medicineDWI/ ADC -MRI  principles in veterinary medicine
DWI/ ADC -MRI principles in veterinary medicine
 

More from fahad shafi

Spinal neoplasms
Spinal neoplasmsSpinal neoplasms
Spinal neoplasms
fahad shafi
 
Intra ventricular neoplasms
Intra ventricular neoplasmsIntra ventricular neoplasms
Intra ventricular neoplasms
fahad shafi
 
Advances in neuroimaging
Advances in neuroimagingAdvances in neuroimaging
Advances in neuroimaging
fahad shafi
 
Ppt
PptPpt
Arterialsupplyoftheabdomen aorta-
Arterialsupplyoftheabdomen aorta-Arterialsupplyoftheabdomen aorta-
Arterialsupplyoftheabdomen aorta-
fahad shafi
 
Contrast agents ppt
Contrast agents pptContrast agents ppt
Contrast agents ppt
fahad shafi
 
Imaging in breast cancer
Imaging in breast cancerImaging in breast cancer
Imaging in breast cancer
fahad shafi
 
Mediastinum
MediastinumMediastinum
Mediastinum
fahad shafi
 

More from fahad shafi (8)

Spinal neoplasms
Spinal neoplasmsSpinal neoplasms
Spinal neoplasms
 
Intra ventricular neoplasms
Intra ventricular neoplasmsIntra ventricular neoplasms
Intra ventricular neoplasms
 
Advances in neuroimaging
Advances in neuroimagingAdvances in neuroimaging
Advances in neuroimaging
 
Ppt
PptPpt
Ppt
 
Arterialsupplyoftheabdomen aorta-
Arterialsupplyoftheabdomen aorta-Arterialsupplyoftheabdomen aorta-
Arterialsupplyoftheabdomen aorta-
 
Contrast agents ppt
Contrast agents pptContrast agents ppt
Contrast agents ppt
 
Imaging in breast cancer
Imaging in breast cancerImaging in breast cancer
Imaging in breast cancer
 
Mediastinum
MediastinumMediastinum
Mediastinum
 

Recently uploaded

Charaka Samhita Sutra Sthana 9 Chapter khuddakachatuspadadhyaya
Charaka Samhita Sutra Sthana 9 Chapter khuddakachatuspadadhyayaCharaka Samhita Sutra Sthana 9 Chapter khuddakachatuspadadhyaya
Charaka Samhita Sutra Sthana 9 Chapter khuddakachatuspadadhyaya
Dr KHALID B.M
 
ARTIFICIAL INTELLIGENCE IN HEALTHCARE.pdf
ARTIFICIAL INTELLIGENCE IN  HEALTHCARE.pdfARTIFICIAL INTELLIGENCE IN  HEALTHCARE.pdf
ARTIFICIAL INTELLIGENCE IN HEALTHCARE.pdf
Anujkumaranit
 
24 Upakrama.pptx class ppt useful in all
24 Upakrama.pptx class ppt useful in all24 Upakrama.pptx class ppt useful in all
24 Upakrama.pptx class ppt useful in all
DrSathishMS1
 
ARTHROLOGY PPT NCISM SYLLABUS AYURVEDA STUDENTS
ARTHROLOGY PPT NCISM SYLLABUS AYURVEDA STUDENTSARTHROLOGY PPT NCISM SYLLABUS AYURVEDA STUDENTS
ARTHROLOGY PPT NCISM SYLLABUS AYURVEDA STUDENTS
Dr. Vinay Pareek
 
The POPPY STUDY (Preconception to post-partum cardiovascular function in prim...
The POPPY STUDY (Preconception to post-partum cardiovascular function in prim...The POPPY STUDY (Preconception to post-partum cardiovascular function in prim...
The POPPY STUDY (Preconception to post-partum cardiovascular function in prim...
Catherine Liao
 
Factory Supply Best Quality Pmk Oil CAS 28578–16–7 PMK Powder in Stock
Factory Supply Best Quality Pmk Oil CAS 28578–16–7 PMK Powder in StockFactory Supply Best Quality Pmk Oil CAS 28578–16–7 PMK Powder in Stock
Factory Supply Best Quality Pmk Oil CAS 28578–16–7 PMK Powder in Stock
rebeccabio
 
Are There Any Natural Remedies To Treat Syphilis.pdf
Are There Any Natural Remedies To Treat Syphilis.pdfAre There Any Natural Remedies To Treat Syphilis.pdf
Are There Any Natural Remedies To Treat Syphilis.pdf
Little Cross Family Clinic
 
Physiology of Special Chemical Sensation of Taste
Physiology of Special Chemical Sensation of TastePhysiology of Special Chemical Sensation of Taste
Physiology of Special Chemical Sensation of Taste
MedicoseAcademics
 
heat stroke and heat exhaustion in children
heat stroke and heat exhaustion in childrenheat stroke and heat exhaustion in children
heat stroke and heat exhaustion in children
SumeraAhmad5
 
Tom Selleck Health: A Comprehensive Look at the Iconic Actor’s Wellness Journey
Tom Selleck Health: A Comprehensive Look at the Iconic Actor’s Wellness JourneyTom Selleck Health: A Comprehensive Look at the Iconic Actor’s Wellness Journey
Tom Selleck Health: A Comprehensive Look at the Iconic Actor’s Wellness Journey
greendigital
 
Superficial & Deep Fascia of the NECK.pptx
Superficial & Deep Fascia of the NECK.pptxSuperficial & Deep Fascia of the NECK.pptx
Superficial & Deep Fascia of the NECK.pptx
Dr. Rabia Inam Gandapore
 
Maxilla, Mandible & Hyoid Bone & Clinical Correlations by Dr. RIG.pptx
Maxilla, Mandible & Hyoid Bone & Clinical Correlations by Dr. RIG.pptxMaxilla, Mandible & Hyoid Bone & Clinical Correlations by Dr. RIG.pptx
Maxilla, Mandible & Hyoid Bone & Clinical Correlations by Dr. RIG.pptx
Dr. Rabia Inam Gandapore
 
Report Back from SGO 2024: What’s the Latest in Cervical Cancer?
Report Back from SGO 2024: What’s the Latest in Cervical Cancer?Report Back from SGO 2024: What’s the Latest in Cervical Cancer?
Report Back from SGO 2024: What’s the Latest in Cervical Cancer?
bkling
 
Phone Us ❤85270-49040❤ #ℂall #gIRLS In Surat By Surat @ℂall @Girls Hotel With...
Phone Us ❤85270-49040❤ #ℂall #gIRLS In Surat By Surat @ℂall @Girls Hotel With...Phone Us ❤85270-49040❤ #ℂall #gIRLS In Surat By Surat @ℂall @Girls Hotel With...
Phone Us ❤85270-49040❤ #ℂall #gIRLS In Surat By Surat @ℂall @Girls Hotel With...
Savita Shen $i11
 
Couples presenting to the infertility clinic- Do they really have infertility...
Couples presenting to the infertility clinic- Do they really have infertility...Couples presenting to the infertility clinic- Do they really have infertility...
Couples presenting to the infertility clinic- Do they really have infertility...
Sujoy Dasgupta
 
ANATOMY AND PHYSIOLOGY OF URINARY SYSTEM.pptx
ANATOMY AND PHYSIOLOGY OF URINARY SYSTEM.pptxANATOMY AND PHYSIOLOGY OF URINARY SYSTEM.pptx
ANATOMY AND PHYSIOLOGY OF URINARY SYSTEM.pptx
Swetaba Besh
 
Alcohol_Dr. Jeenal Mistry MD Pharmacology.pdf
Alcohol_Dr. Jeenal Mistry MD Pharmacology.pdfAlcohol_Dr. Jeenal Mistry MD Pharmacology.pdf
Alcohol_Dr. Jeenal Mistry MD Pharmacology.pdf
Dr Jeenal Mistry
 
Ocular injury ppt Upendra pal optometrist upums saifai etawah
Ocular injury  ppt  Upendra pal  optometrist upums saifai etawahOcular injury  ppt  Upendra pal  optometrist upums saifai etawah
Ocular injury ppt Upendra pal optometrist upums saifai etawah
pal078100
 
KDIGO 2024 guidelines for diabetologists
KDIGO 2024 guidelines for diabetologistsKDIGO 2024 guidelines for diabetologists
KDIGO 2024 guidelines for diabetologists
د.محمود نجيب
 
BRACHYTHERAPY OVERVIEW AND APPLICATORS
BRACHYTHERAPY OVERVIEW  AND  APPLICATORSBRACHYTHERAPY OVERVIEW  AND  APPLICATORS
BRACHYTHERAPY OVERVIEW AND APPLICATORS
Krishan Murari
 

Recently uploaded (20)

Charaka Samhita Sutra Sthana 9 Chapter khuddakachatuspadadhyaya
Charaka Samhita Sutra Sthana 9 Chapter khuddakachatuspadadhyayaCharaka Samhita Sutra Sthana 9 Chapter khuddakachatuspadadhyaya
Charaka Samhita Sutra Sthana 9 Chapter khuddakachatuspadadhyaya
 
ARTIFICIAL INTELLIGENCE IN HEALTHCARE.pdf
ARTIFICIAL INTELLIGENCE IN  HEALTHCARE.pdfARTIFICIAL INTELLIGENCE IN  HEALTHCARE.pdf
ARTIFICIAL INTELLIGENCE IN HEALTHCARE.pdf
 
24 Upakrama.pptx class ppt useful in all
24 Upakrama.pptx class ppt useful in all24 Upakrama.pptx class ppt useful in all
24 Upakrama.pptx class ppt useful in all
 
ARTHROLOGY PPT NCISM SYLLABUS AYURVEDA STUDENTS
ARTHROLOGY PPT NCISM SYLLABUS AYURVEDA STUDENTSARTHROLOGY PPT NCISM SYLLABUS AYURVEDA STUDENTS
ARTHROLOGY PPT NCISM SYLLABUS AYURVEDA STUDENTS
 
The POPPY STUDY (Preconception to post-partum cardiovascular function in prim...
The POPPY STUDY (Preconception to post-partum cardiovascular function in prim...The POPPY STUDY (Preconception to post-partum cardiovascular function in prim...
The POPPY STUDY (Preconception to post-partum cardiovascular function in prim...
 
Factory Supply Best Quality Pmk Oil CAS 28578–16–7 PMK Powder in Stock
Factory Supply Best Quality Pmk Oil CAS 28578–16–7 PMK Powder in StockFactory Supply Best Quality Pmk Oil CAS 28578–16–7 PMK Powder in Stock
Factory Supply Best Quality Pmk Oil CAS 28578–16–7 PMK Powder in Stock
 
Are There Any Natural Remedies To Treat Syphilis.pdf
Are There Any Natural Remedies To Treat Syphilis.pdfAre There Any Natural Remedies To Treat Syphilis.pdf
Are There Any Natural Remedies To Treat Syphilis.pdf
 
Physiology of Special Chemical Sensation of Taste
Physiology of Special Chemical Sensation of TastePhysiology of Special Chemical Sensation of Taste
Physiology of Special Chemical Sensation of Taste
 
heat stroke and heat exhaustion in children
heat stroke and heat exhaustion in childrenheat stroke and heat exhaustion in children
heat stroke and heat exhaustion in children
 
Tom Selleck Health: A Comprehensive Look at the Iconic Actor’s Wellness Journey
Tom Selleck Health: A Comprehensive Look at the Iconic Actor’s Wellness JourneyTom Selleck Health: A Comprehensive Look at the Iconic Actor’s Wellness Journey
Tom Selleck Health: A Comprehensive Look at the Iconic Actor’s Wellness Journey
 
Superficial & Deep Fascia of the NECK.pptx
Superficial & Deep Fascia of the NECK.pptxSuperficial & Deep Fascia of the NECK.pptx
Superficial & Deep Fascia of the NECK.pptx
 
Maxilla, Mandible & Hyoid Bone & Clinical Correlations by Dr. RIG.pptx
Maxilla, Mandible & Hyoid Bone & Clinical Correlations by Dr. RIG.pptxMaxilla, Mandible & Hyoid Bone & Clinical Correlations by Dr. RIG.pptx
Maxilla, Mandible & Hyoid Bone & Clinical Correlations by Dr. RIG.pptx
 
Report Back from SGO 2024: What’s the Latest in Cervical Cancer?
Report Back from SGO 2024: What’s the Latest in Cervical Cancer?Report Back from SGO 2024: What’s the Latest in Cervical Cancer?
Report Back from SGO 2024: What’s the Latest in Cervical Cancer?
 
Phone Us ❤85270-49040❤ #ℂall #gIRLS In Surat By Surat @ℂall @Girls Hotel With...
Phone Us ❤85270-49040❤ #ℂall #gIRLS In Surat By Surat @ℂall @Girls Hotel With...Phone Us ❤85270-49040❤ #ℂall #gIRLS In Surat By Surat @ℂall @Girls Hotel With...
Phone Us ❤85270-49040❤ #ℂall #gIRLS In Surat By Surat @ℂall @Girls Hotel With...
 
Couples presenting to the infertility clinic- Do they really have infertility...
Couples presenting to the infertility clinic- Do they really have infertility...Couples presenting to the infertility clinic- Do they really have infertility...
Couples presenting to the infertility clinic- Do they really have infertility...
 
ANATOMY AND PHYSIOLOGY OF URINARY SYSTEM.pptx
ANATOMY AND PHYSIOLOGY OF URINARY SYSTEM.pptxANATOMY AND PHYSIOLOGY OF URINARY SYSTEM.pptx
ANATOMY AND PHYSIOLOGY OF URINARY SYSTEM.pptx
 
Alcohol_Dr. Jeenal Mistry MD Pharmacology.pdf
Alcohol_Dr. Jeenal Mistry MD Pharmacology.pdfAlcohol_Dr. Jeenal Mistry MD Pharmacology.pdf
Alcohol_Dr. Jeenal Mistry MD Pharmacology.pdf
 
Ocular injury ppt Upendra pal optometrist upums saifai etawah
Ocular injury  ppt  Upendra pal  optometrist upums saifai etawahOcular injury  ppt  Upendra pal  optometrist upums saifai etawah
Ocular injury ppt Upendra pal optometrist upums saifai etawah
 
KDIGO 2024 guidelines for diabetologists
KDIGO 2024 guidelines for diabetologistsKDIGO 2024 guidelines for diabetologists
KDIGO 2024 guidelines for diabetologists
 
BRACHYTHERAPY OVERVIEW AND APPLICATORS
BRACHYTHERAPY OVERVIEW  AND  APPLICATORSBRACHYTHERAPY OVERVIEW  AND  APPLICATORS
BRACHYTHERAPY OVERVIEW AND APPLICATORS
 

Perfusion and dynamic contrast enhanced mri

  • 1. Presented by Dr Fahad Shafi
  • 2.  Perfusion refers to the passage of blood from an arterial supply to venous drainage through the microcirculation.  perfusion imaging provides hemodynamic information that complements the anatomic information attainable with conventional imaging.
  • 3.  Measurement of tissue perfusion depends on the ability to serially measure concentration of a tracer agent in a target organ of interest. Exogenous tracers such as iced saline solution, iodinated radiographic contrast material, and radionuclides have been used .  With the advent of MR imaging, exogenous tracer agents, such as paramagnetic contrast material, and endogenous tracer agents, such as magnetically labeled blood, have been used
  • 4. Exogenous Tracer Methods  Dynamic Susceptibility Contrast-enhanced MR Perfusion.  Dynamic Contrast Enhanced MR Perfusion
  • 5. Dynamic Susceptibility Contrast- enhanced MR Perfusion  Exploits the T2* susceptibility effects of gadolinium, rather than the T1 shortening effects routinely associated with contrast enhancement on conventional imaging.  Signal loss resulting from passage of the contrast agent bolus on T2* weighted images can be used to calculate the change in contrast concentration occurring in each pixel
  • 6.
  • 7. Image acquisition  Comfortably positioned.  Data is acquired by using a fast imaging technique, such as single or multishot echo planar imaging (EPI) to produce a temporal resolution of approximately 2 seconds.  The imaging sequence may be gradient echo which will maximize T2* weighting or alternatively a spin echo approach can be used which will minimize the signal contribution from large vessels.  A series of at least five pre-contrast images should be collected prior to the passage of the bolus to improve the estimation of the signal intensity baseline during analysis.  A standard contrast dose (0.1 mmol/kg) is adequate in most cases although double dose of gadolinium (0.2 mmol/Kg) may be used to improve signal to noise ratio.  The contrast is usually injected via an 18- or 20-gauge IV catheter at a high rate (3-7 mL/sec) using a power injector. The injection should be followed by a saline flush of at least 25 mL (20-30 mL) in order to ensure that the bolus, which enters the central circulation is as coherent as possible
  • 8. Data analysis:  The drop in T2* signal caused by the susceptibility effects of gadolinium is computed on a voxel-by-voxel basis and used to construct a time-versus intensity curve.  The degree of signal drop is then assumed to be proportional to the tissue concentration of gadolinium, so that relative concentration-time curves can be obtained (delta R2 curves)
  • 9. Figure shows data analysis in DSC perfusion. (A) Time-versus MR signal intensity curve where signal intensity decrease during passage of contrast agent bolus and is measured from a series of MR images. (B) Tissue concentration-versus time curve where change in the relaxation rate (ΔR2*) is calculated from signal intensity, and a baseline subtraction method is applied to measured data. (C) Corrected ΔR2* curve after leakage correction
  • 10. To obtain tissue response function, arterial concentration-time curve, or arterial input function, must be deconvolved from measured tissue concentration-time curve. This arterial input function may be derived directly from imaging data
  • 11. Problems with DSC MRI:  Contrast recirculation  Contrast leakage and tissue enhancement  Bolus dispersion and the measurement of absolute CBF
  • 12. Dynamic Contrast Enhanced MR Perfusion  provides insight into the nature of the tissue properties at the microvascular level by demonstrating the wash-in, plateau, and washout contrast kinetics of the tissue.  also referred as ‘permeability’ MRI, is an entirely different approach to MR perfusion as the main focus is on estimating tumor permeability
  • 13.  main advantage of T1- based techniques is that tumor leakiness (enhancement) is used for data analysis rather than considering it as an artifact as in DSC MRP.  It has been established that quantification of contrast leakage can provide powerful indicators of the state of neovascular angiogenesis in pathologies, such as tumors and inflammatory tissue;
  • 14. Principle:  measures the ‘relaxivity effects’ of the paramagnetic contrast material.  DCE MRP is based on a two-compartmental (plasma space and extravascular-extracellular space) pharmacokinetic model
  • 15. Dynamic contrast-enhanced MR perfusion: Two-compartment model demonstrates the exchange of contrast between plasma and extravascular- extracellular space
  • 16. Image acquisition:  perform baseline T1 mapping, acquire DCE MRP images, convert signal intensity data to gadolinium concentration, determine the vascular input function, and perform pharmacokinetic modeling.  lower dose of gadolinium is administered (typically a single dose of 0.1 mmol/kg) at a lower rate (2 mL/sec) and repetitive acquisitions are then made through the lesion at longer intervals, typically every 15 to 26 seconds
  • 17. Data analysis:  Simple analysis techniques: comparing the signal intensity curves from ROI.  simplest of these is a measurement of the time taken for the tumor tissue to attain 90 percent of its subsequent maximal enhancement (T90).  Various curve shapes can also provide insight into the quantification and calculates a standardized slope of the enhancement curve
  • 18.  Pharmacokinetic analysis techniques: several metrics are commonly derived: the transfer constant (ktrans), the fractional volume of the extravascular extracellular space (ve), the rate constant (kep, kep = ktrans/ve), and the fractional volume of the plasma space (vp).  intended to calculate the biological features, such as endothelial permeability and the endothelial surface area, which are relatively independent of imaging approach
  • 19. Problems with quantitative measurement of DCE MRI:  Partial volume averaging effects: excluding any voxel which produces values over a certain threshold (1.2/ min) as being vascular in origin or more complex pharmacokinetic models.  Long acquisition time: modifying the pharmacokinetic model and describing only the first passage of the contrast bolus. This technique also eliminates the problems with partial volume averaging described above and produces highly reproducible parametric maps of both ktrans and CBV.
  • 20.  Flow dependency of ktrans: in areas where there is contrast leakage and the blood flow is inadequate to replenish contrast at adequate rate; as a result plasma contrast concentration decreases and ktrans will reflect local blood flow.
  • 21. Endogenous Tracer Methods Arterial Spin Labeling MR Imaging  Arterial blood flowing towards the region of interest is tagged by magnetic inversion pulses (proton phase is changed). ↓  After a delay to allow for inflow of tagged blood, image is acquired in slice of interest. This image is called ‘tag image’. ↓  Second image without in-flowing tagged blood. This image is called ‘control image’.
  • 22. ↓  Tag image is subtracted from control image ↓  This results into perfusion image representing ‘tagged blood’ that flowed into the image slice.  It has poor SNR, however, ASL has better spatial and temporal resolution than PET. Poor SNR and sensitivity to abnormally long transit delays of tagged protons prevents its general application.
  • 23.
  • 24. APPLICATIONS  MR Perfusion in Stroke  Mismatch between PW and DW represent potentially salvageable tissue (penumbra). PW-DW mismatch is also indicator of clinical outcome. Small mismatch has good clinical outcome. Large mismatch is associated with poor clinical outcome and larger vessel occlusion.
  • 25.
  • 26.
  • 27.
  • 29.
  • 30. Other disorders  In addition to evaluation of ischemia and tumors, MR perfusion imaging has been applied to the study of various other neurologic and psychiatric disorders, such as dementia and migraine headaches .   The effects of psychoactive drugs, such as cocaine, have been studied as well (Kaufman MJ et al., presented at the International Society of Magnetic Resonance in Medicine, April 1996).  In the case of migraine headaches, decreases in cerebral blood volume and cerebral blood flow have been seen during the auras compared with the post-aura state (Sorensen AG et al., presented at the International Society of Magnetic Resonance in Medicine, April 1996).  In the case of dementia, decreases in cerebral blood volume in the temporal and parietal lobes of patients with Alzheimer's disease have correlated well with the results of SPECT studies on the same subjects
  • 31. DYNAMIC CONTRAST-ENHANCED MRI  malignant lesions usually show faster and higher levels of enhancement than normal tissue. This enhancement pattern of the malignant lesions reflects increased vascularity (neoangiogenesis) and higher endothelial permeability to the contrast molecules.  dynamic contrast-enhanced MRI (DCE-MRI) is modality of choice for the diagnosis and characterization of the tumors of the brain, breast, prostate, liver, cervix and musculoskeletal system
  • 32. Principle:  relies on fast MRI sequences obtained before, during and after the rapid intravenous (IV) administration of a gadolinium-based contrast agent.  DCE-MRI is sensitive to alterations in vascular permeability, extracellular space and blood flow. The DCE-MRI enables the depiction of physiologic alterations as well as morphologic changes.
  • 33. Image acquisition:  minimum of three sections  imaging volume that includes a region outside the tumor, such as an artery or muscle for normalization.  injected at a constant rate with a power injector typically using 3D T1-weighted acquisition.  Serial image sets are obtained sequentially every 5 seconds (ranging from 2–15 seconds) for up to 5 to 10 minutes.
  • 34. Data analysis:Qualitative or visual analysis is most readily accessible analytic but also the least standardized method
  • 35. Semi-quantitative analysis:  calculates various curve parameters and is also referred as curveology.  also based on the assumption of early and intense enhancement and washout as a predictor of malignancy.  Parameters are obtained to characterize the shape of the time-intensity curve, such as the time of first contrast uptake, time to peak, maximum slope, peak enhancement, and wash-in and washout curve shapes
  • 36.  There are three common dynamic curve types after initial uptake: type 1, persistent increase; type 2, plateau; and type 3, decline after initial upslope. Type 3 is considered to be indicator of malignancy.  semiquantitative approach is widely used and has the advantage of being simple to perform
  • 37.  It has limitations in terms of generalization across acquisition protocols, sequences, and all other factors contributing to the MR signal intensity, which in turn affect curve metrics, such as maximum enhancement and washout percentage.
  • 38. Quantitative analysis:  Quantitative analysis is most generalizable but most complex method.  It depends on contrast concentration curves over time and use pharmacokinetic models to calculate permeability constants.  fundamental limitation of DCE-MRI, namely the parameters it generates are inherently ambiguous with regard to their physiologic significance.