1) Computed tomography perfusion allows functional evaluation of tissue vascularity by measuring temporal changes in tissue density after intravenous injection of contrast media using dynamically acquired CT images.
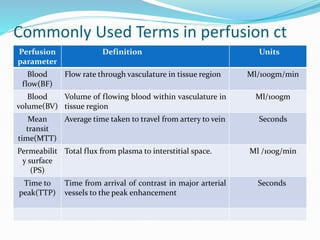
2) The technique involves an initial baseline CT scan without contrast followed by a dynamic scan after IV contrast injection to assess perfusion parameters like blood flow, blood volume, mean transit time and permeability.
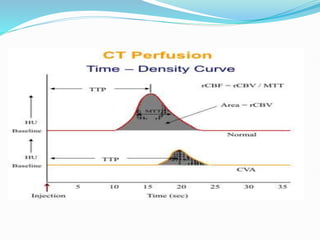
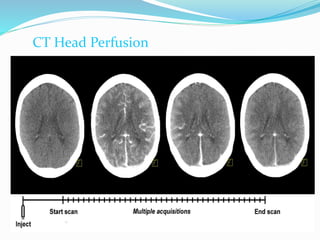
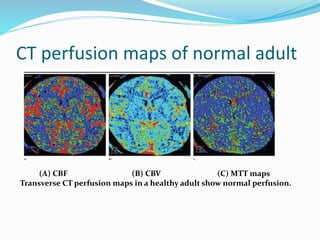
3) Post-processing of CT data generates color-coded perfusion maps and time-attenuation curves to evaluate tissue enhancement characteristics during the first-pass and delayed phases of contrast administration.