Downloaded 796 times


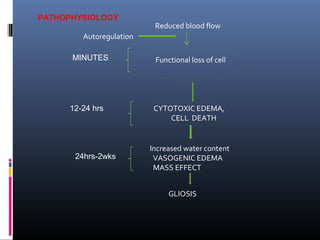
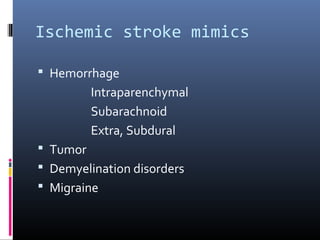
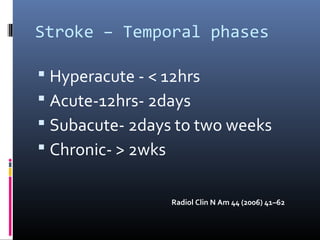


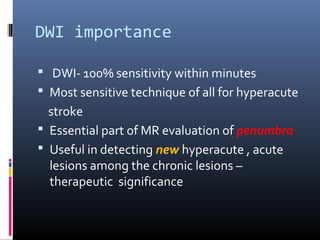
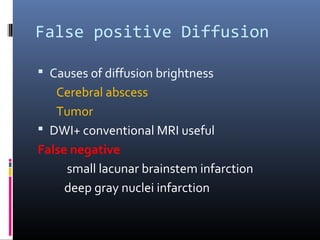

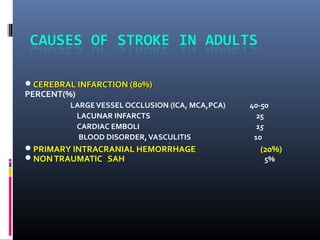
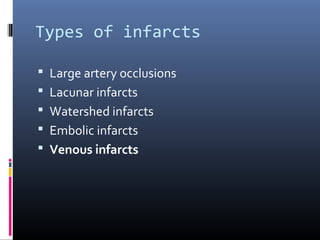


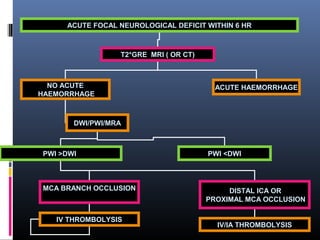


The document discusses the role of imaging in ischemic stroke, including definitions, pathophysiology, types of imaging techniques, and their clinical significance. It covers various imaging modalities such as non-contrast computed tomography (NCCT), magnetic resonance imaging (MRI), diffusion-weighted imaging (DWI), and others, highlighting their utility in identifying ischemic strokes and differentiating them from mimics like hemorrhage. Additionally, it addresses techniques for evaluating ischemic penumbra and the importance of timely imaging for effective treatment.


![CASE_PRESENTATION_ON_subdural_hematoma(SDH)[1 FINAL PPT]-1.pptx](https://cdn.slidesharecdn.com/ss_thumbnails/casepresentationonsubduralhematomasdh1finalppt-1-260129172522-d405d375-thumbnail.jpg?width=640&height=640&fit=bounds)


