Downloaded 308 times
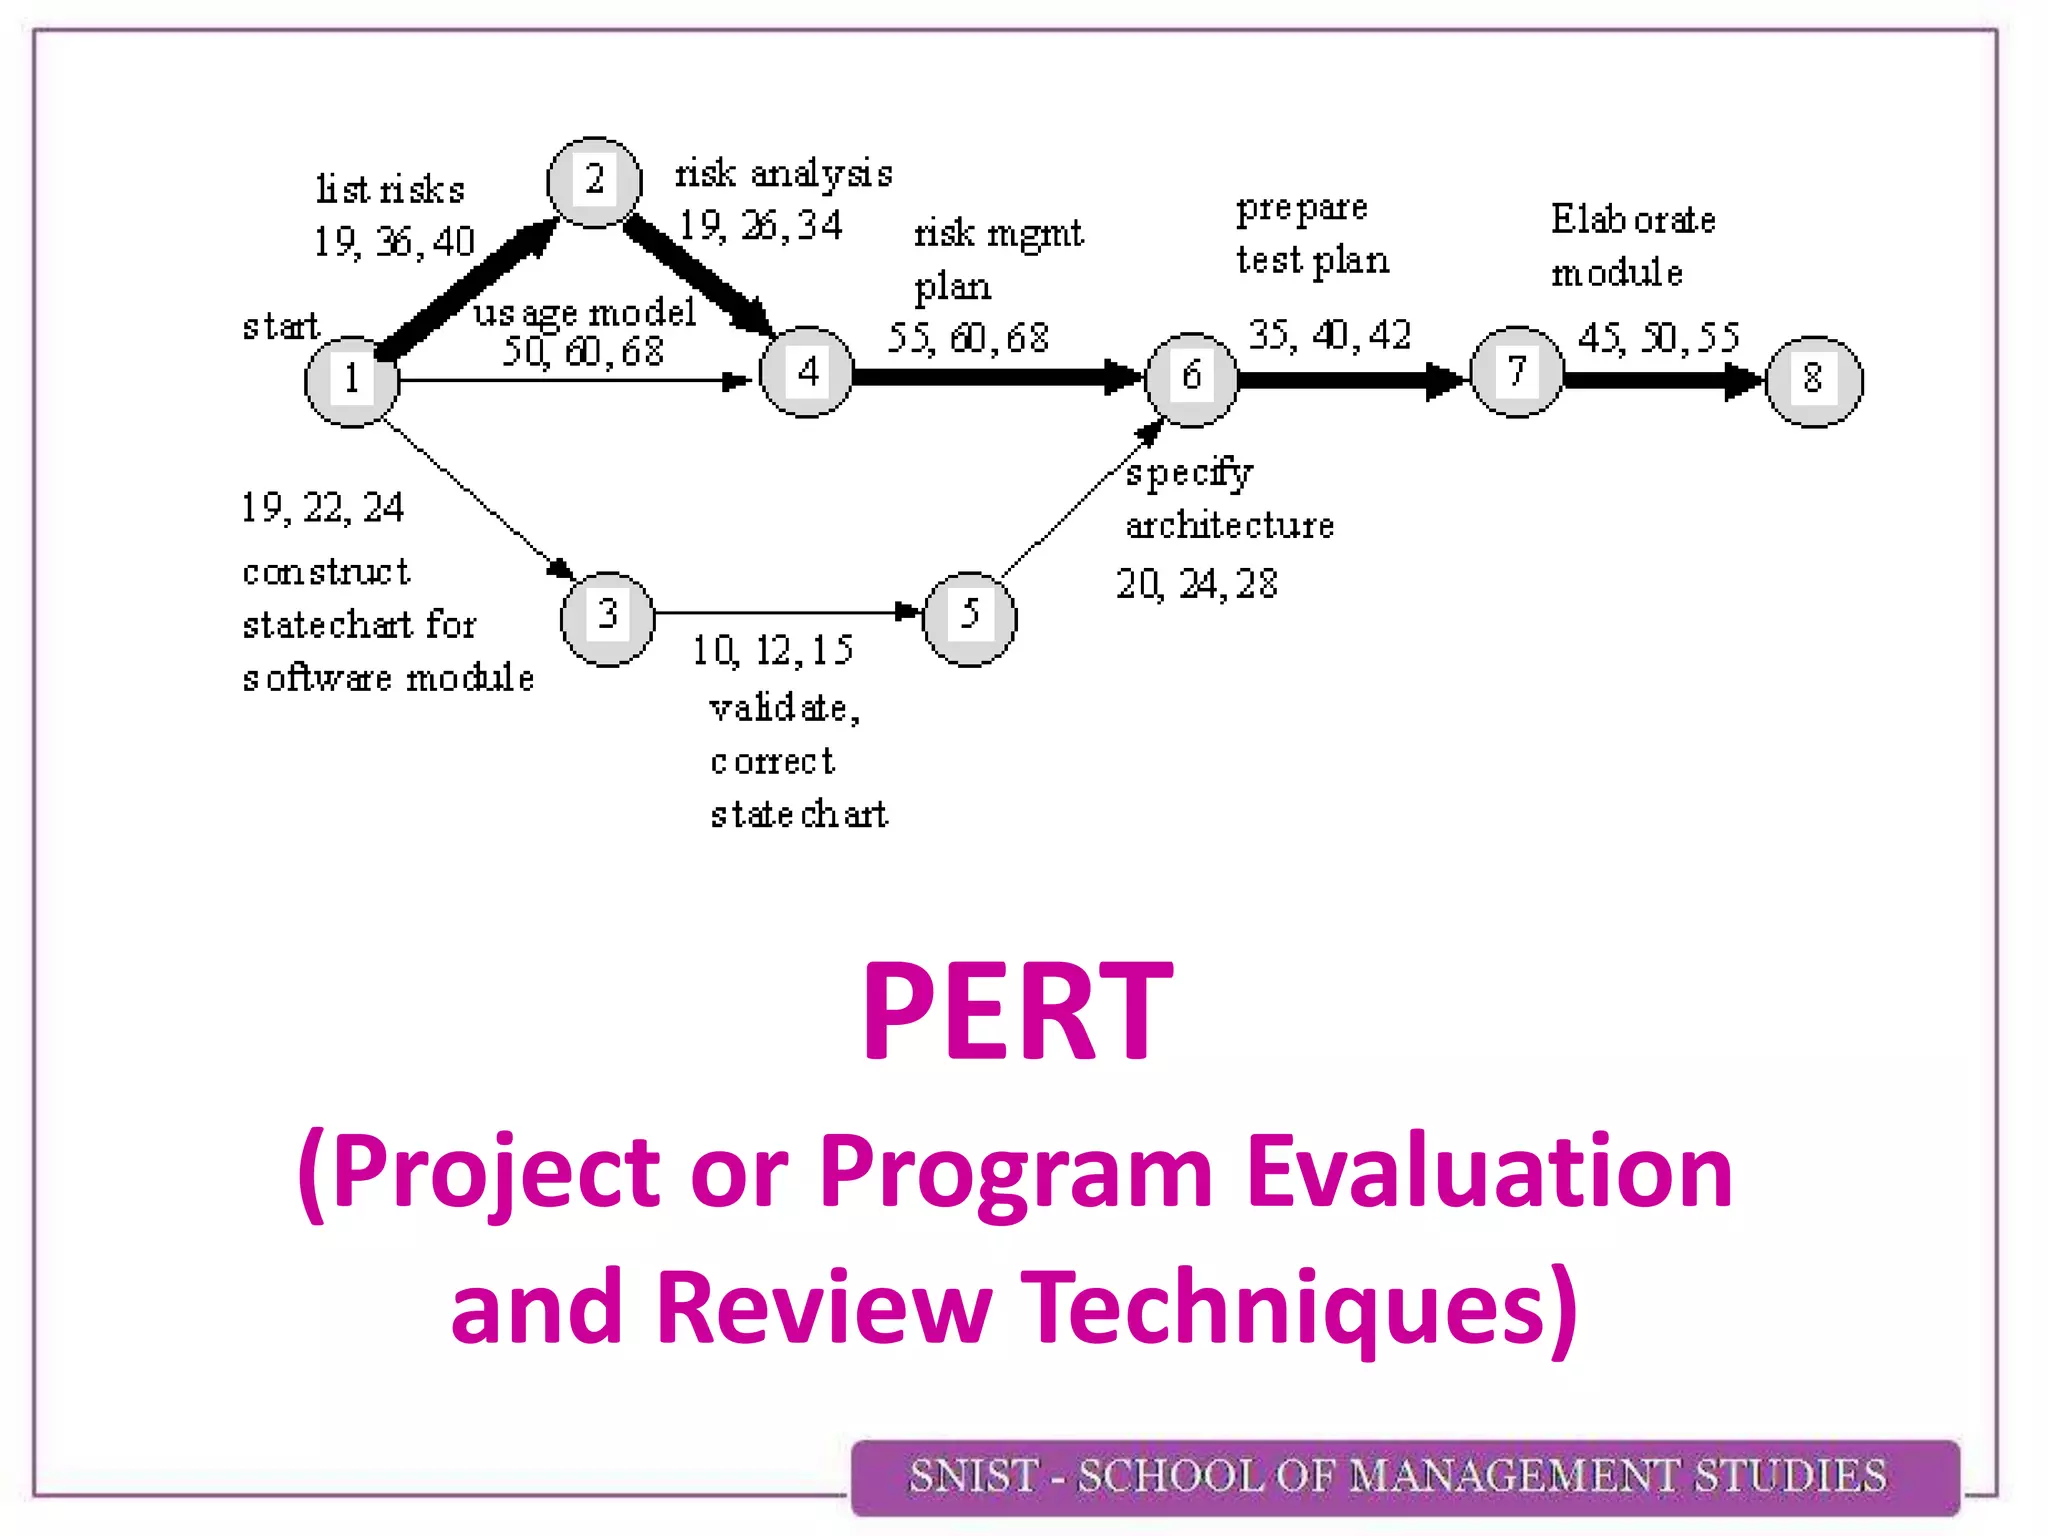
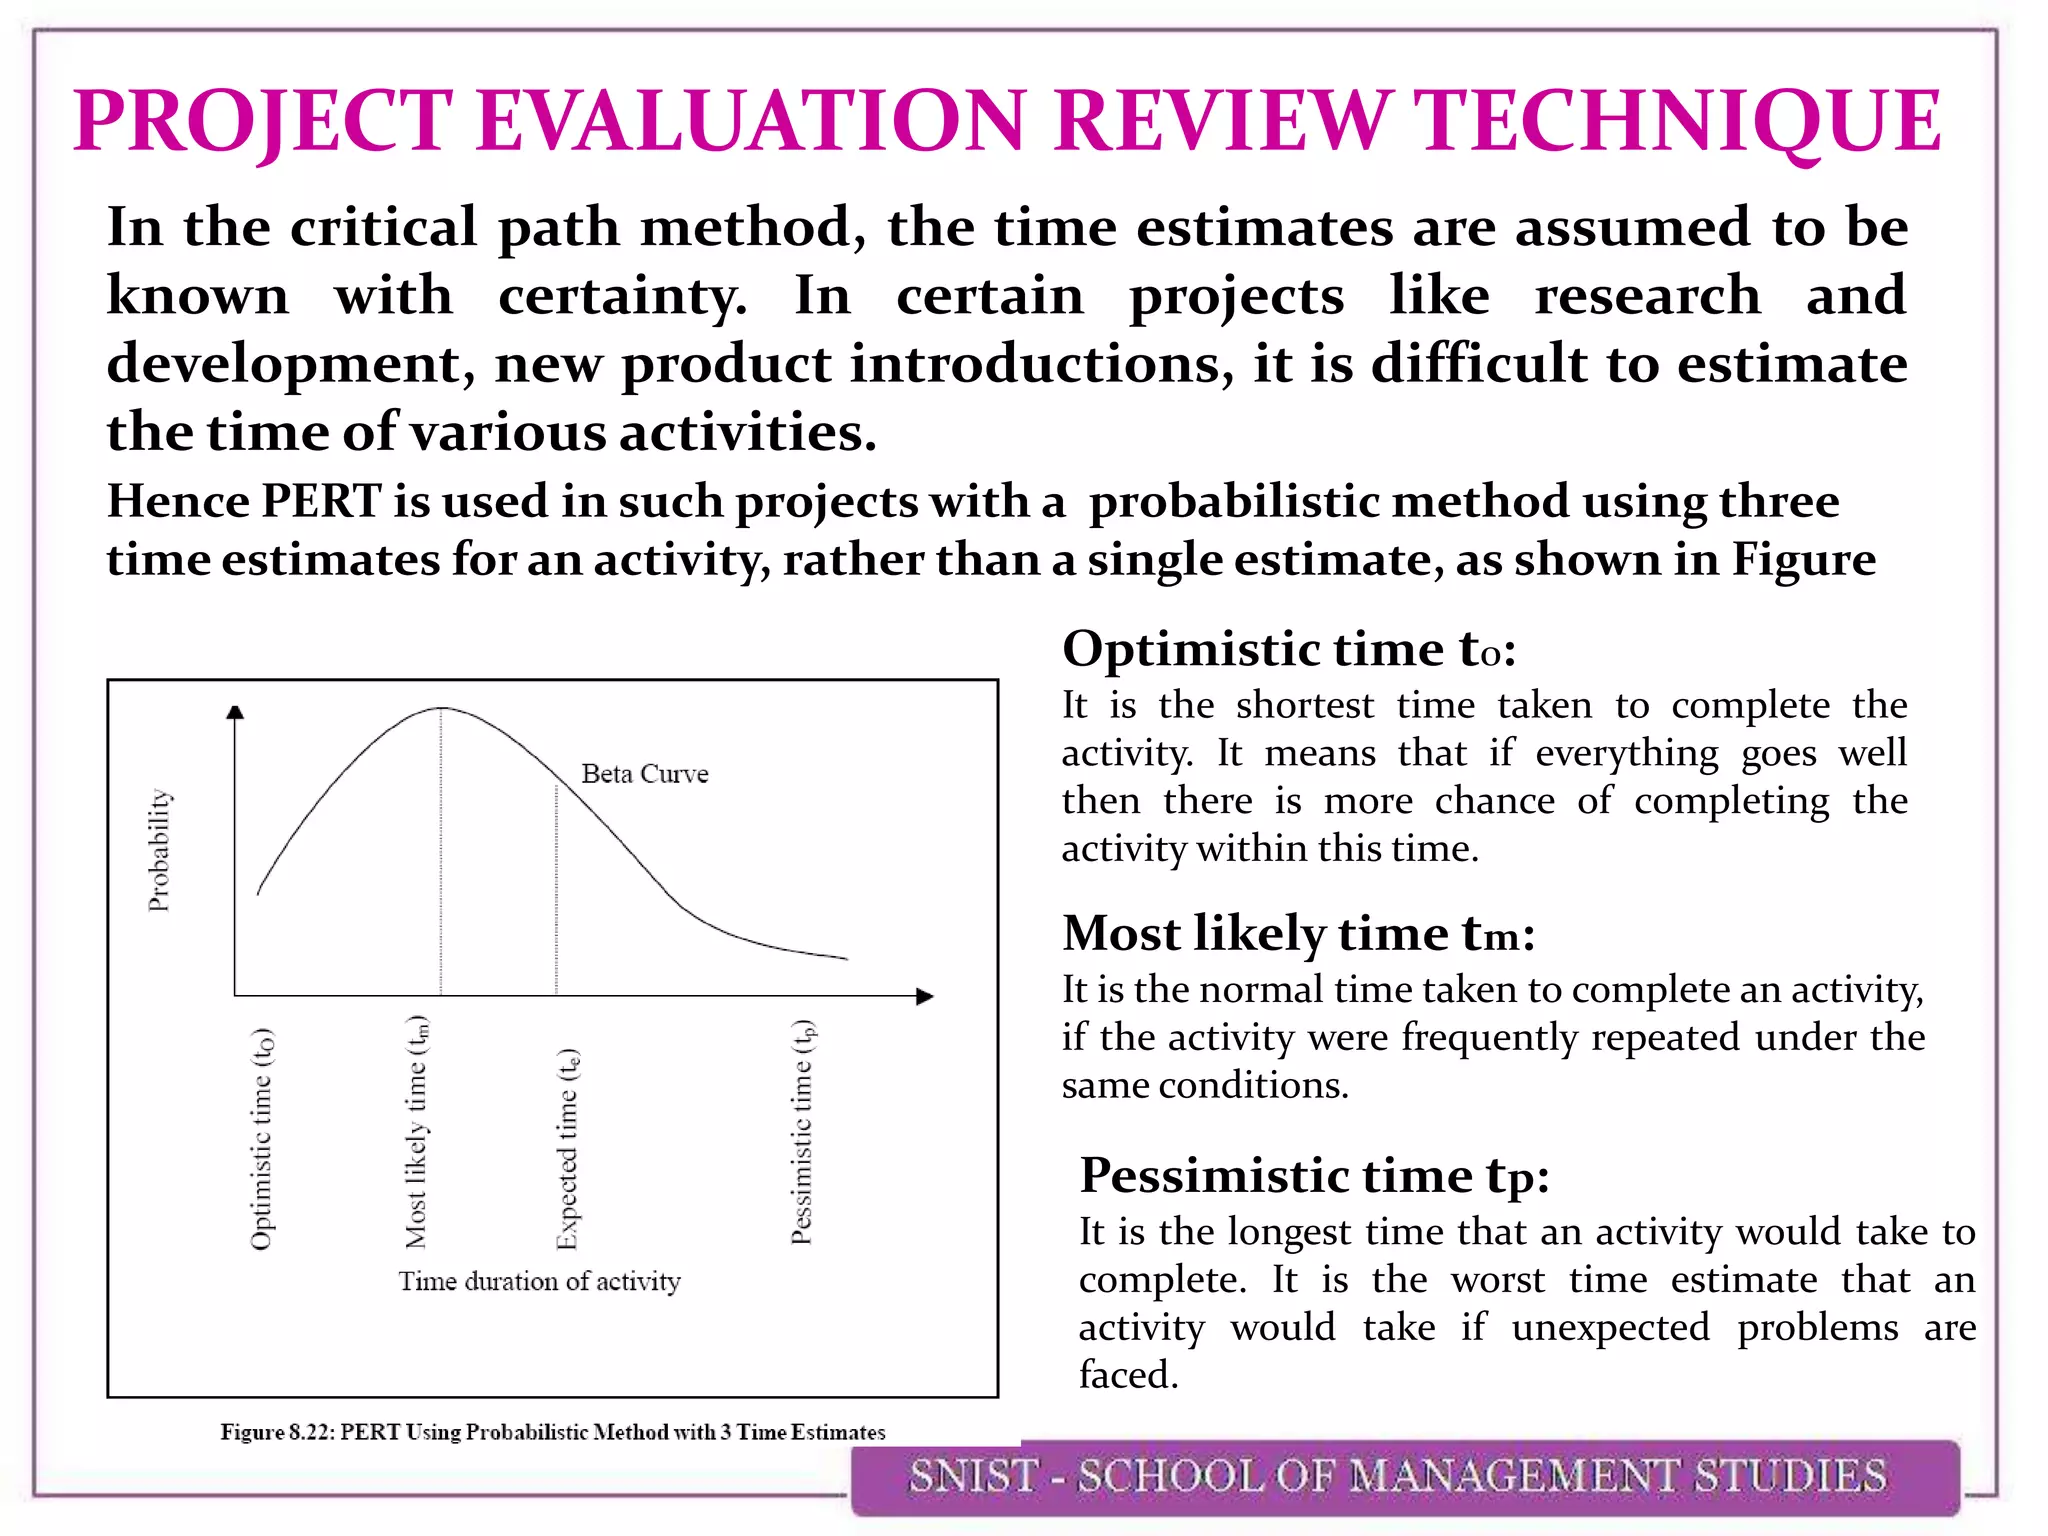
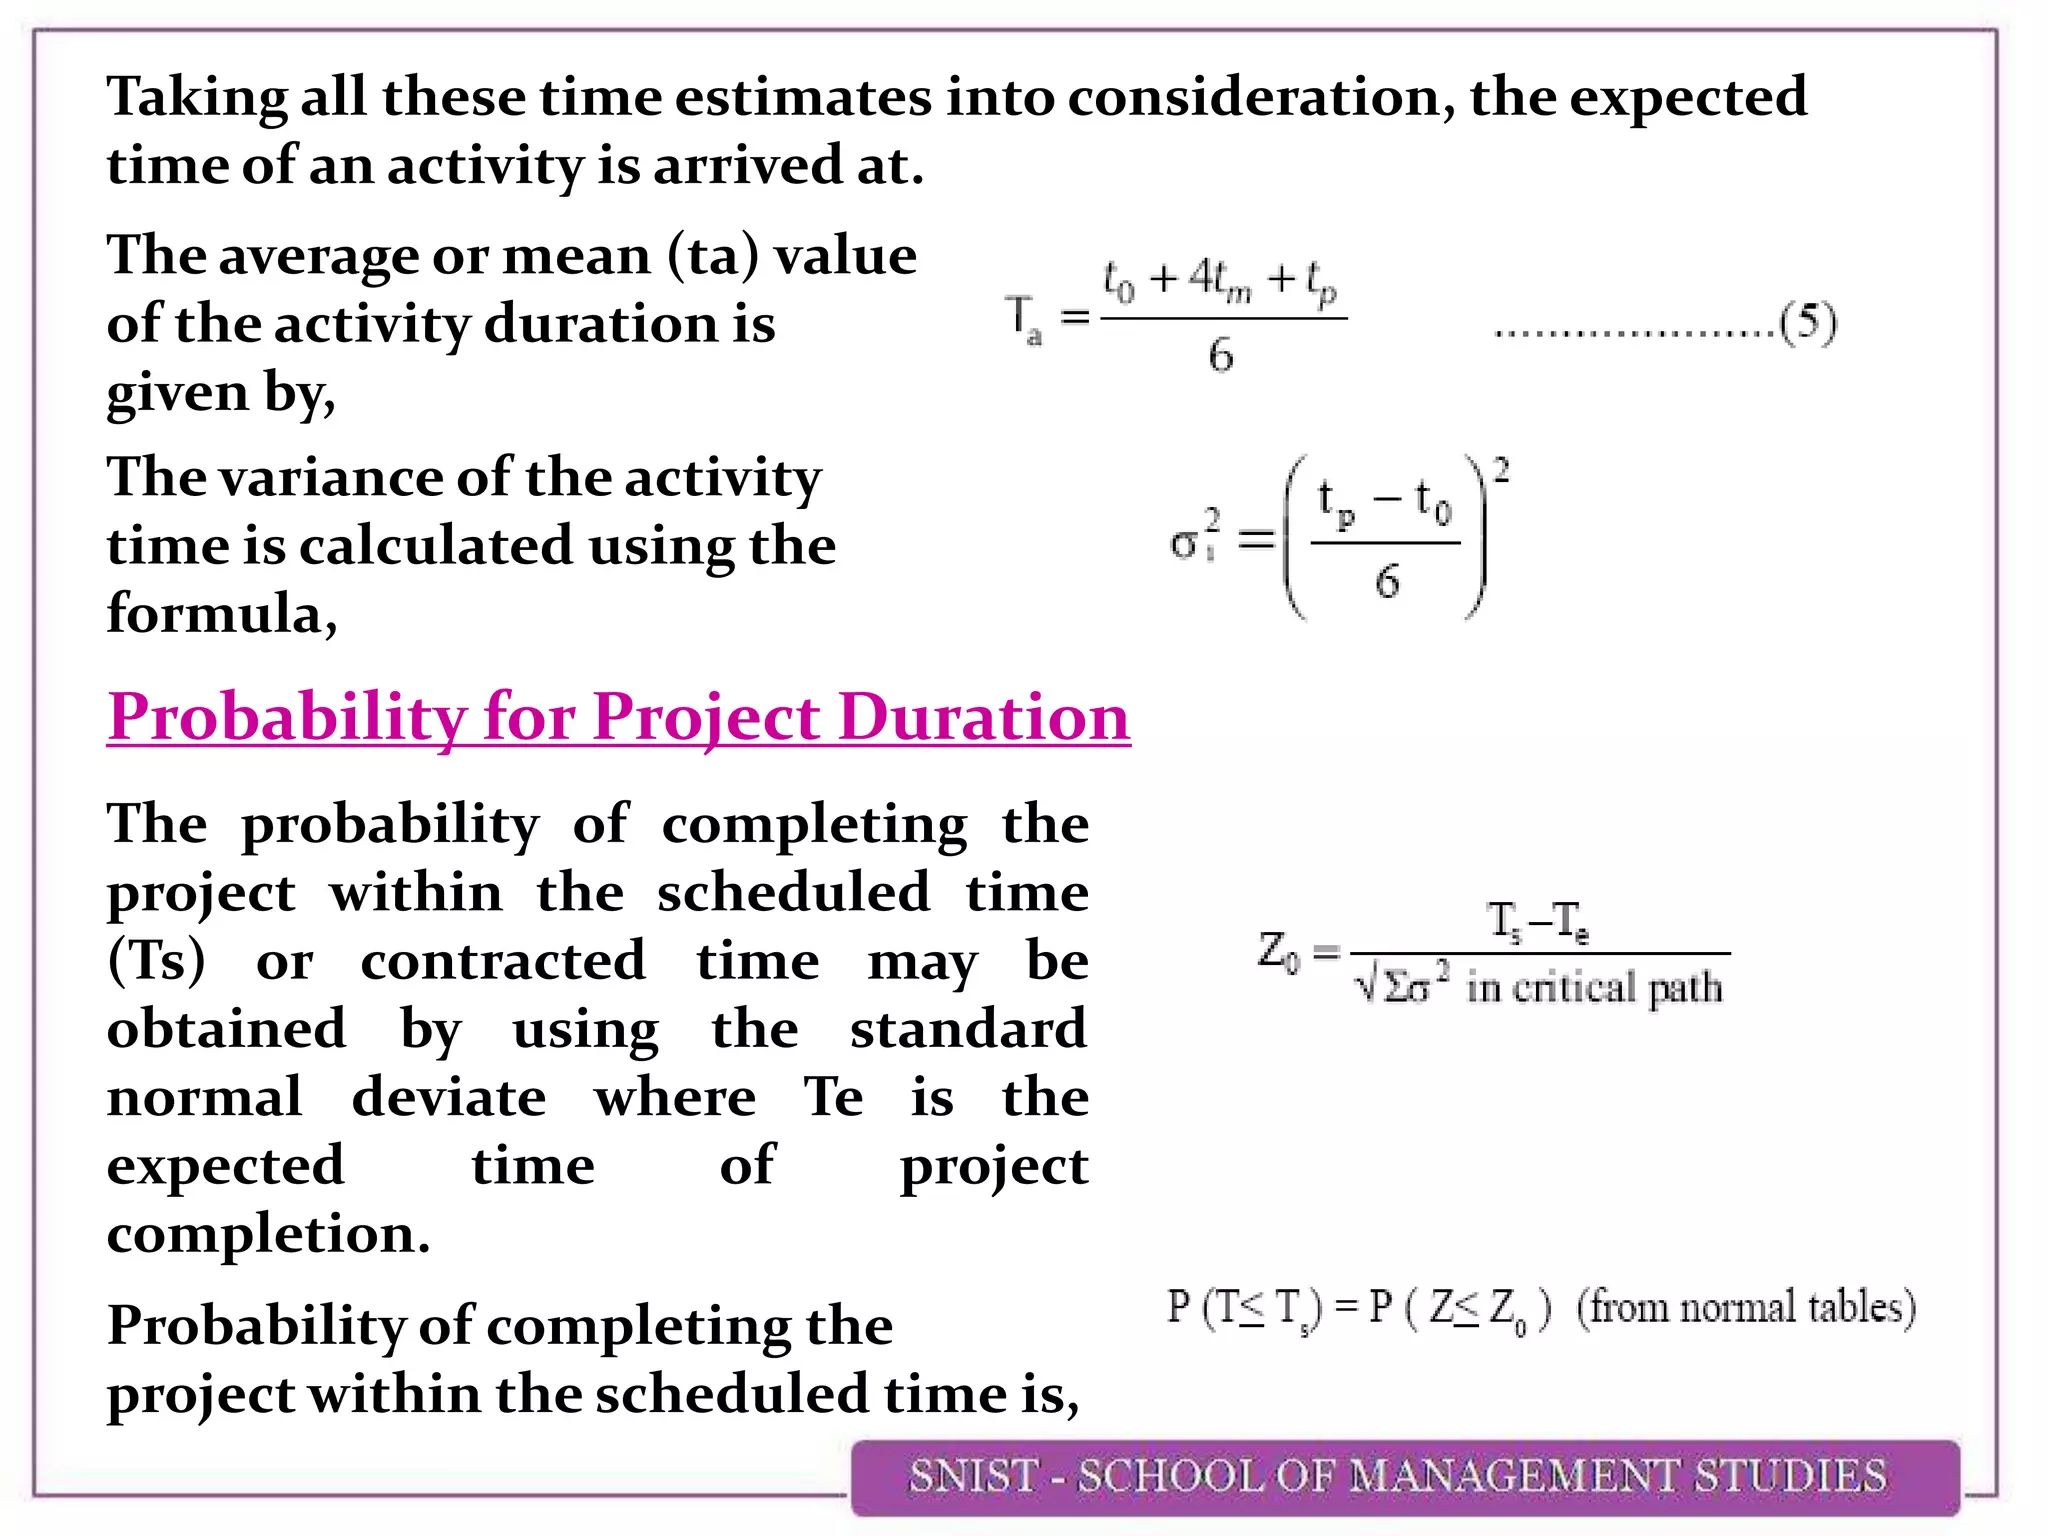
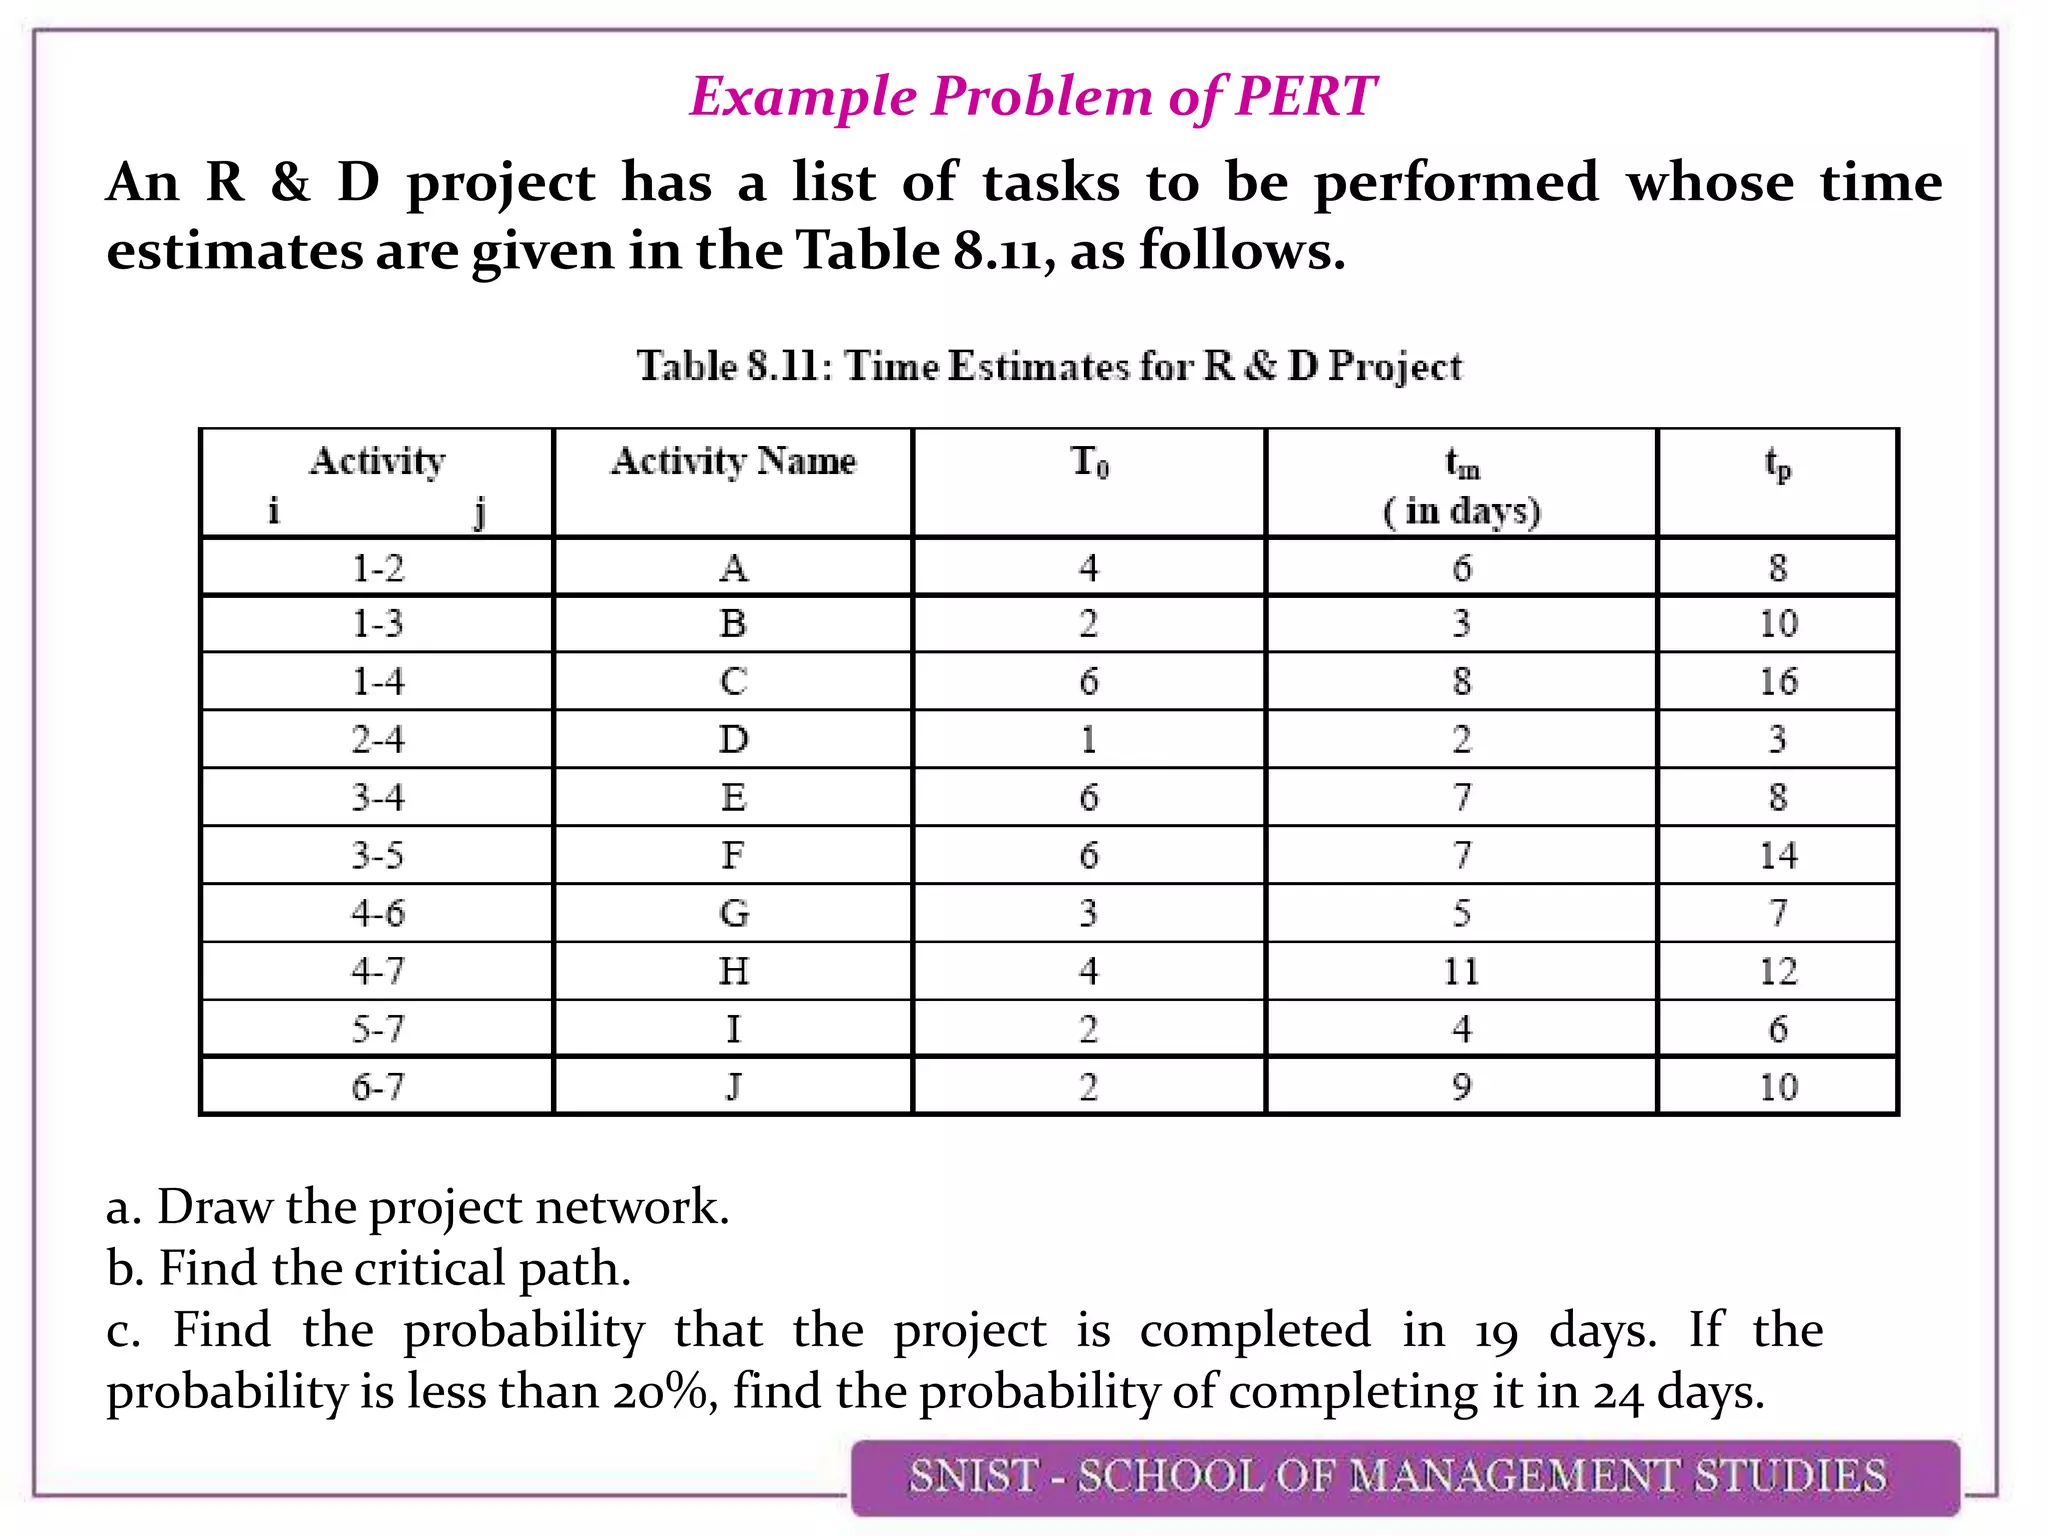
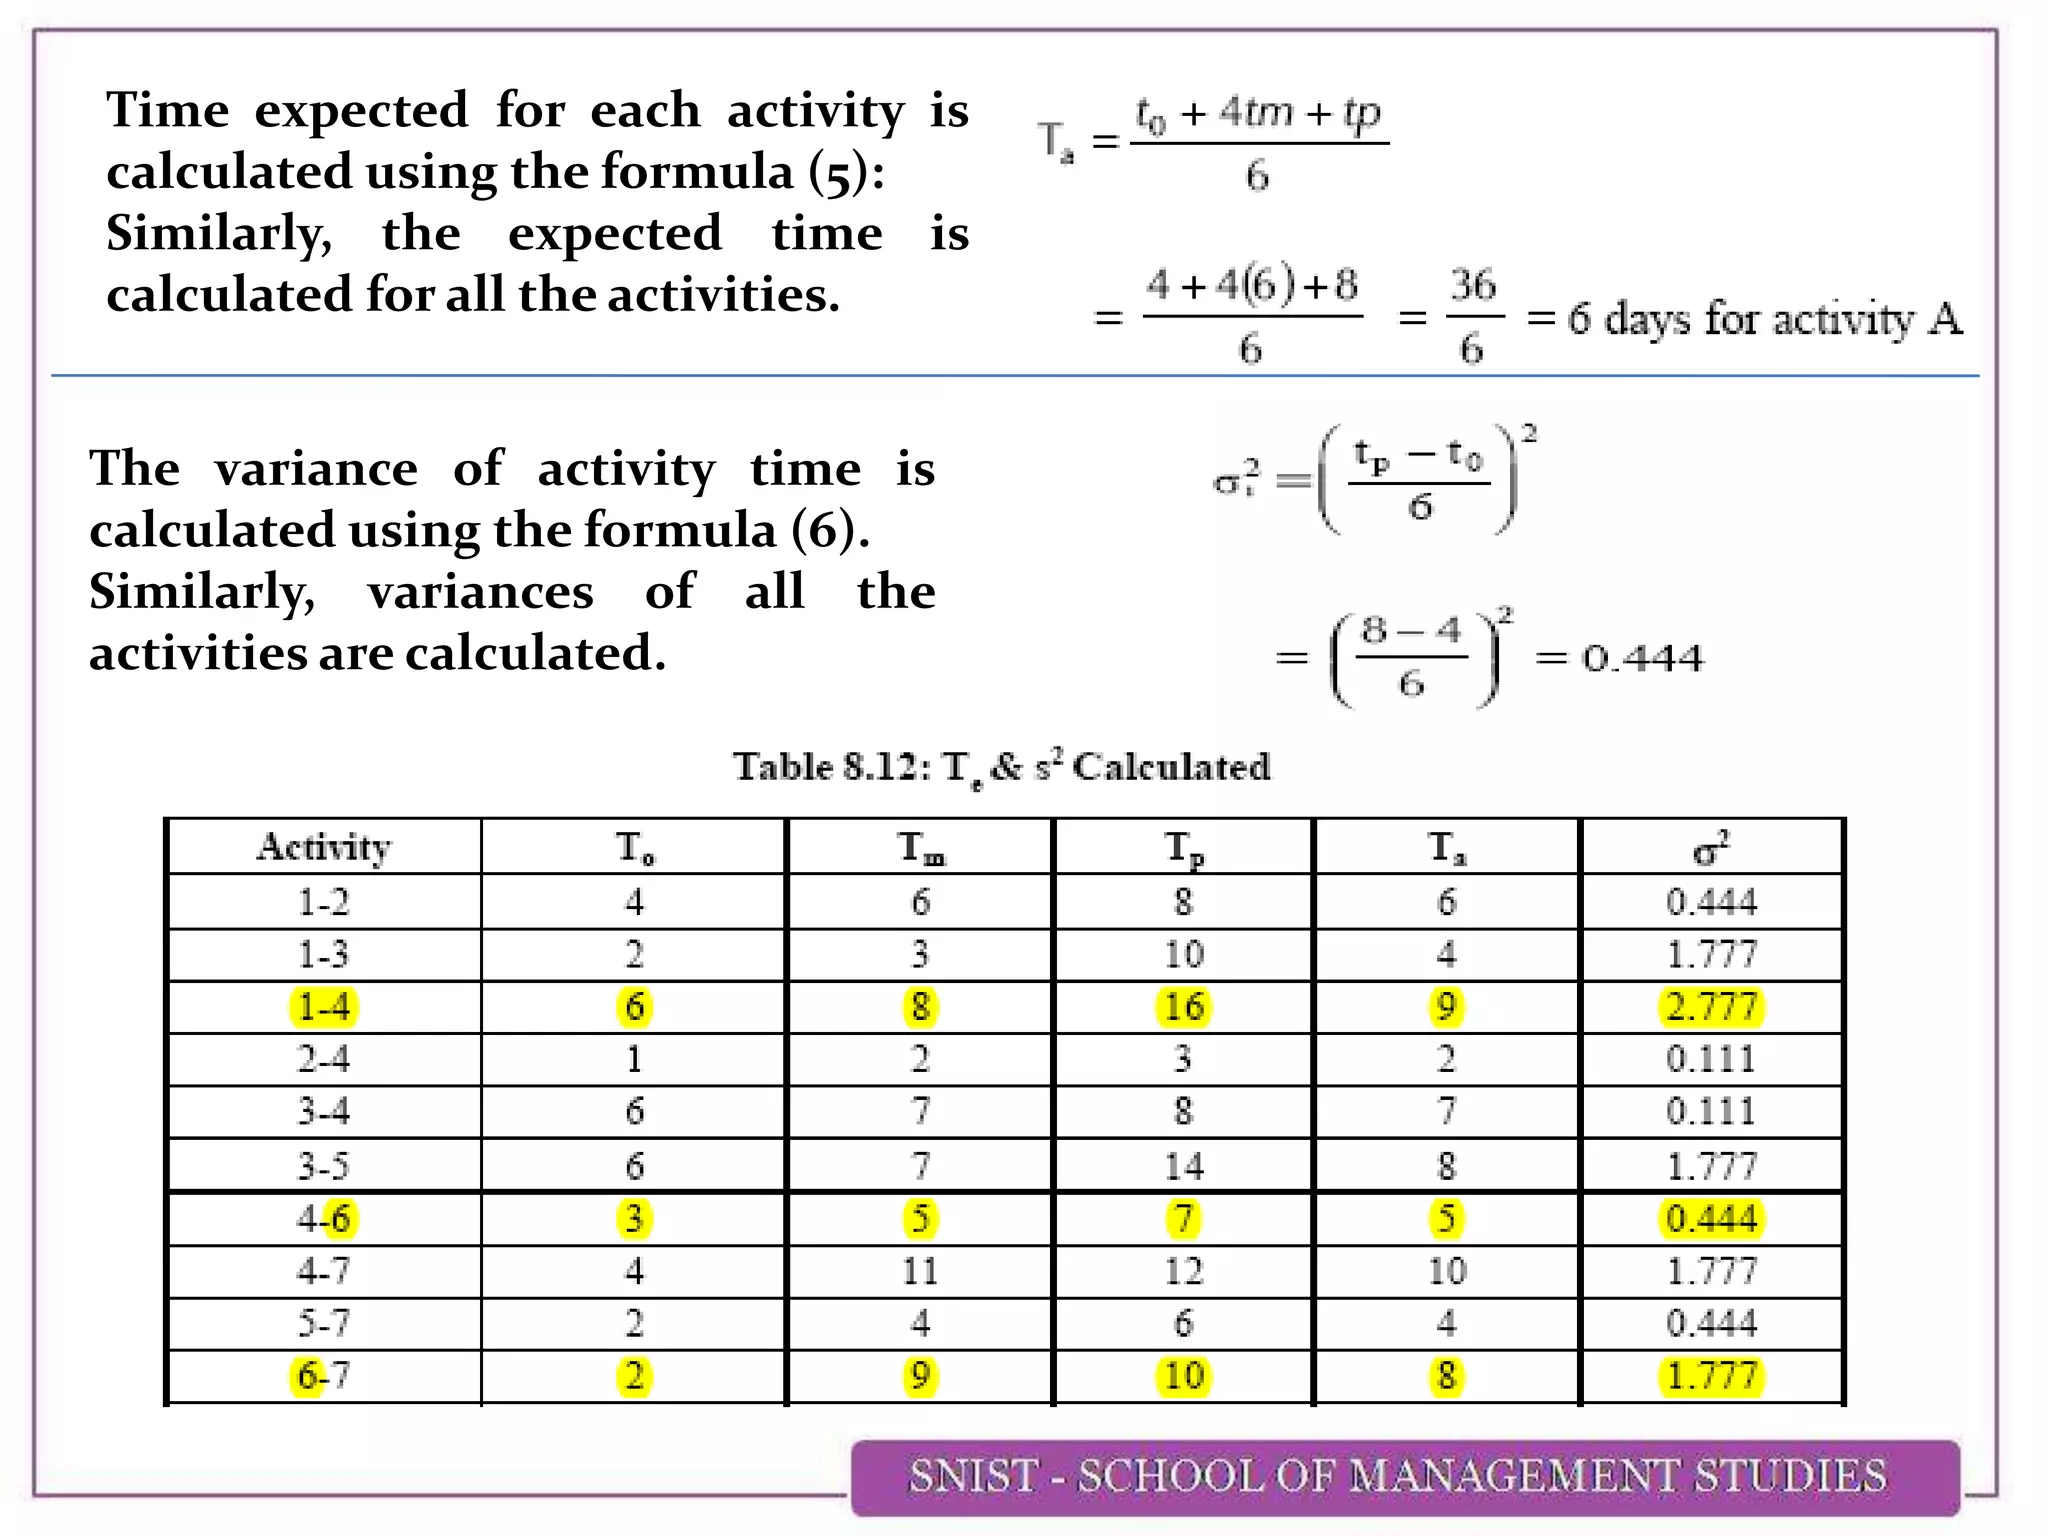
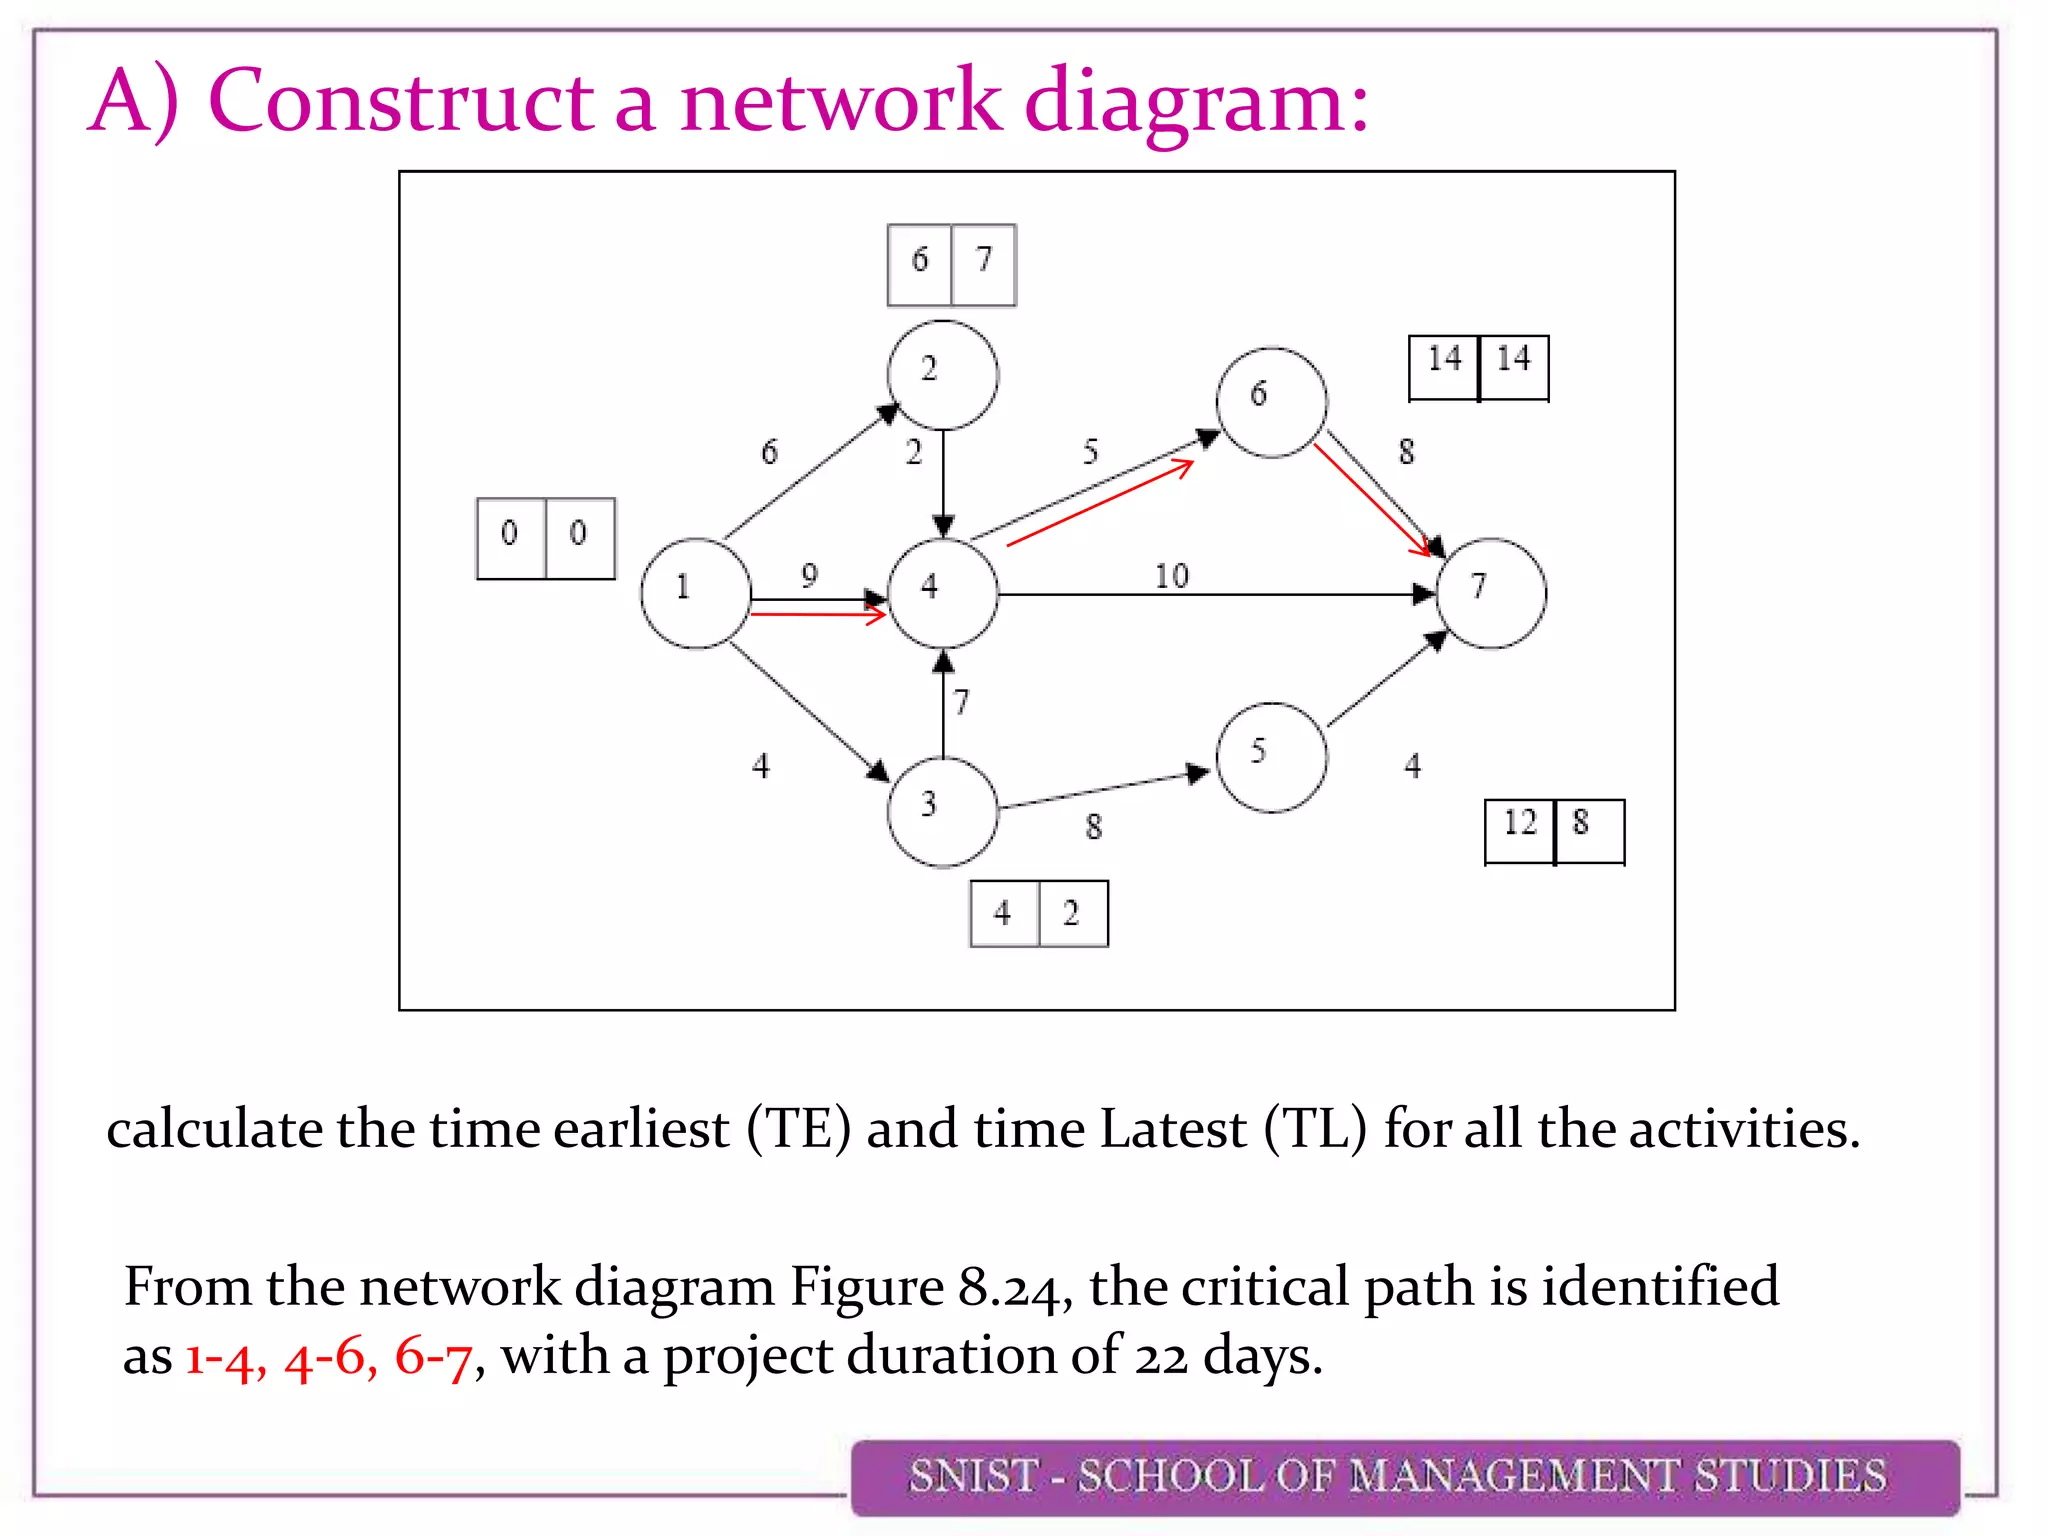
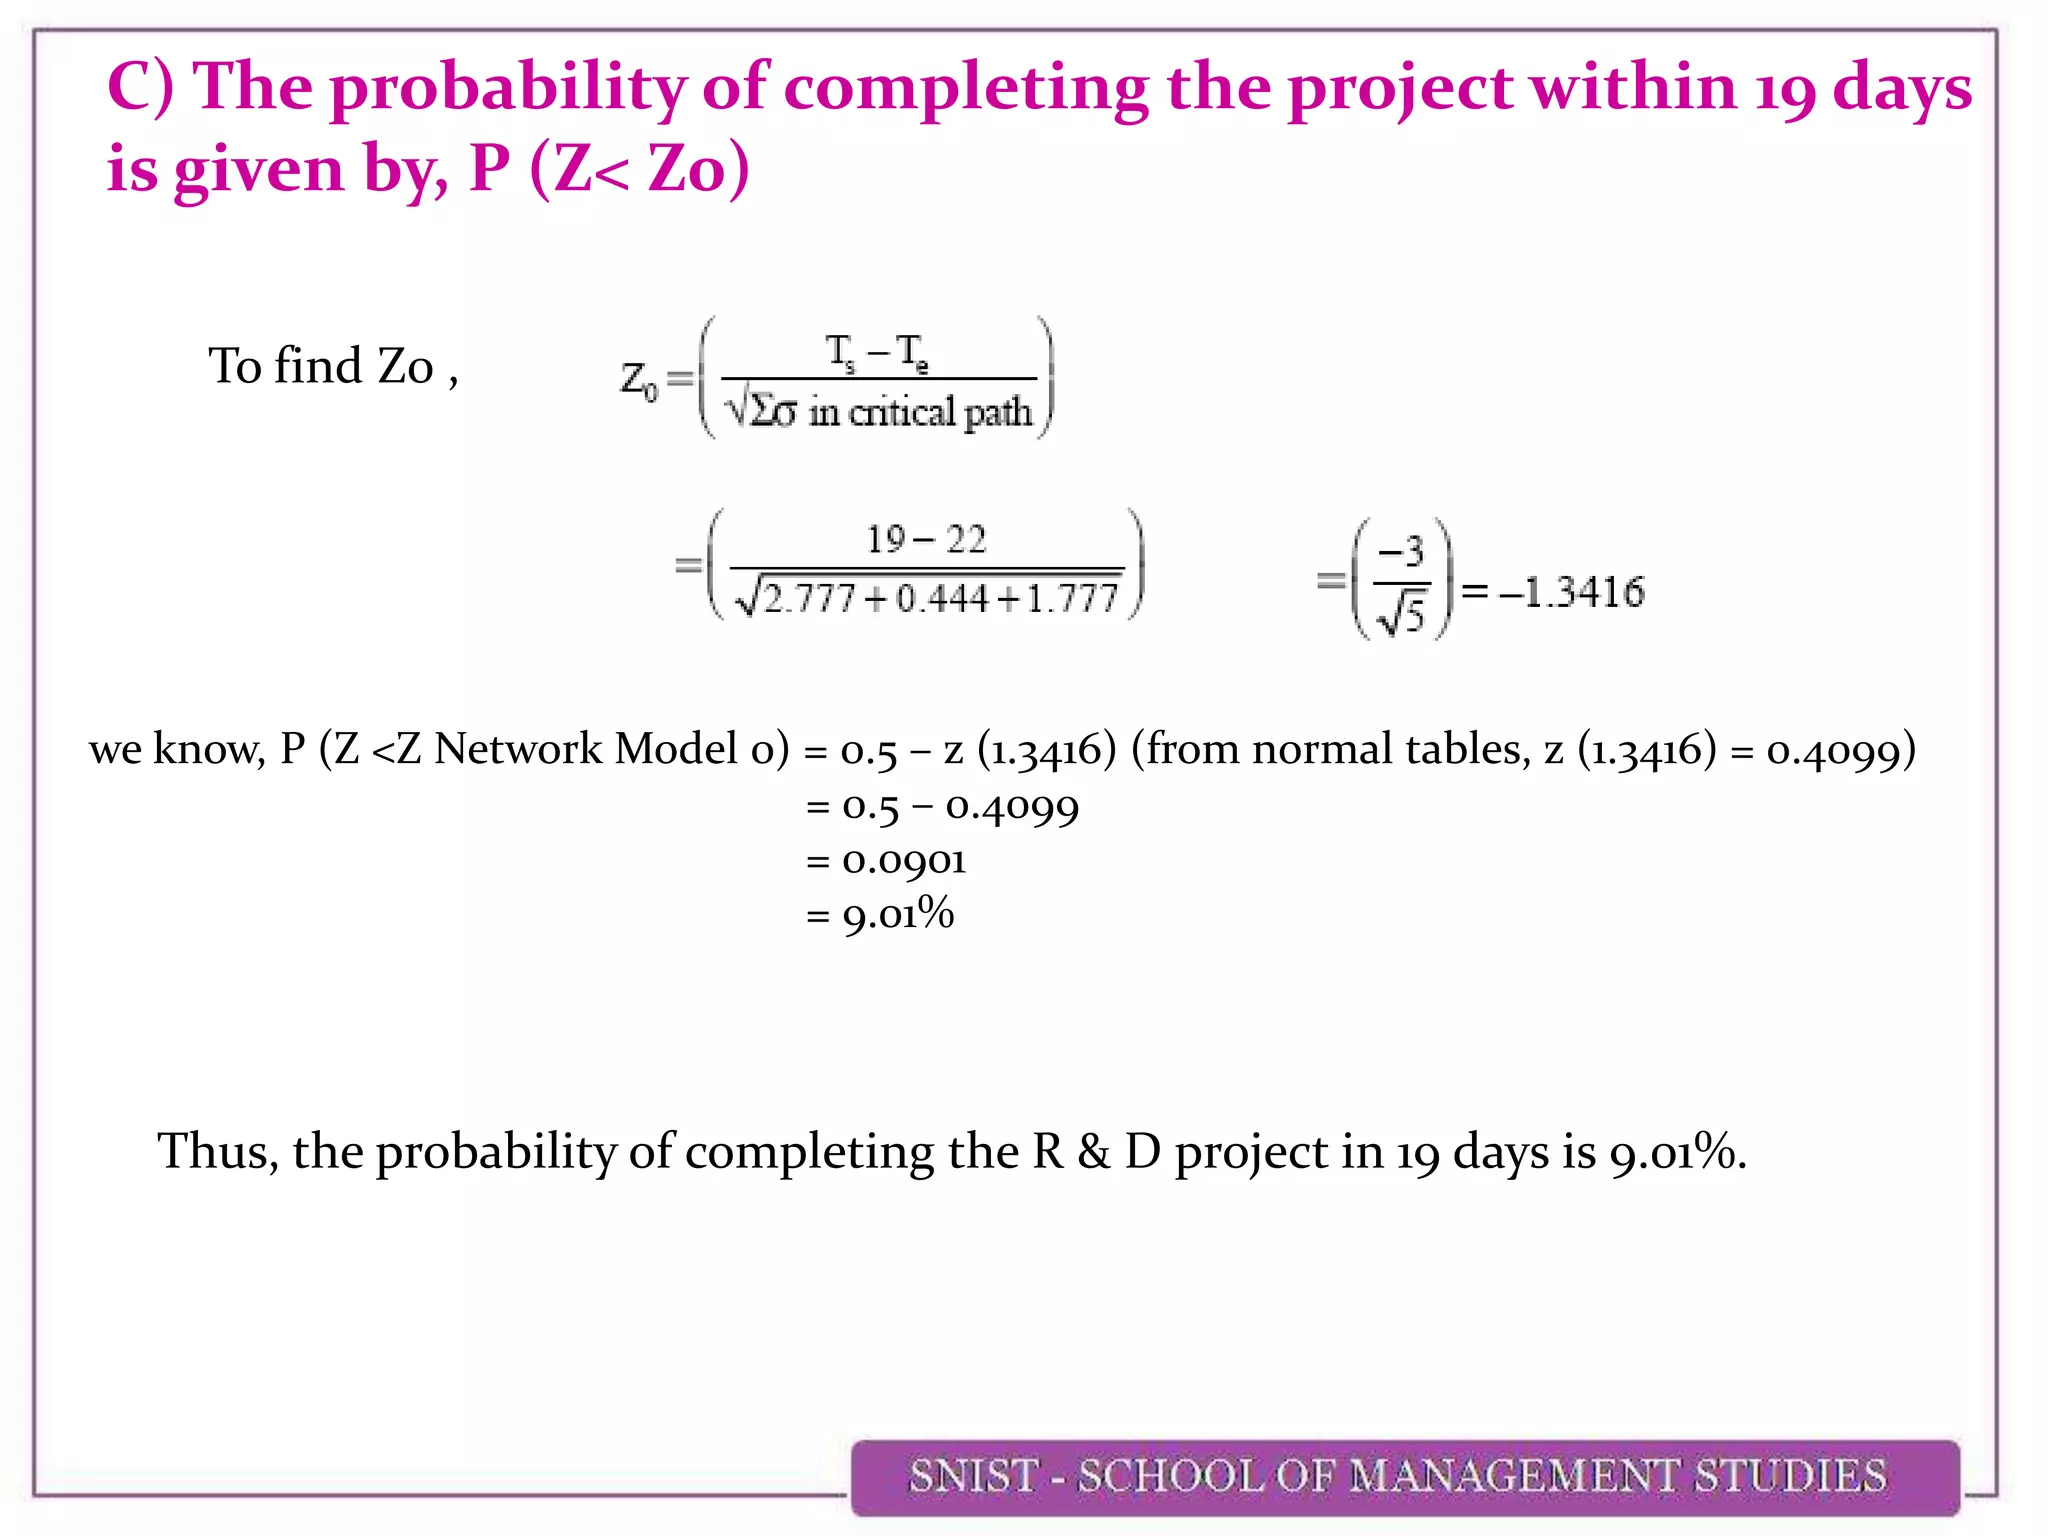
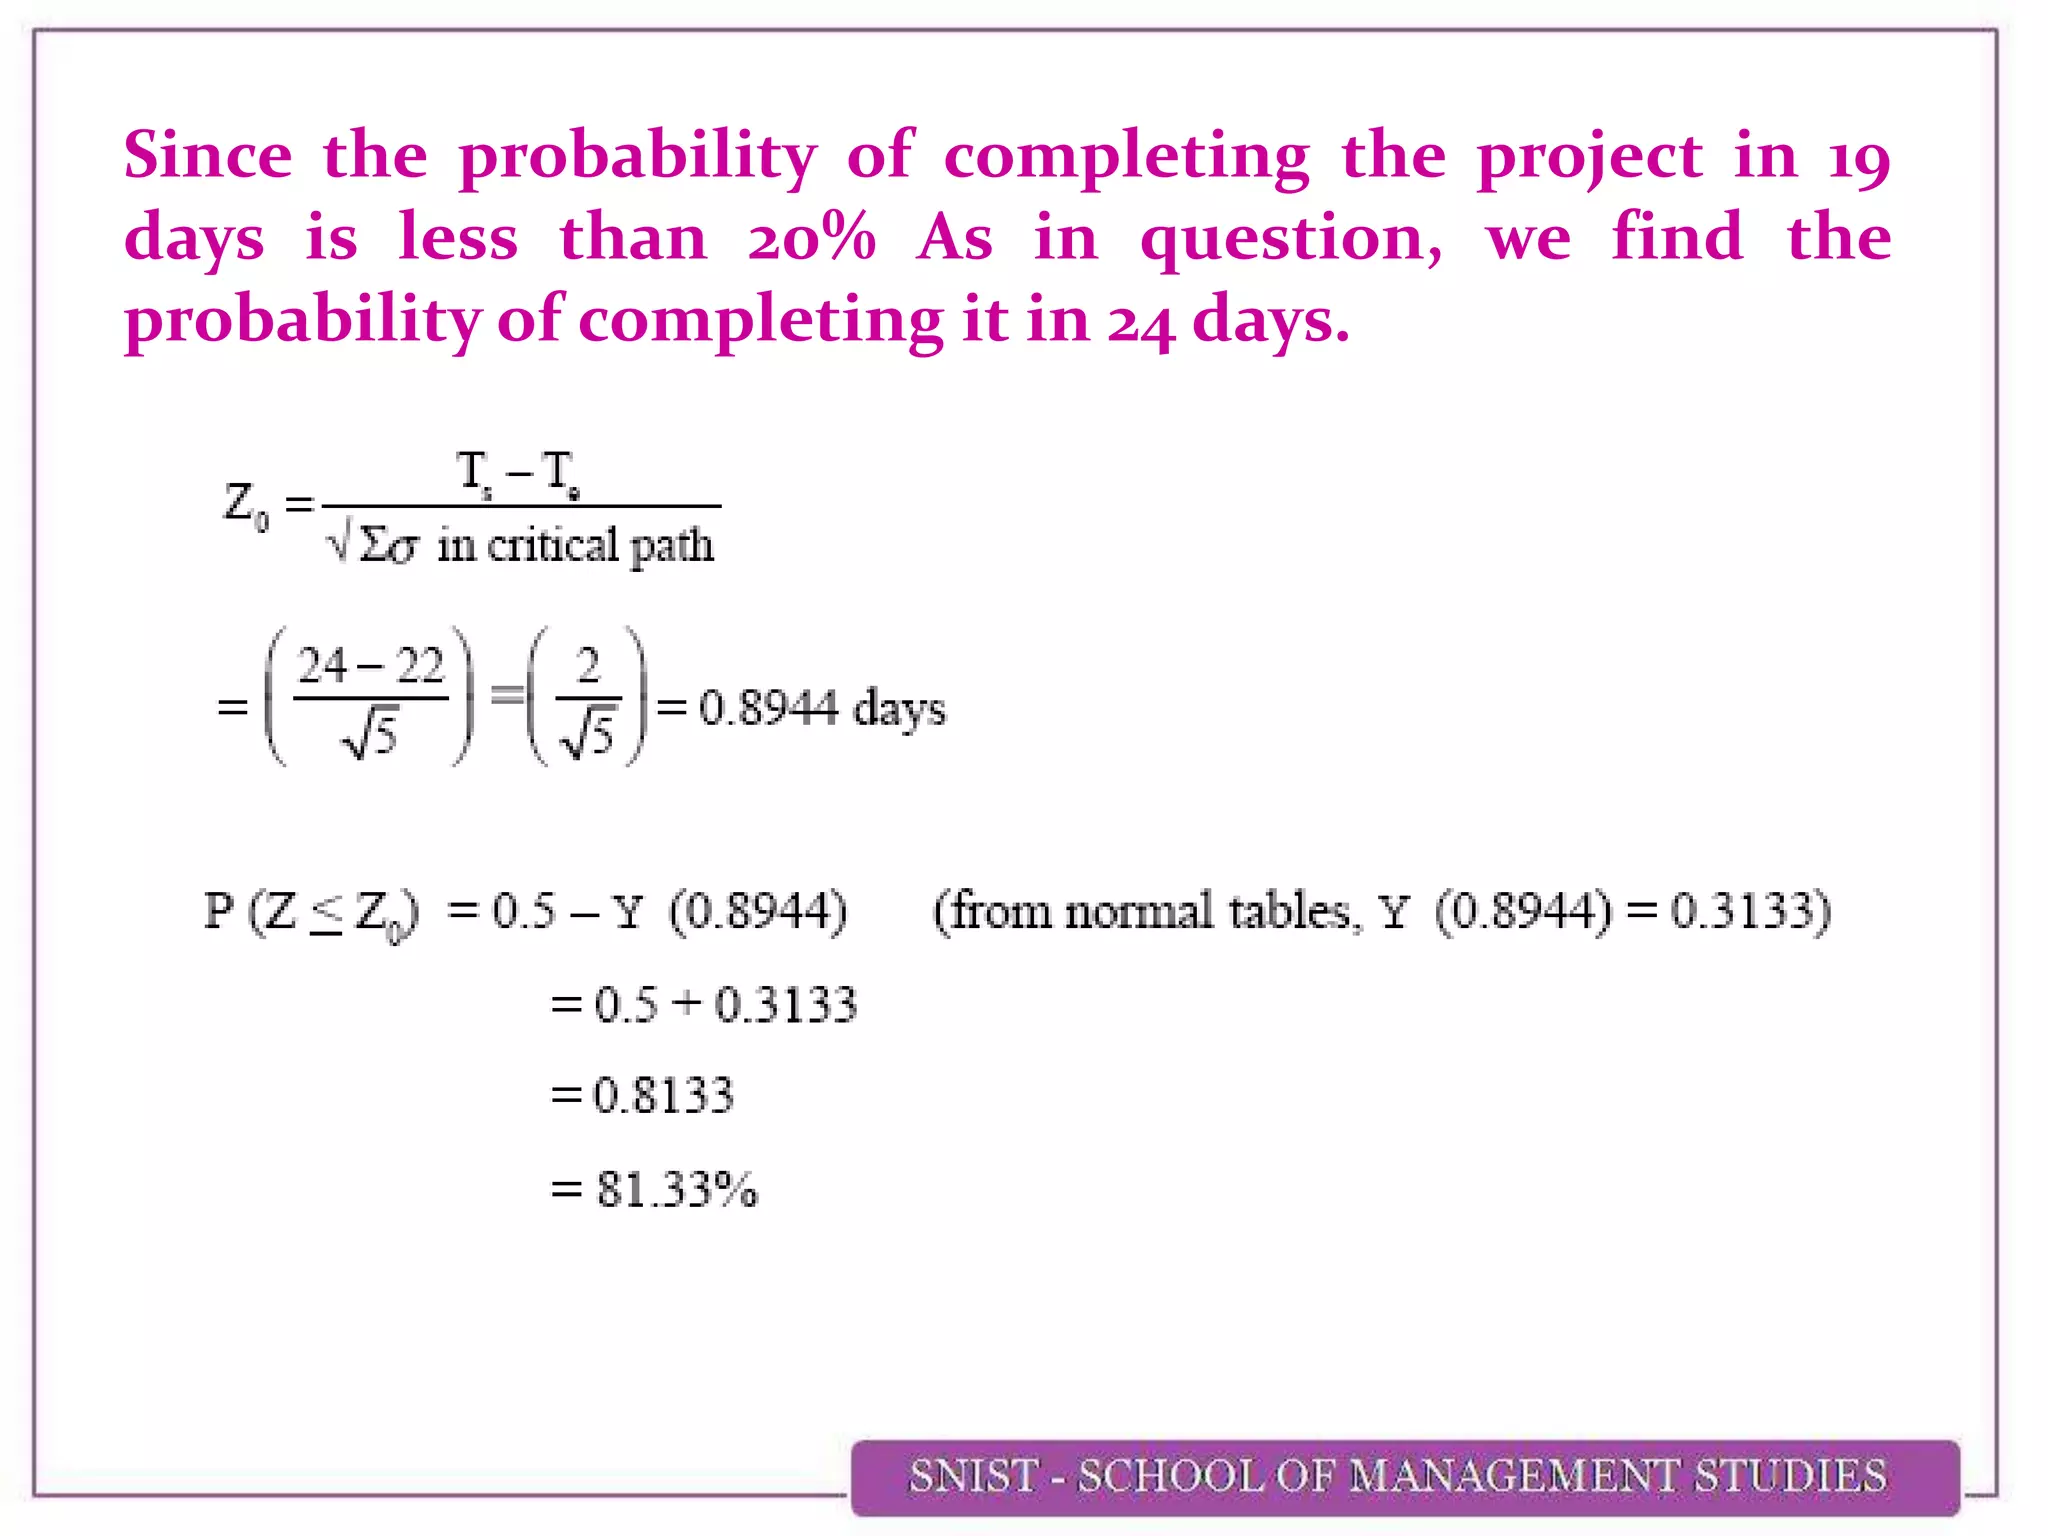
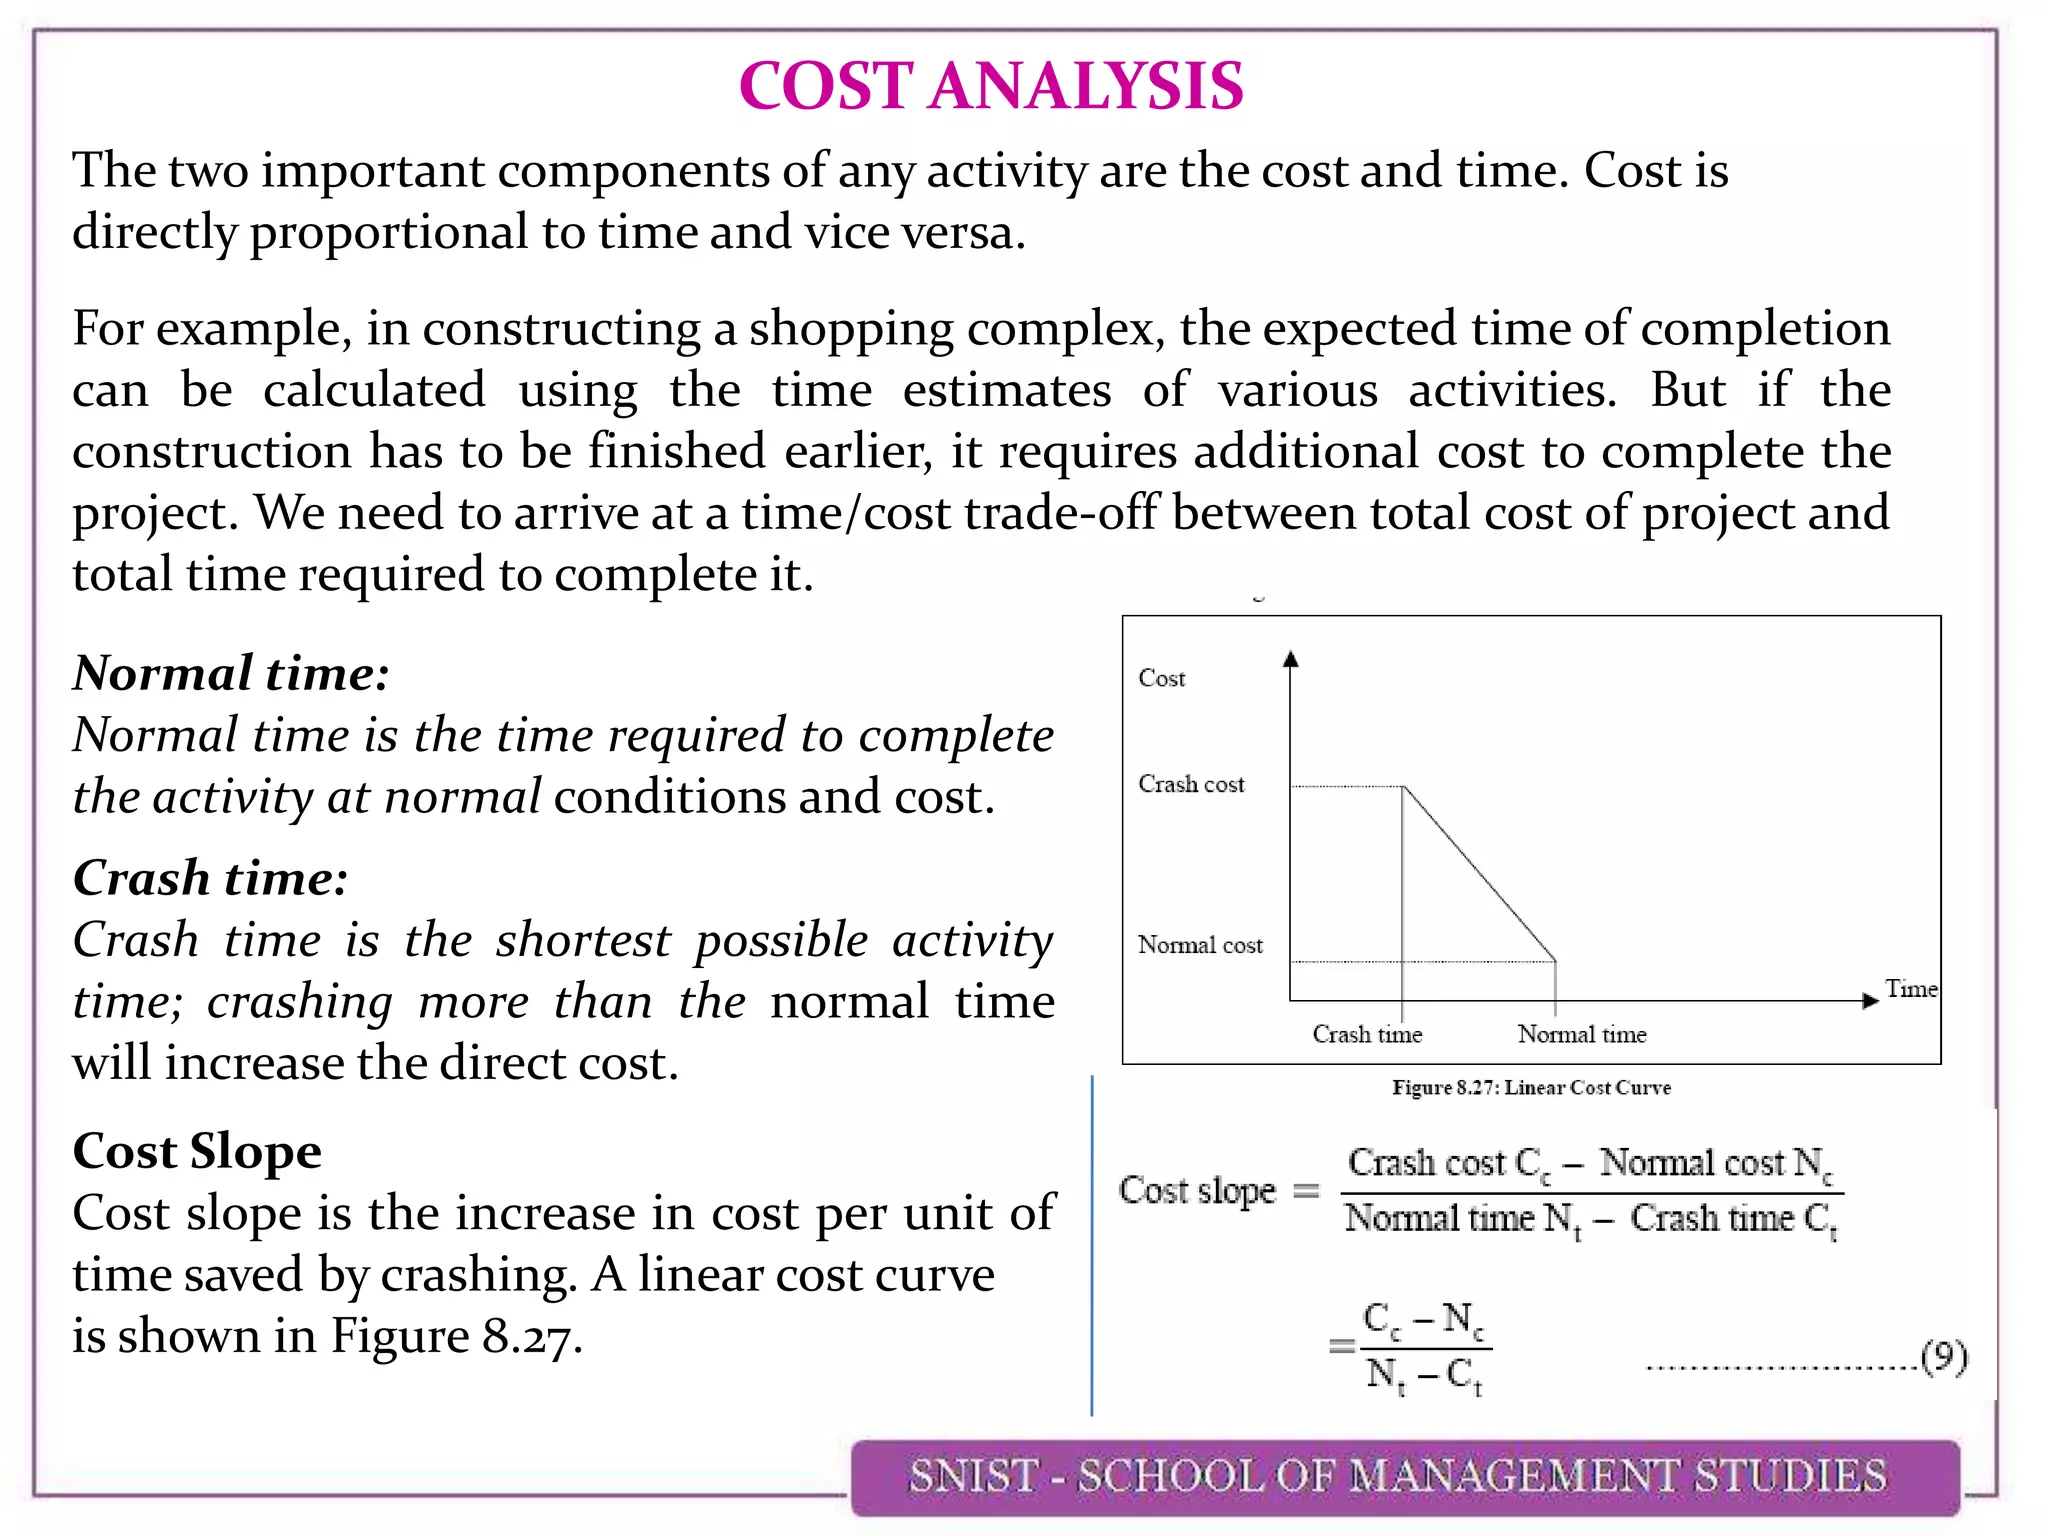
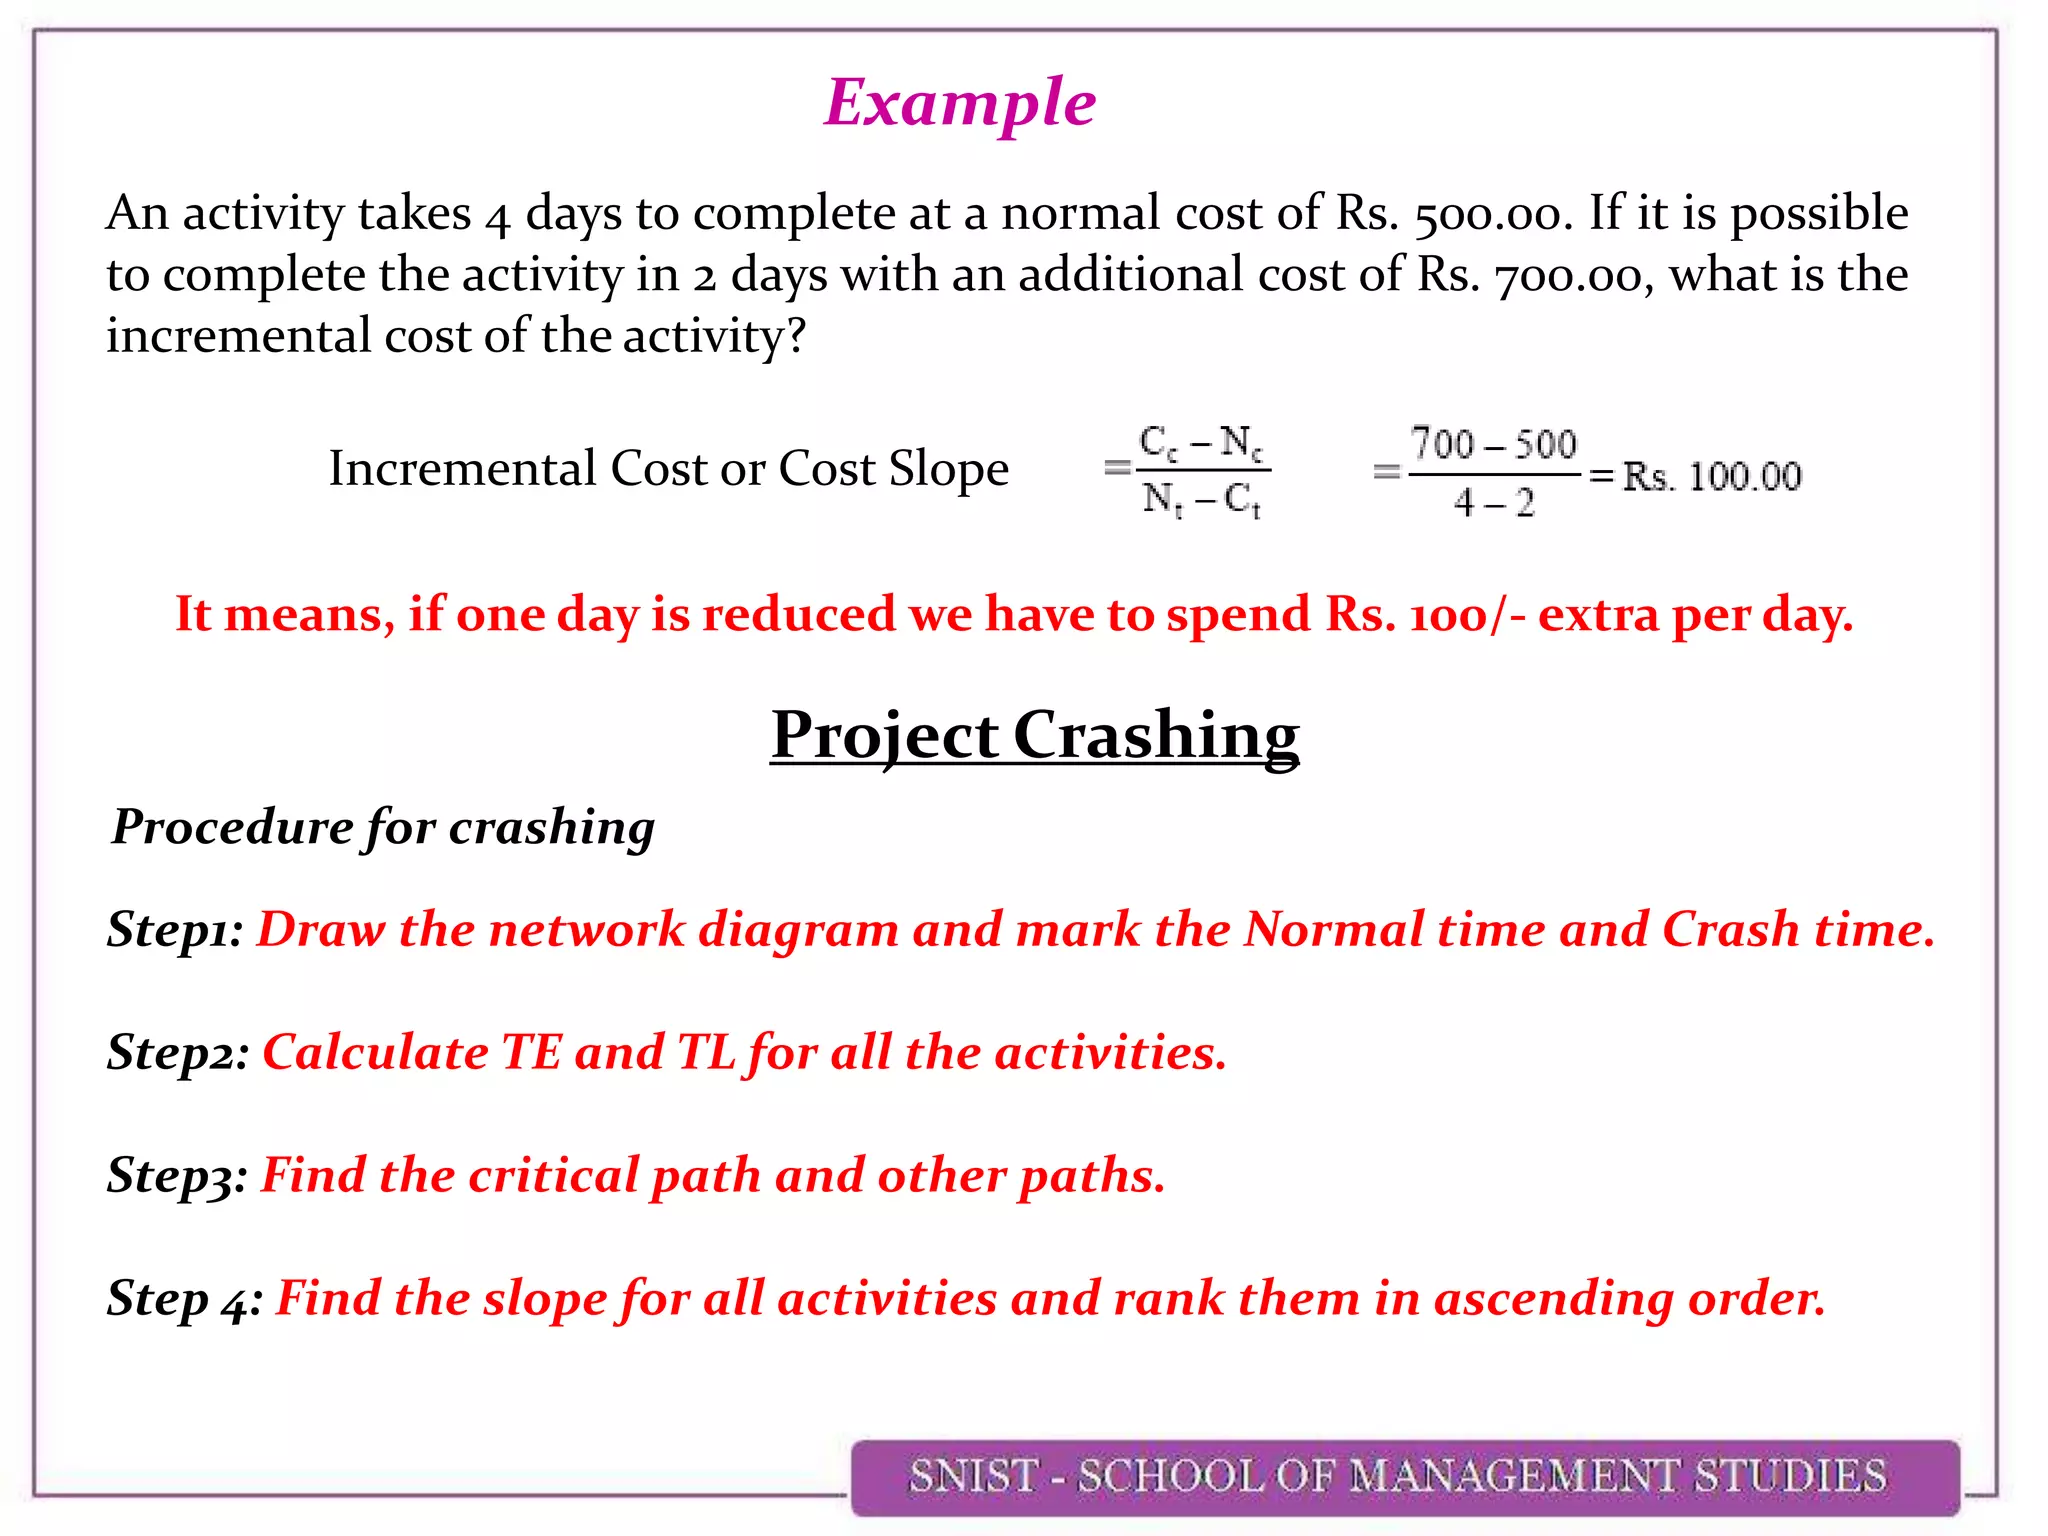
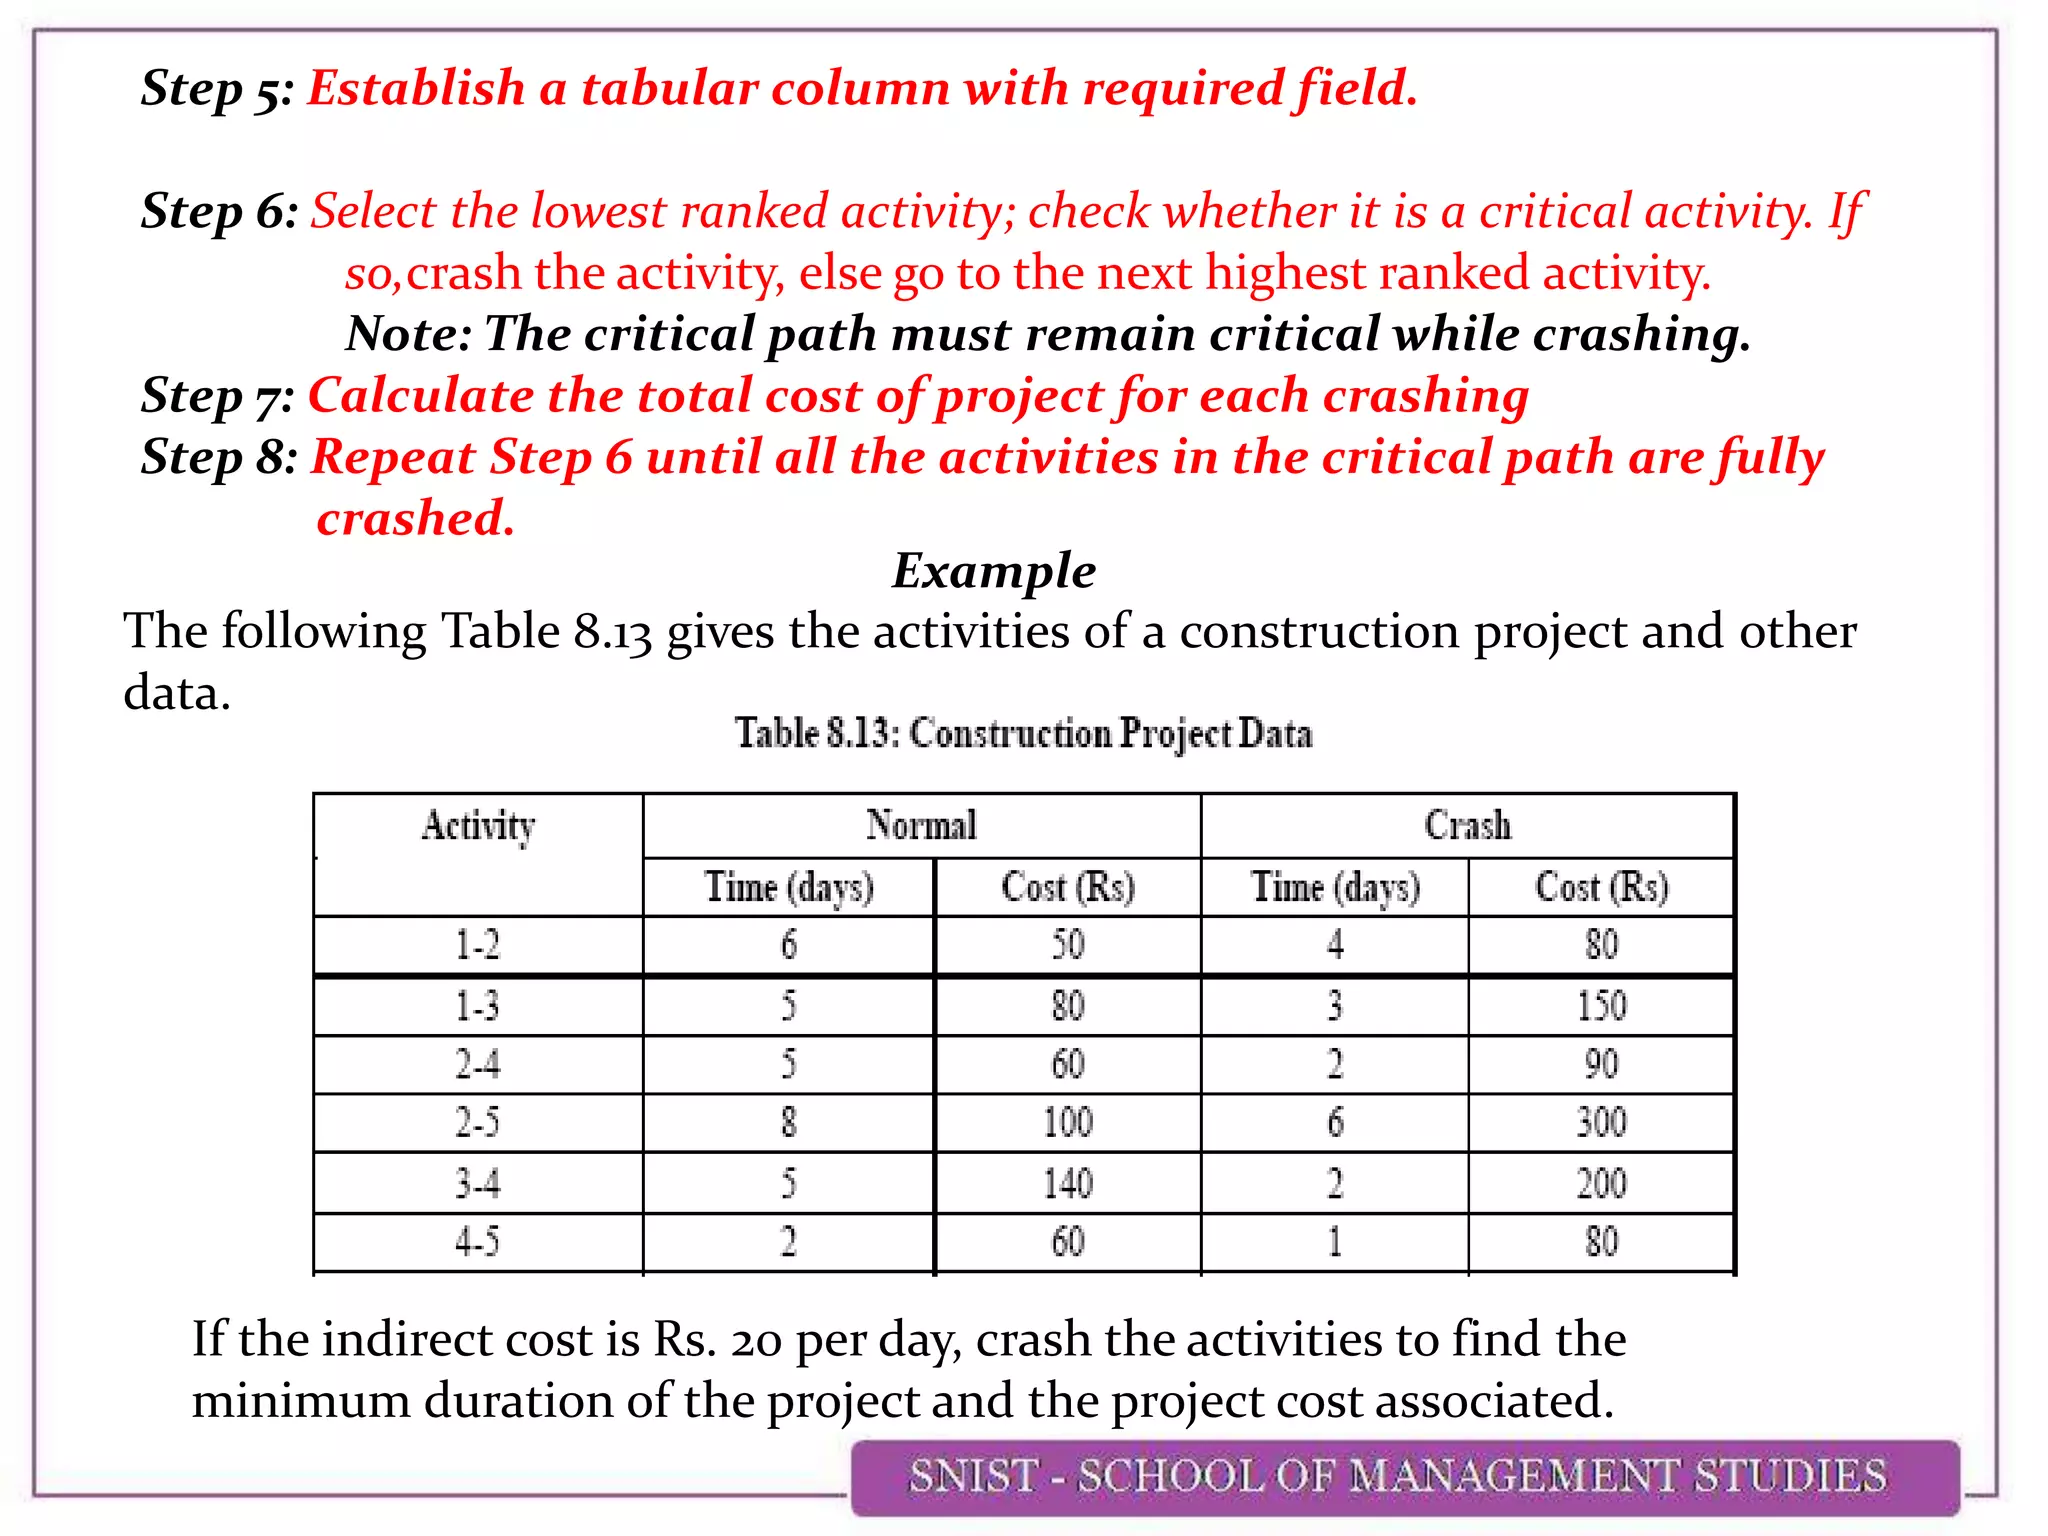
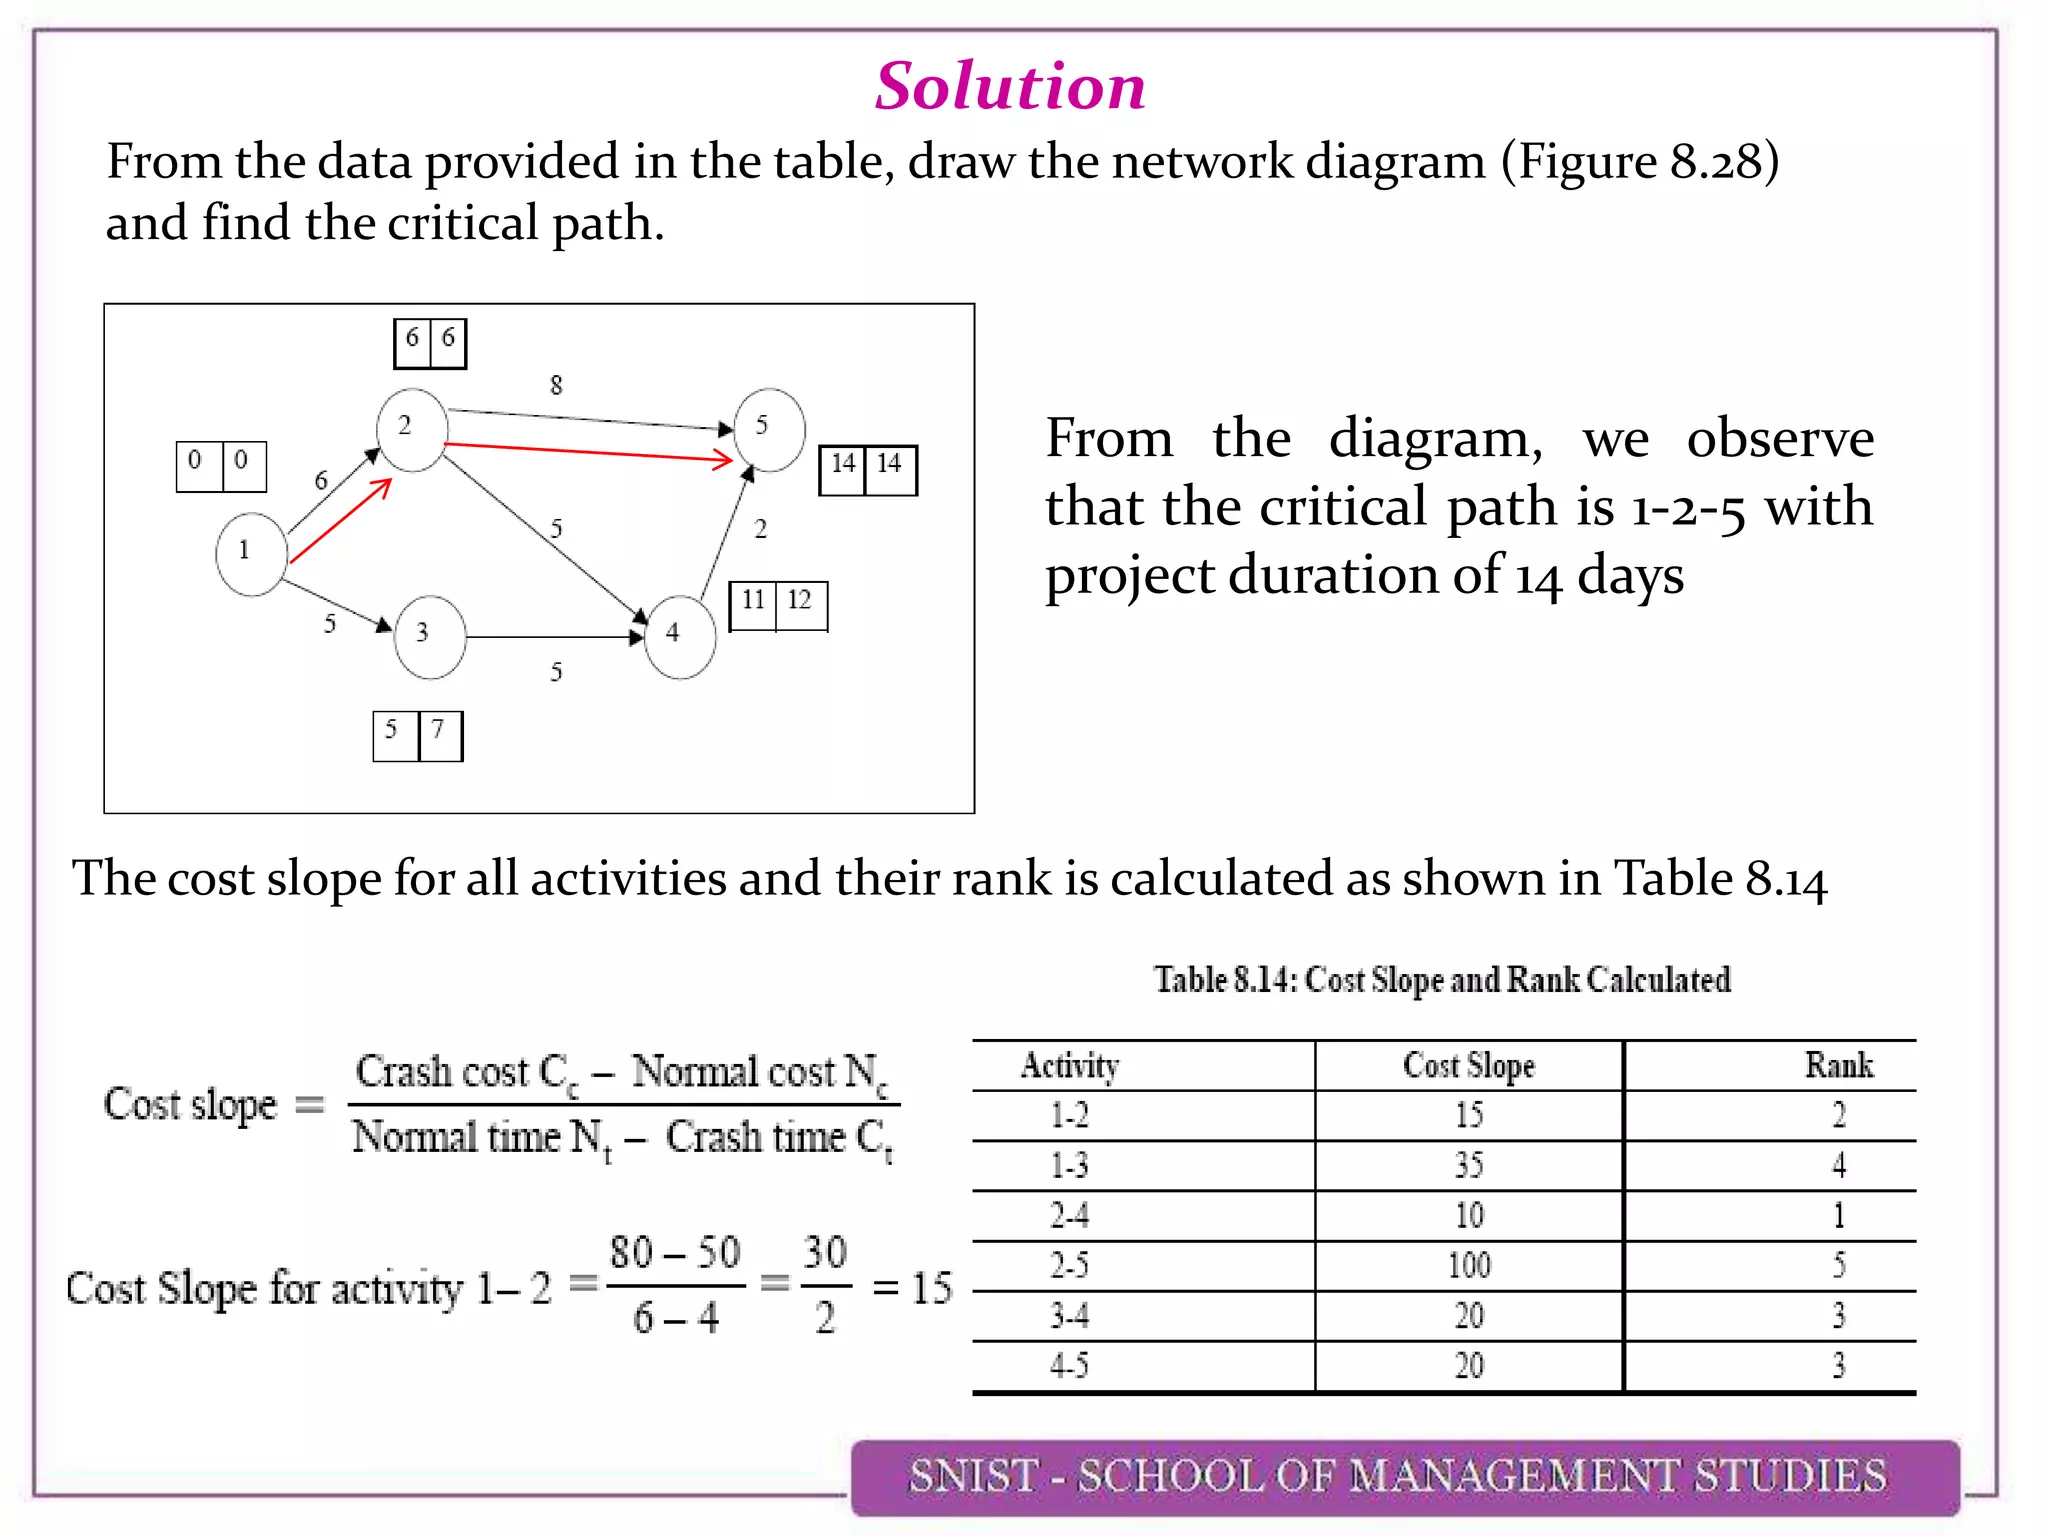
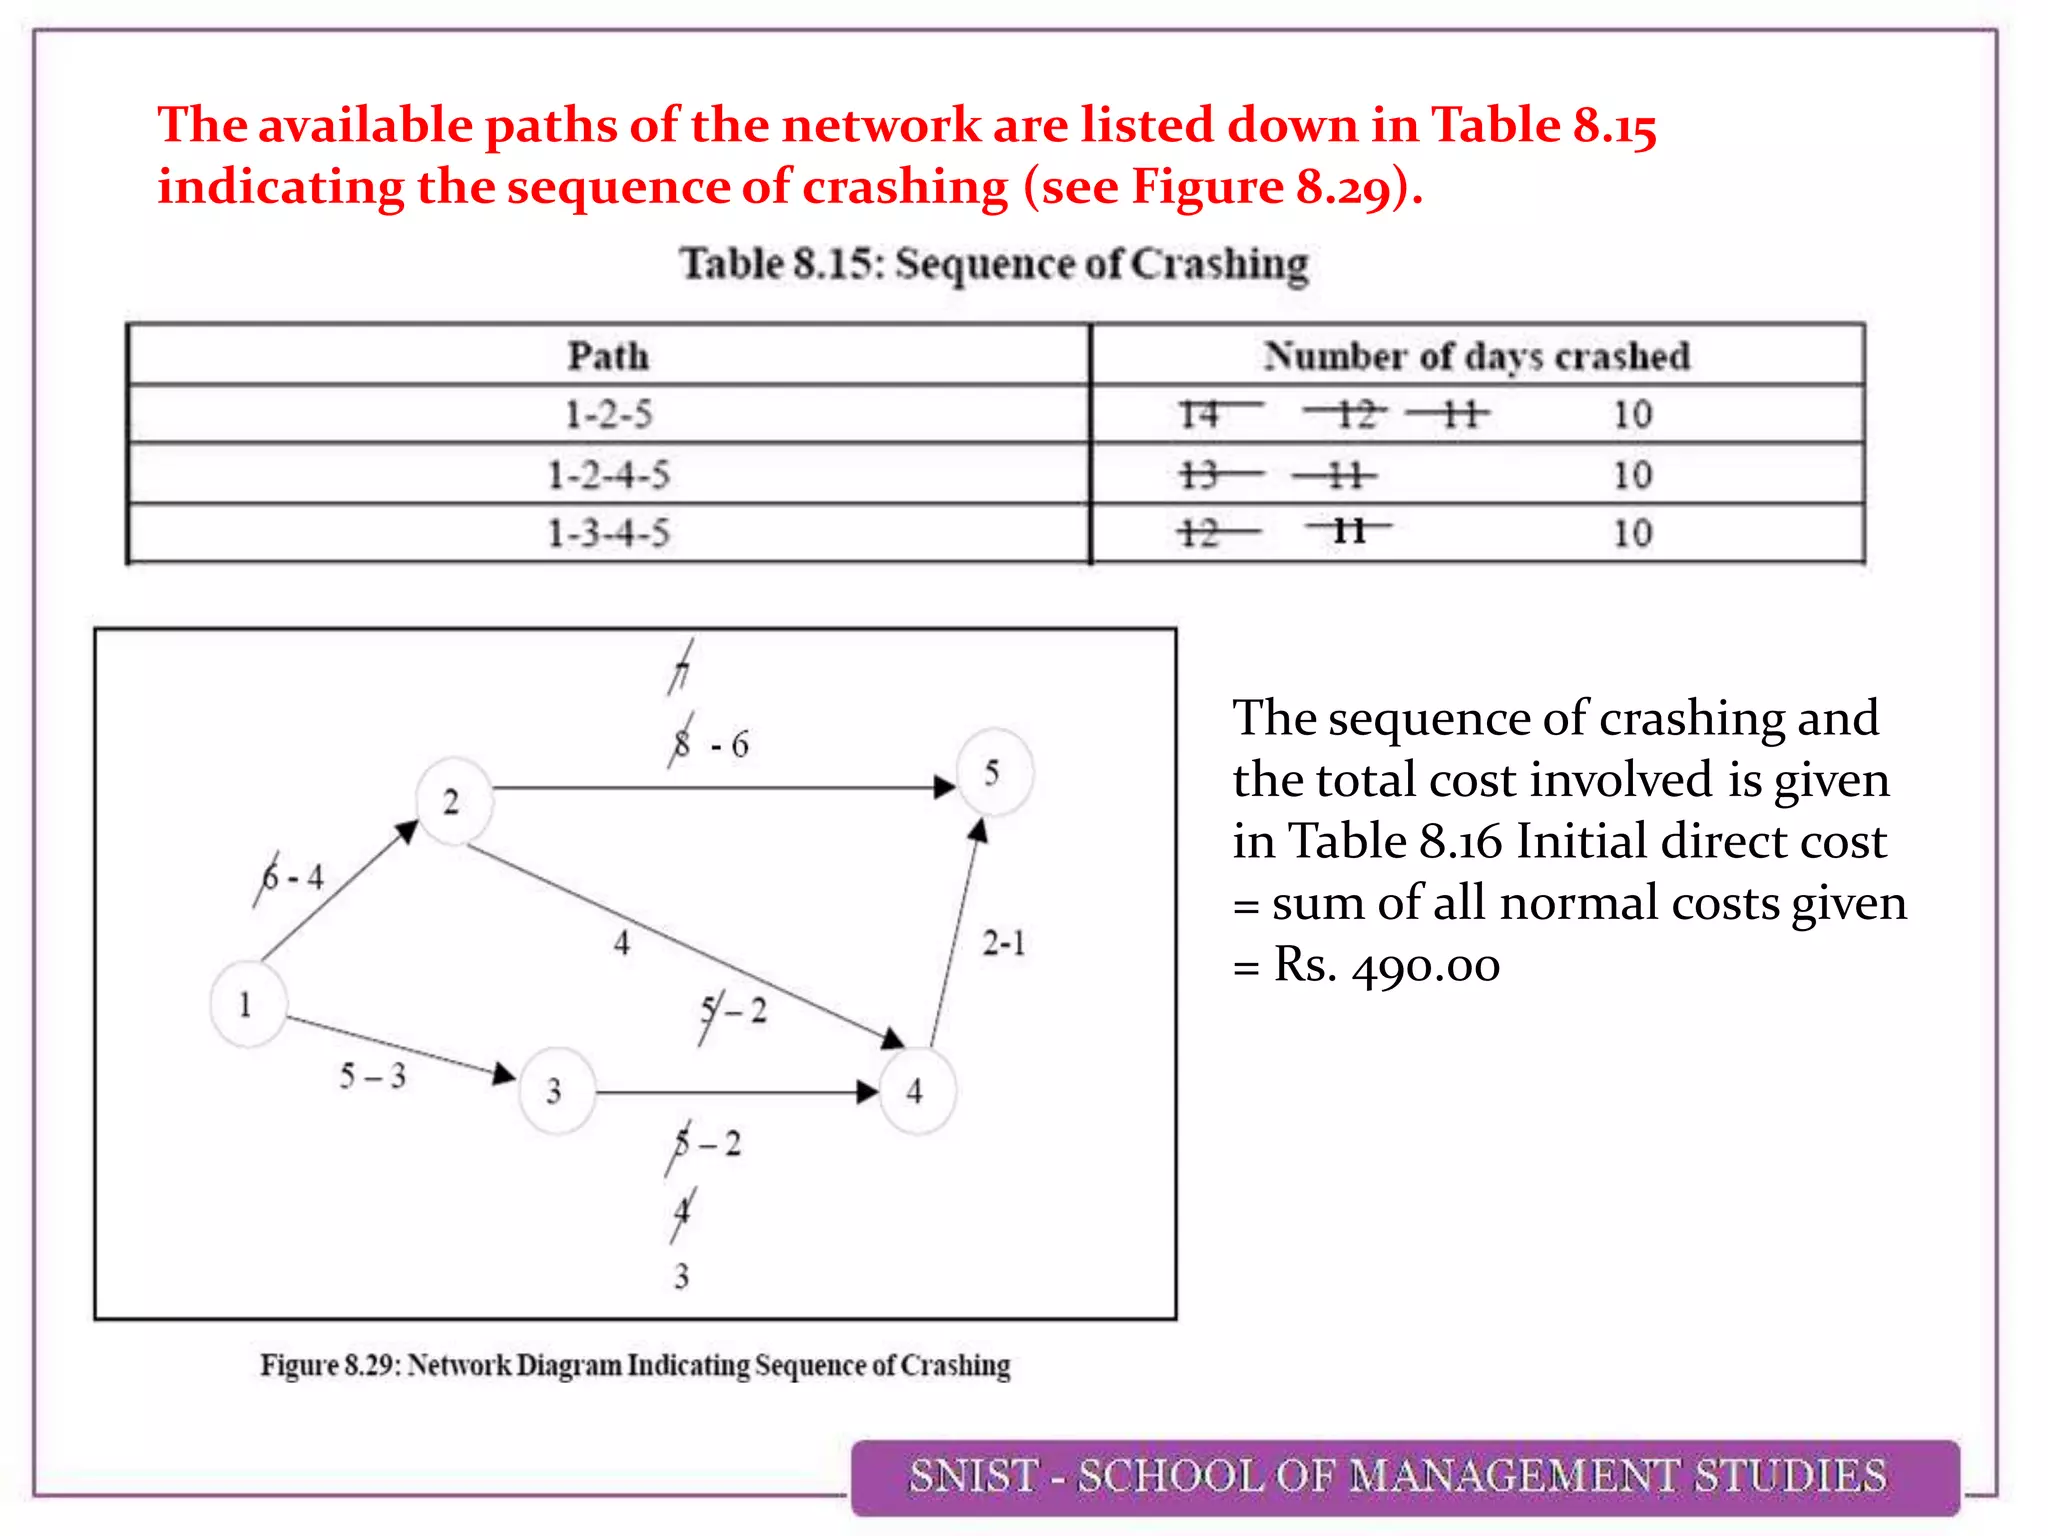
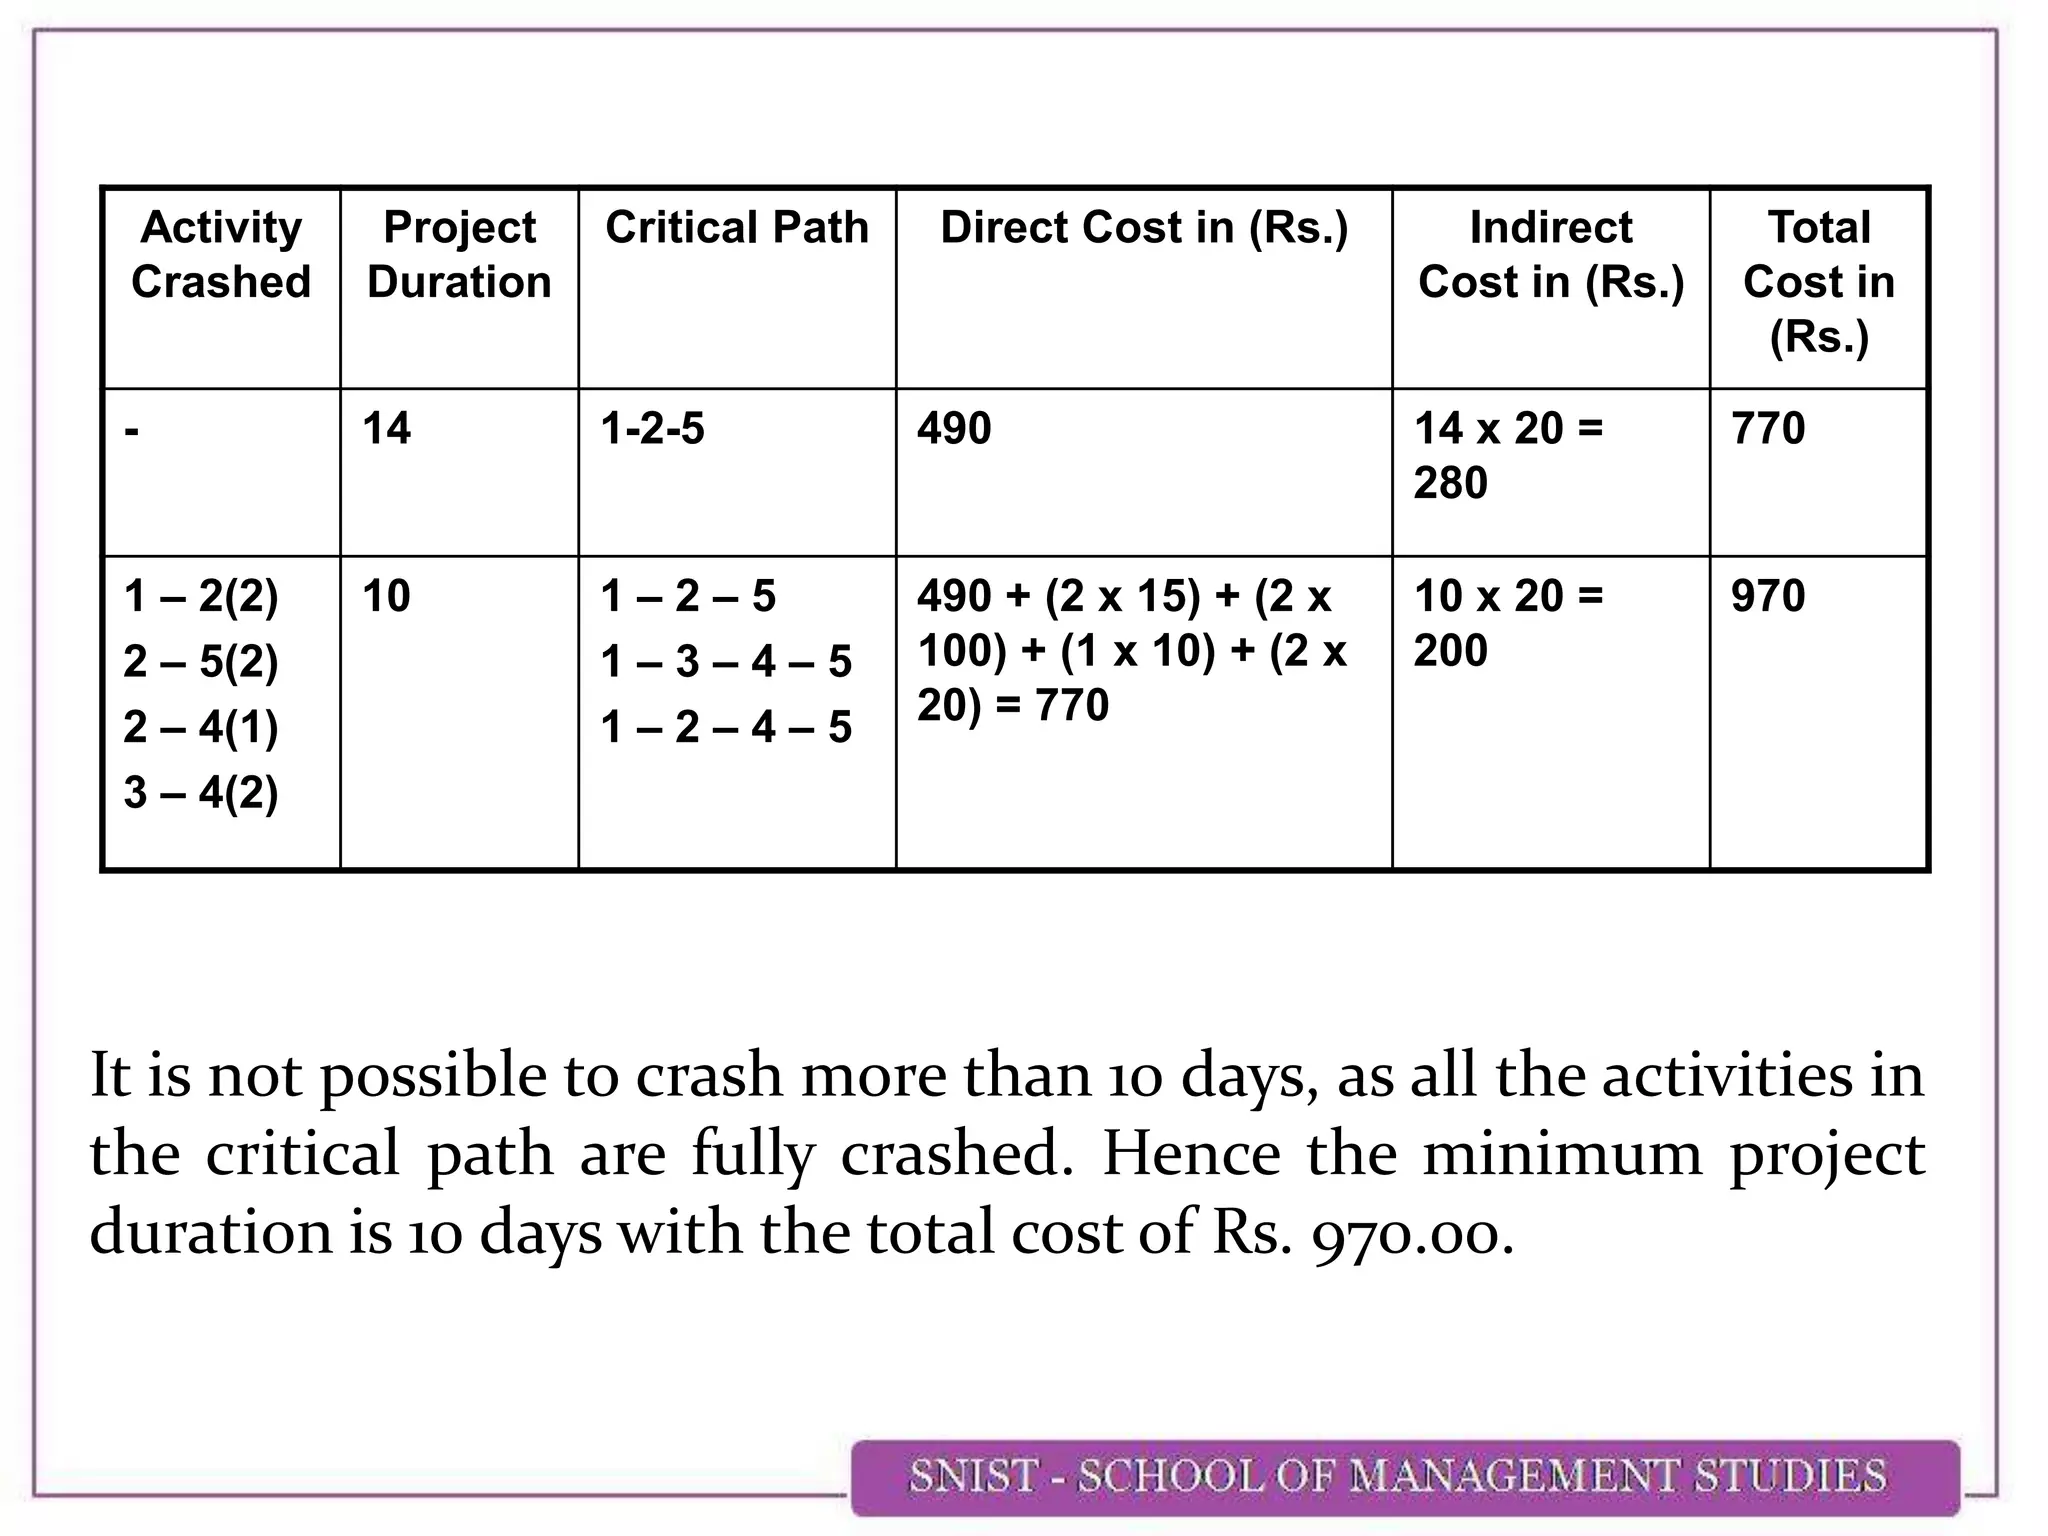
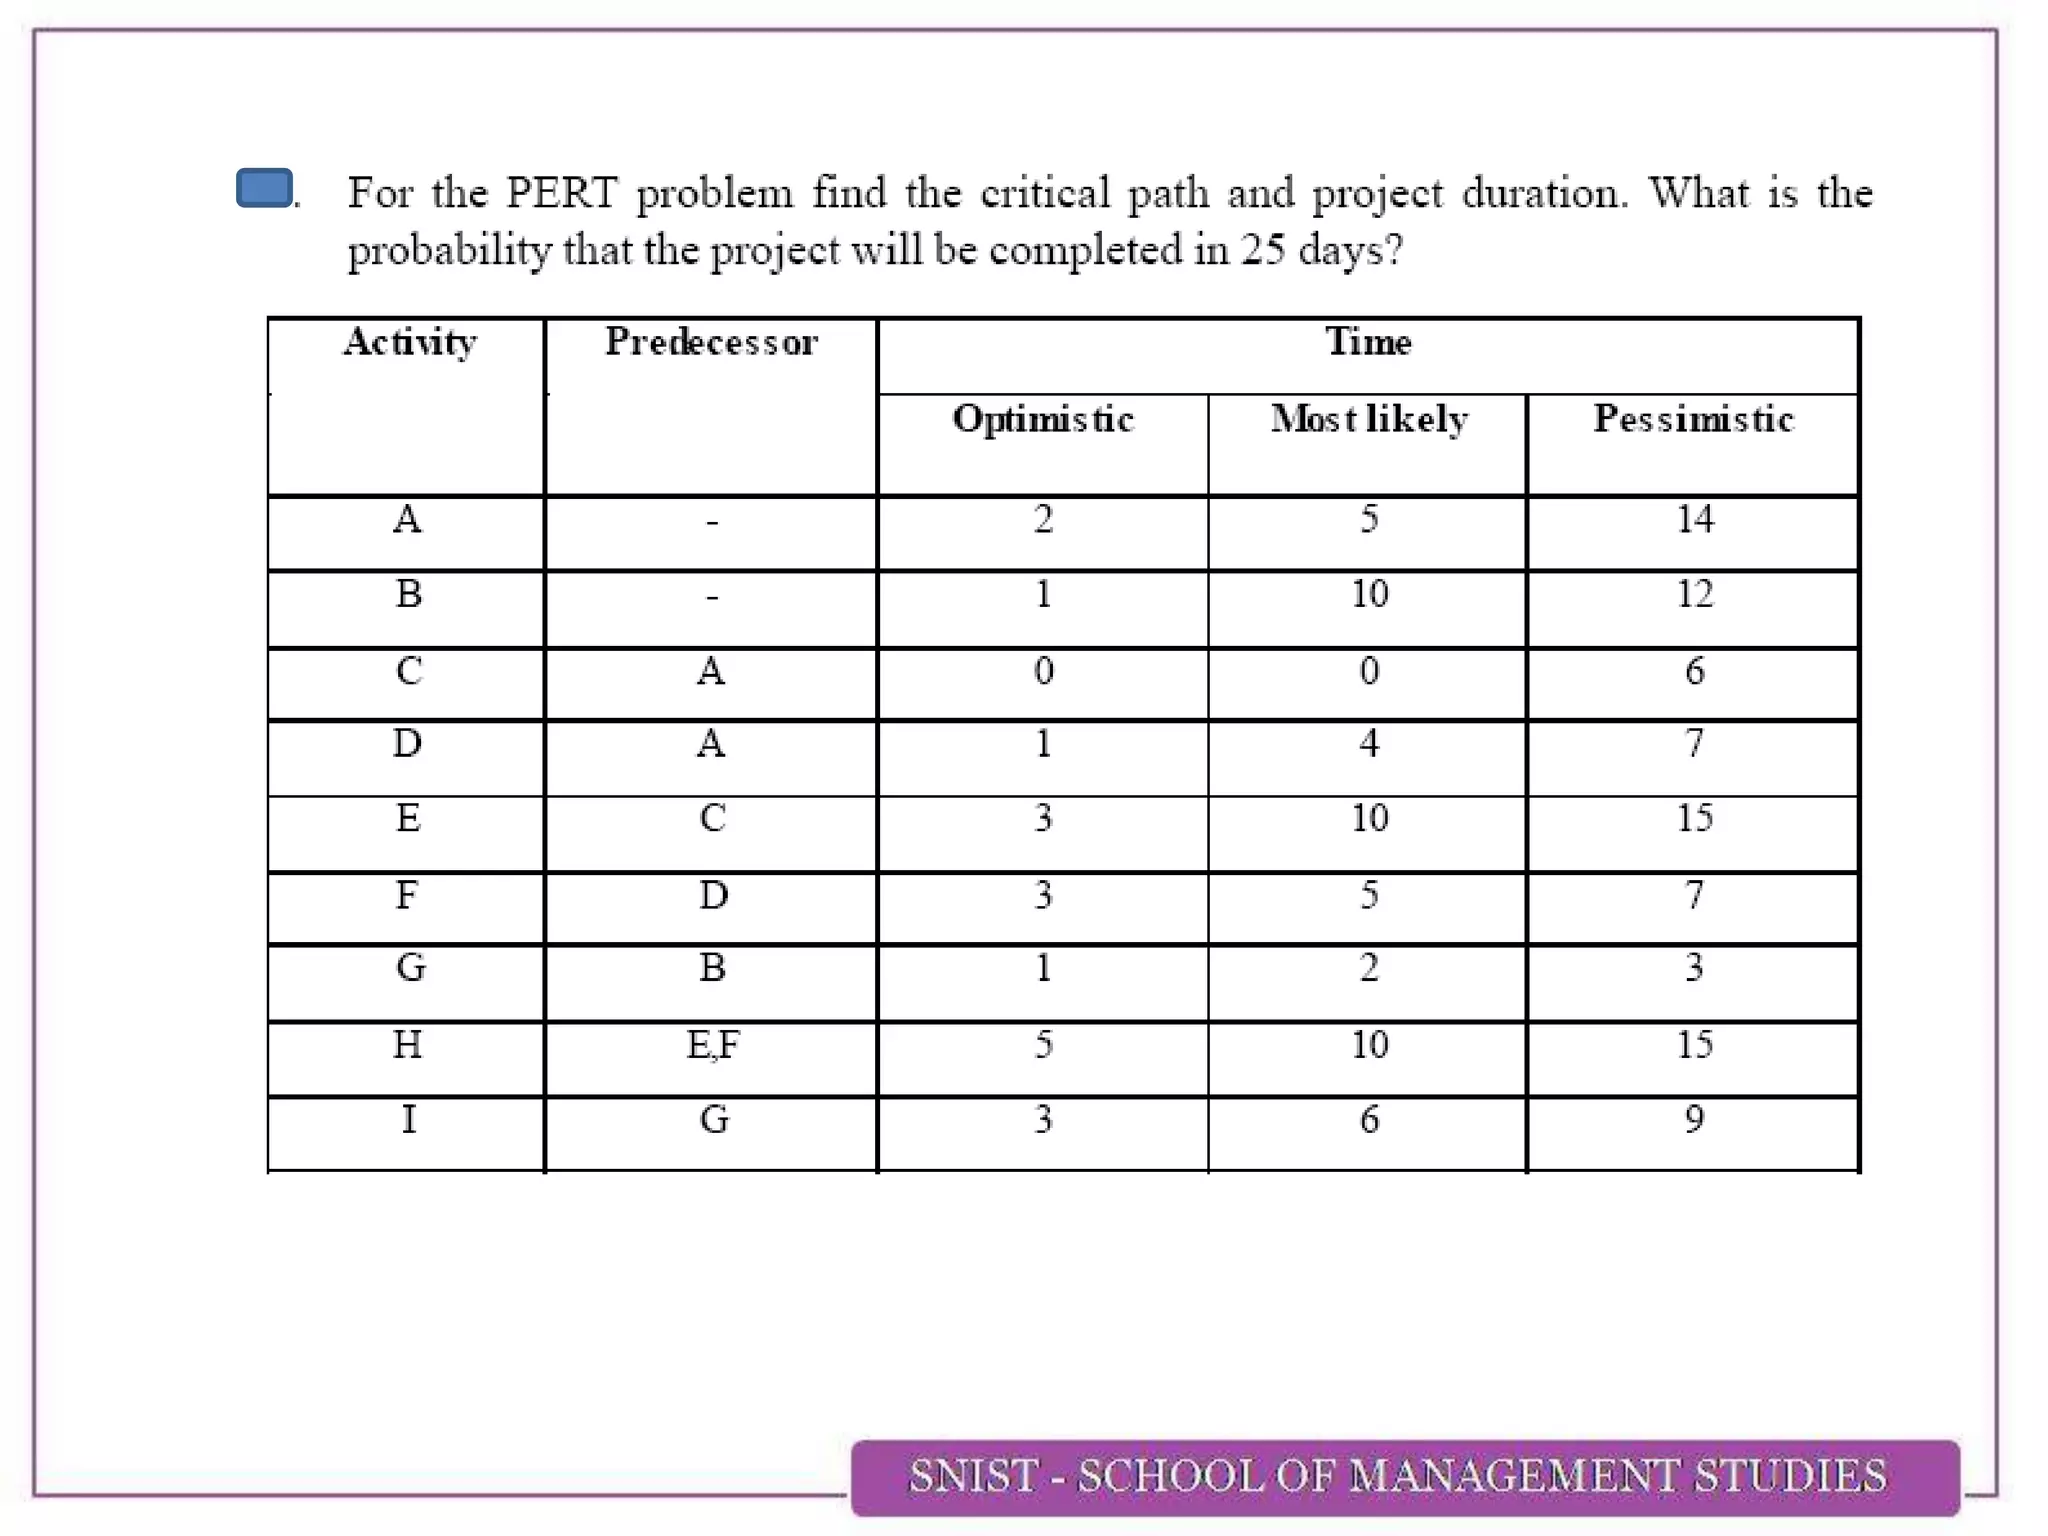


The document discusses PERT (Program/Project Evaluation Review Technique), a method used to analyze and represent the tasks involved in complex projects. PERT uses three time estimates (optimistic, most likely, pessimistic) to calculate the expected duration of tasks and projects in a probabilistic manner. It also describes calculating variance, critical paths, and the probability of completing a project within a scheduled time. An example problem demonstrates drawing a PERT network, finding the critical path and calculating the probability of completing an R&D project in a given number of days. Cost analysis and crashing activities to reduce project duration at additional cost are also summarized.


