This document provides an overview of key concepts in project management. It describes the project life cycle, network planning techniques like PERT and CPM, identifying the critical path, calculating completion times, reducing project duration through crashing, and integrating project management across the organization. Specific techniques like adding buffers to critical chains in the critical chain approach are also summarized.
This document discusses project management techniques like PERT and CPM. It describes how they can be used to diagram networks of project activities, estimate completion times, and identify critical paths. The document provides an example of applying these techniques to a project involving 11 activities and determining its expected duration is 44.83 weeks. It also discusses how project management information is used across different organizational functions.
1LocationFixed CostsVariable Costs per unitA=BB=CC=DA$85,000260006.docxdrennanmicah
1LocationFixed CostsVariable Costs per unitA=BB=CC=DA$85,000260006666.66666666677500B$55,0007C$35,00010D$65,0006average weekly demand50unitsstandard deviation 8units95%1.645Safety Stock 13unitsTherefore Target inventory level= lead time demand + safety stockLead time2WeeksLead time demand100Target inventory level=113
2Activity a=Optimistic Time Estimate(weeks)m=Most likely Time Estimates (weeks)b=Pessimistic Time Estimates(weeks)Immediate predecessor(s)T€=(a+4m+b)/6Var=((b-a)/6)^2Std.devA369none611B357A50.44444444440.6666666667C4712A7.33333333331.77777777781.3333333333D4810B7.666666666711E51016C10.16666666673.36111111111.8333333333F345D,E40.11111111110.3333333333G369D.E611H5610F6.50.69444444440.8333333333I5811G811J333H,I300ABDFHJ32.17ABDGIJ35.67ACEFHJ37.00ACEGIJ40.50CriticalStd.dev6.17probability of completing the project in 44 weeks44Z0.57probability0.71
3Forecast Ft (given a)Abs. ErrorSquare Error2-period moving averageAbs. ErrorSquare ErrorActuals (At)0.2exponential smoothing a= 0.2a= 0.2115172416.51.52.2521816.601.41.96162431416.882.888.2944151141616.300.3040.09241614.51.52.2551316.243.243210.5183462414.51.52.2561615.590.405440.1643815936160010.2325.037.5011.75exponential smoothing a= 0.22-period moving averageMSE4.17161.9583MAD1.70541.2500
Project Management
(Chapter 16)
Production & Operations Management
INFO 335-71
Week 4
Learning Objectives
Describe project management objectives
Describe the project life cycle
Diagram networks of project activities
Estimate the completion time of a project
Compute the probability of completing a project
by a specific time
Determine how to reduce the length of a project
effectively
Describe the critical chain approach to proje.
The document describes a project with seven activities and provides their:
1) Optimistic, most likely, and pessimistic time estimates. The critical path is determined to be activities A, D, E, I, J, C, H, K with a project completion time of 11 weeks.
2) Logical sequence, normal and crash time and cost estimates. The critical path is activities A, C, F with a total crashing cost of Rs. 41,000.
3) Time estimates for activities A-G to determine the expected project completion time using the network diagram and calculate the probability of completing at least 2 weeks earlier.
The document discusses PERT (Program Evaluation and Review Technique) and CPM (Critical Path Method), which are project management techniques developed in the 1950s to schedule, monitor, and control complex projects. It provides definitions of PERT and CPM, the six basic steps to use them, and their importance in answering questions about project timelines, resource needs, and costs. The techniques involve breaking a project into activities, determining their relationships and time estimates, and analyzing the network to identify the critical path requiring the closest monitoring. The document also reviews an example application of PERT and outlines advantages and limitations of the project management approaches.
The document discusses project management techniques including project planning, scheduling, and controlling. It describes tools like the work breakdown structure, Gantt charts, critical path method (CPM), and program evaluation and review technique (PERT) that are used to define projects, relate activities, and monitor schedule and resources. Bechtel is provided as an example of a large project management firm that uses these techniques to manage complex global construction projects.
A project consists of interconnected activities that are to be executed in a certain order before the entire task is completed. The activities are interrelated in a logical sequence which is known as precedence relationship. The project is represented in the form of a network for analytical treatment to get a solution for scheduling and controlling activities.
In this project, To schedule the activities, we have applied the "CPM " and "PERT" method.
The document discusses Programme Evaluation and Review Technique (PERT), a method used to analyze and represent the tasks involved in complex projects. PERT uses three time estimates - optimistic, pessimistic, and most likely - to calculate the expected time for each task. It then builds a network diagram to identify the critical path with the longest expected duration. This determines the minimum time needed to complete the project. The document provides examples to demonstrate calculating task times, constructing the network, identifying the critical path, and using PERT to determine the probability of completing a project within a deadline. It also discusses how crashing the critical path by adding resources can potentially reduce the project duration but at an increased cost.
This document discusses project management techniques CPM and PERT. It begins by defining a project and project management. It then covers network planning methods including CPM and PERT. The key steps in both are described as defining the project, diagramming the network, estimating times, and monitoring progress. Time estimates in CPM use fixed durations while PERT uses optimistic, most likely, and pessimistic estimates. The document provides examples and differences between the two techniques.
This document discusses project management techniques CPM and PERT. It begins by introducing network planning methods for managing projects, which involve describing the project, diagramming the network, estimating completion times, and monitoring progress. It then explains how to create network diagrams using the activity-on-arc and activity-on-node approaches. Next, it covers estimating activity times and identifying critical paths using forward and backward passes. The document concludes by defining CPM and PERT, outlining their steps, and noting their differences and limitations.
This document discusses project management techniques like PERT and CPM. It explains that PERT and CPM use network diagrams to analyze the sequence and duration of project activities to determine the critical path and project duration. The document provides examples of network diagrams and describes key aspects of PERT/CPM like crashing activities to shorten the project duration.
The document provides information about an activity diagram for a project including activities, predecessors, durations, paths and time estimates. It includes:
1) An activity diagram with 11 activities, their predecessors, and durations in weeks.
2) Three critical paths through the activities and their total durations ranging from 22-41 weeks.
3) A table with probabilistic time estimates (optimistic, most likely, pessimistic) for each activity.
4) Calculations of expected durations for each path using the probabilistic estimates.
This document discusses project management techniques CPM and PERT. It begins by defining a project and project management. It then discusses network planning methods including CPM and PERT. The four steps to managing a project with these methods are described: describing the project, diagramming the network, estimating time of completion, and monitoring progress. Key concepts like activities, precedence relationships, and events are also defined. The document goes on to provide details on CPM and PERT, including estimating time, determining critical paths, and differences between the two methods.
The document discusses project scheduling techniques like PERT and CPM. It provides an example of using these methods to schedule the building of an elaborate parade float. Key activities, durations, and dependencies are laid out. Calculations are shown to determine the critical path, earliest and latest start/finish times, and project completion time. For activities with uncertain durations, a three-time estimate approach is described to model duration as a distribution and calculate the probability of on-time completion.
The document discusses project scheduling techniques PERT and CPM. It provides an example of using these methods to schedule the building of an elaborate parade float. Key activities, durations, and dependencies are laid out. Earliest and latest start/finish times are calculated. The critical path is identified as several critical activities that must be completed on schedule. The project completion time is estimated at 18 days based on the critical path. Uncertain activity times and calculating the probability of on-time project completion are also discussed.
SAFEASSIGNCHECKTEST - CSU SAFEASSIGN PLAGIARISM CHECK TOOL
SafeAssign Originality Report Generator I
Odell Kruah
on Fri, Nov 30 2018, 4:44 PM
100% highest match
Submission ID: d0da8619-c56f-4e34-9af1-6edd71018503
Attachments (1)
PROJECT VI.docx
1 ODELL KRUAH PROJECT MANAGEMENT UNIT VI NOVEMBER 30,
2018
Part 1
1 DEVELOP AN IN-DEPTH SCHEDULE FOR THE PROJECT YOU
SELECTED AND USED TO DEVELOP THE STATEMENT OF WORK AND
WORK BREAKDOWN STRUCTURE IN UNIT III. PLEASE REFER TO
THE INTEGRATED PROJECT IN CHAPTER 10 ON PAGE 363 (PROJECT
SCHEDULING) OF THE TEXTBOOK FOR MORE INFORMATION. BE
SURE TO INCLUDE THE FOLLOWING COMPONENTS:
· AN ACTIVITY PRECEDENCE DIAGRAM, · AN ACTIVITY DURATION
TABLE, AND · A NETWORK DIAGRAM AND GANTT CHARTS.
· AN ACTIVITY PRECEDENCE DIAGRAM:
(http://safeassign.blackboard.com/)
PROJECT VI.docx
Word Count: 862 Attachment ID: 244309330
100%
ACTIVITY DURATION TABLE:
ACTIVITY EXPECTED DURATION PREDECESSOR
A 5 DAYS ----
B 10 DAYS A
C 8 DAYS A
D 1 DAY A
E 5 DAYS B, C
F 10 DAYS D, E
G 14 DAYS F
H 3 DAYS G
I 12 DAYS F
J 6 DAYS H, I
A NETWORK DIAGRAM AND GANTT CHARTS:
A
B
C
D
E
F
G
H
I
J
Part 2
1 PLEASE COMPLETE CASE STUDY 10.1: PROJECT SCHEDULING AT
BLANQUE CHECK CONSTRUCTION ON PAGE 360 OF THE TEXTBOOK,
AND ANSWER THE THREE QUESTIONS AT THE END.
Q1(ANS)
PRECEDENCE DIAGRAM:
1 C=DIFFERENT CONSRUCTION TYPES OF SCHEDULING METHODS
TYPE FROM 1 TO 9 P= DIFFERENT CONSRUCTION PROJECTS WHICH
SHOW THE TYPES OF SCHEDULING METHODS TYPE FROM 1 TO 9
O1=ORGANIZATION ONE O2= ORGANIZATION 2
S E C4 C5 O1 P9 P8 O2 P7 P6 P5 P4 P3 P2 C9 C8 C7 C6 C1 C2 C3 P1
Q2(ANS) ACCORDING TO MY RESEARCH LEVEL AND LITERATURE
REVIEW THE EXPERT OPINION AND PAST HISTORY BOTH ARE THE
BEST TO SOLVE PROBLEM FOR CALCULATING THE CRITICAL
PATH ,WHICH MAY ALSO TELL US THE DURATION OR PROJECT
DELAY TO HANDLE OR RUN OUR CONSTRUCTION COMPANY.
Q3(ANS) THESE BOTH HAVE SOME STRENGTHENS AND
WEAKNESSES AND BOTH GIVE THE RESULTS PROBABLY SAME , BUT
ACCORDING TO LITERATURE AOA IS THE BENEFICIAL FOR
MODELING IT WILL BE HELPFUL AND IN THE BUSINESS FIELD IT
WILL BE IMPORTANT AON WILL BE LESS WIDELY USED , IN CASE OF
LARGE AND COMPLEX PROJECTS IT IS EASIER TO EMPLOY THE
PATH PROCESS USED IN THE AOA. ACCORDING TO AOA WE
ACHIEVE THE EVERY MILESTONE AND PARTICULARLY USED THE
DUMMY PROJECTS OR ACTIVITIES THE CONCEPT OF DUMMY
PROJECT IS NOT SIMPLE AND EASY IT REQUIRE MORE TRAINING
AND PRACTICE. AON CONVENTION ,AOA NETWORK USED BOTH
NODES AND ARROW TO LABEL THE PROJECT.
Part 3
1 DEVELOP A NETWORK ACTIVITY CHART, AND IDENTIFY THE
CRITICAL PATH FOR A PROJECT BASED ON THE INFORMATION
PROVIDED IN THE GANTT CHART BELOW. DRAW THE ACTIVITY
NETWORK AS A GANTT CHART. WHAT IS THE EXPECTED DURATION
OF THE PROJECT?
ACTIVITY EXPECTED DURATION PREDECESSOR
A 5 DAYS ----
B 10 DAYS A
C 8 DAYS A
D 1 DAY A
E 5 DAYS B, C
F 10 DAYS D, E
G 14 DAYS F
H 3 DAYS G
I 12 DAYS F
J 6 DAYS H, I.
This chapter discusses project management concepts including defining a project, work breakdown structures, project control charts like Gantt charts, structuring projects as pure, functional or matrix, critical path scheduling, and using critical path methodology with single and three-time estimates to determine project duration and probability of completion. Key aspects of project management include identifying and sequencing tasks, determining the critical path, and using the critical path to schedule the project and identify slack times. Critical path methodology helps project managers optimize schedules and resources.
The document discusses project management concepts including:
- A project has defined start and end times, related activities directed at a unique goal.
- Project management involves planning, scheduling, and controlling resources to meet time, cost and technical constraints.
- The critical path is the longest sequence of dependent activities that determines the shortest time to complete the project. Any delays on the critical path delay the entire project.
The document discusses project management concepts including:
- A project has defined start and end times and is directed at a unique goal.
- Project management involves planning, scheduling, and controlling resources to meet time, cost and technical constraints.
- The critical path is the longest sequence of dependent activities that determines the shortest time to complete the project. Any delays on the critical path will delay the whole project.
This document provides an overview of critical path method (CPM) and program evaluation and review technique (PERT) project management tools. It discusses how CPM and PERT are used to plan network diagrams, estimate activity times, and identify critical paths. Key steps include describing the project, diagramming activities and relationships, calculating earliest and latest start/finish times, and monitoring progress. PERT additionally considers optimistic, most likely, and pessimistic time estimates to determine expected durations. Both tools help schedule projects and identify activities that could impact completion dates.
This document discusses project management and the critical path method technique. It defines project management as planning, directing, and controlling resources to meet time, cost, and technical constraints. The critical path method allows project managers to identify the critical activities and completion time of a project by determining the earliest and latest times of each activity. The document provides examples of constructing critical path networks and calculating key timing metrics to schedule and control a project.
This document discusses project planning, scheduling, and controlling techniques. It covers topics like work breakdown structures, critical path method (CPM), program evaluation and review technique (PERT), Gantt charts, and the roles of project managers. The document provides examples to illustrate key concepts. It shows how to develop a network diagram for a project, determine the critical path, and perform forward and backward passes to calculate earliest and latest start/finish times.
The document discusses project scheduling techniques like the Critical Path Method (CPM) and Program Evaluation and Review Technique (PERT). It explains how a network diagram shows the logical dependencies and sequence of tasks in a project. Calculating earliest and latest start/finish times helps identify the critical path and float for activities. PERT is useful for projects with uncertain durations, using 3 time estimates. The critical path determines the minimum project duration, and monitoring it helps complete the project on schedule.
Project management involves planning, directing, and controlling resources to complete a project on time, within budget, and according to specifications. A key tool is the work breakdown structure, which defines the hierarchy of tasks and subtasks. The critical path method identifies the longest path of activities in a project as the critical path. It is important for scheduling and determining which activities have slack time. Time-cost tradeoff models determine the least costly way to reduce a project's duration.
The document discusses project management concepts including defining a project, project management, and structuring projects. It defines a project as a series of related jobs directed towards an output that requires significant time. Project management is defined as planning, directing, and controlling resources to meet technical, cost, and time constraints. There are different ways to structure projects including pure projects, functional projects, and matrix projects, each with their own advantages and disadvantages.
1) The document discusses project management tools including network analysis techniques like CPM and PERT.
2) CPM and PERT are used to plan and schedule complex projects using network diagrams that show the logical sequence and relationships of tasks.
3) PERT uses three time estimates for each activity - optimistic, most likely, and pessimistic - to calculate the expected duration using probability.
The document discusses organizing procurement processes and activities through project management techniques. It explains that procuring big projects requires well-organized activities prior to execution. Project management involves planning, scheduling, and controlling phases. Planning includes defining goals and teams. Scheduling sequences activities and allocates time. Controlling monitors resources, costs, quality and budgets to revise plans if needed. Popular techniques like Gantt charts, PERT and CPM help with planning, scheduling and controlling. These network approaches involve defining relationships between activities to identify critical paths and ensure on-time completion.
Advanced control scheme of doubly fed induction generator for wind turbine us...IJECEIAES
This paper describes a speed control device for generating electrical energy on an electricity network based on the doubly fed induction generator (DFIG) used for wind power conversion systems. At first, a double-fed induction generator model was constructed. A control law is formulated to govern the flow of energy between the stator of a DFIG and the energy network using three types of controllers: proportional integral (PI), sliding mode controller (SMC) and second order sliding mode controller (SOSMC). Their different results in terms of power reference tracking, reaction to unexpected speed fluctuations, sensitivity to perturbations, and resilience against machine parameter alterations are compared. MATLAB/Simulink was used to conduct the simulations for the preceding study. Multiple simulations have shown very satisfying results, and the investigations demonstrate the efficacy and power-enhancing capabilities of the suggested control system.
DEEP LEARNING FOR SMART GRID INTRUSION DETECTION: A HYBRID CNN-LSTM-BASED MODELgerogepatton
As digital technology becomes more deeply embedded in power systems, protecting the communication
networks of Smart Grids (SG) has emerged as a critical concern. Distributed Network Protocol 3 (DNP3)
represents a multi-tiered application layer protocol extensively utilized in Supervisory Control and Data
Acquisition (SCADA)-based smart grids to facilitate real-time data gathering and control functionalities.
Robust Intrusion Detection Systems (IDS) are necessary for early threat detection and mitigation because
of the interconnection of these networks, which makes them vulnerable to a variety of cyberattacks. To
solve this issue, this paper develops a hybrid Deep Learning (DL) model specifically designed for intrusion
detection in smart grids. The proposed approach is a combination of the Convolutional Neural Network
(CNN) and the Long-Short-Term Memory algorithms (LSTM). We employed a recent intrusion detection
dataset (DNP3), which focuses on unauthorized commands and Denial of Service (DoS) cyberattacks, to
train and test our model. The results of our experiments show that our CNN-LSTM method is much better
at finding smart grid intrusions than other deep learning algorithms used for classification. In addition,
our proposed approach improves accuracy, precision, recall, and F1 score, achieving a high detection
accuracy rate of 99.50%.
ACEP Magazine edition 4th launched on 05.06.2024Rahul
This document provides information about the third edition of the magazine "Sthapatya" published by the Association of Civil Engineers (Practicing) Aurangabad. It includes messages from current and past presidents of ACEP, memories and photos from past ACEP events, information on life time achievement awards given by ACEP, and a technical article on concrete maintenance, repairs and strengthening. The document highlights activities of ACEP and provides a technical educational article for members.
We have compiled the most important slides from each speaker's presentation. This year’s compilation, available for free, captures the key insights and contributions shared during the DfMAy 2024 conference.
A SYSTEMATIC RISK ASSESSMENT APPROACH FOR SECURING THE SMART IRRIGATION SYSTEMSIJNSA Journal
The smart irrigation system represents an innovative approach to optimize water usage in agricultural and landscaping practices. The integration of cutting-edge technologies, including sensors, actuators, and data analysis, empowers this system to provide accurate monitoring and control of irrigation processes by leveraging real-time environmental conditions. The main objective of a smart irrigation system is to optimize water efficiency, minimize expenses, and foster the adoption of sustainable water management methods. This paper conducts a systematic risk assessment by exploring the key components/assets and their functionalities in the smart irrigation system. The crucial role of sensors in gathering data on soil moisture, weather patterns, and plant well-being is emphasized in this system. These sensors enable intelligent decision-making in irrigation scheduling and water distribution, leading to enhanced water efficiency and sustainable water management practices. Actuators enable automated control of irrigation devices, ensuring precise and targeted water delivery to plants. Additionally, the paper addresses the potential threat and vulnerabilities associated with smart irrigation systems. It discusses limitations of the system, such as power constraints and computational capabilities, and calculates the potential security risks. The paper suggests possible risk treatment methods for effective secure system operation. In conclusion, the paper emphasizes the significant benefits of implementing smart irrigation systems, including improved water conservation, increased crop yield, and reduced environmental impact. Additionally, based on the security analysis conducted, the paper recommends the implementation of countermeasures and security approaches to address vulnerabilities and ensure the integrity and reliability of the system. By incorporating these measures, smart irrigation technology can revolutionize water management practices in agriculture, promoting sustainability, resource efficiency, and safeguarding against potential security threats.
Using recycled concrete aggregates (RCA) for pavements is crucial to achieving sustainability. Implementing RCA for new pavement can minimize carbon footprint, conserve natural resources, reduce harmful emissions, and lower life cycle costs. Compared to natural aggregate (NA), RCA pavement has fewer comprehensive studies and sustainability assessments.
6th International Conference on Machine Learning & Applications (CMLA 2024)ClaraZara1
6th International Conference on Machine Learning & Applications (CMLA 2024) will provide an excellent international forum for sharing knowledge and results in theory, methodology and applications of on Machine Learning & Applications.
Literature Review Basics and Understanding Reference Management.pptxDr Ramhari Poudyal
Three-day training on academic research focuses on analytical tools at United Technical College, supported by the University Grant Commission, Nepal. 24-26 May 2024
18. Using Beta Probability Distribution to
Calculate Expected Time Durations
A typical beta distribution is shown below, note that it
has definite end points
The expected time for finishing each activity is a
weighted average
6
c
pessimisti
likely
most
4
optimistic
time
Exp.
42. Homework Hints
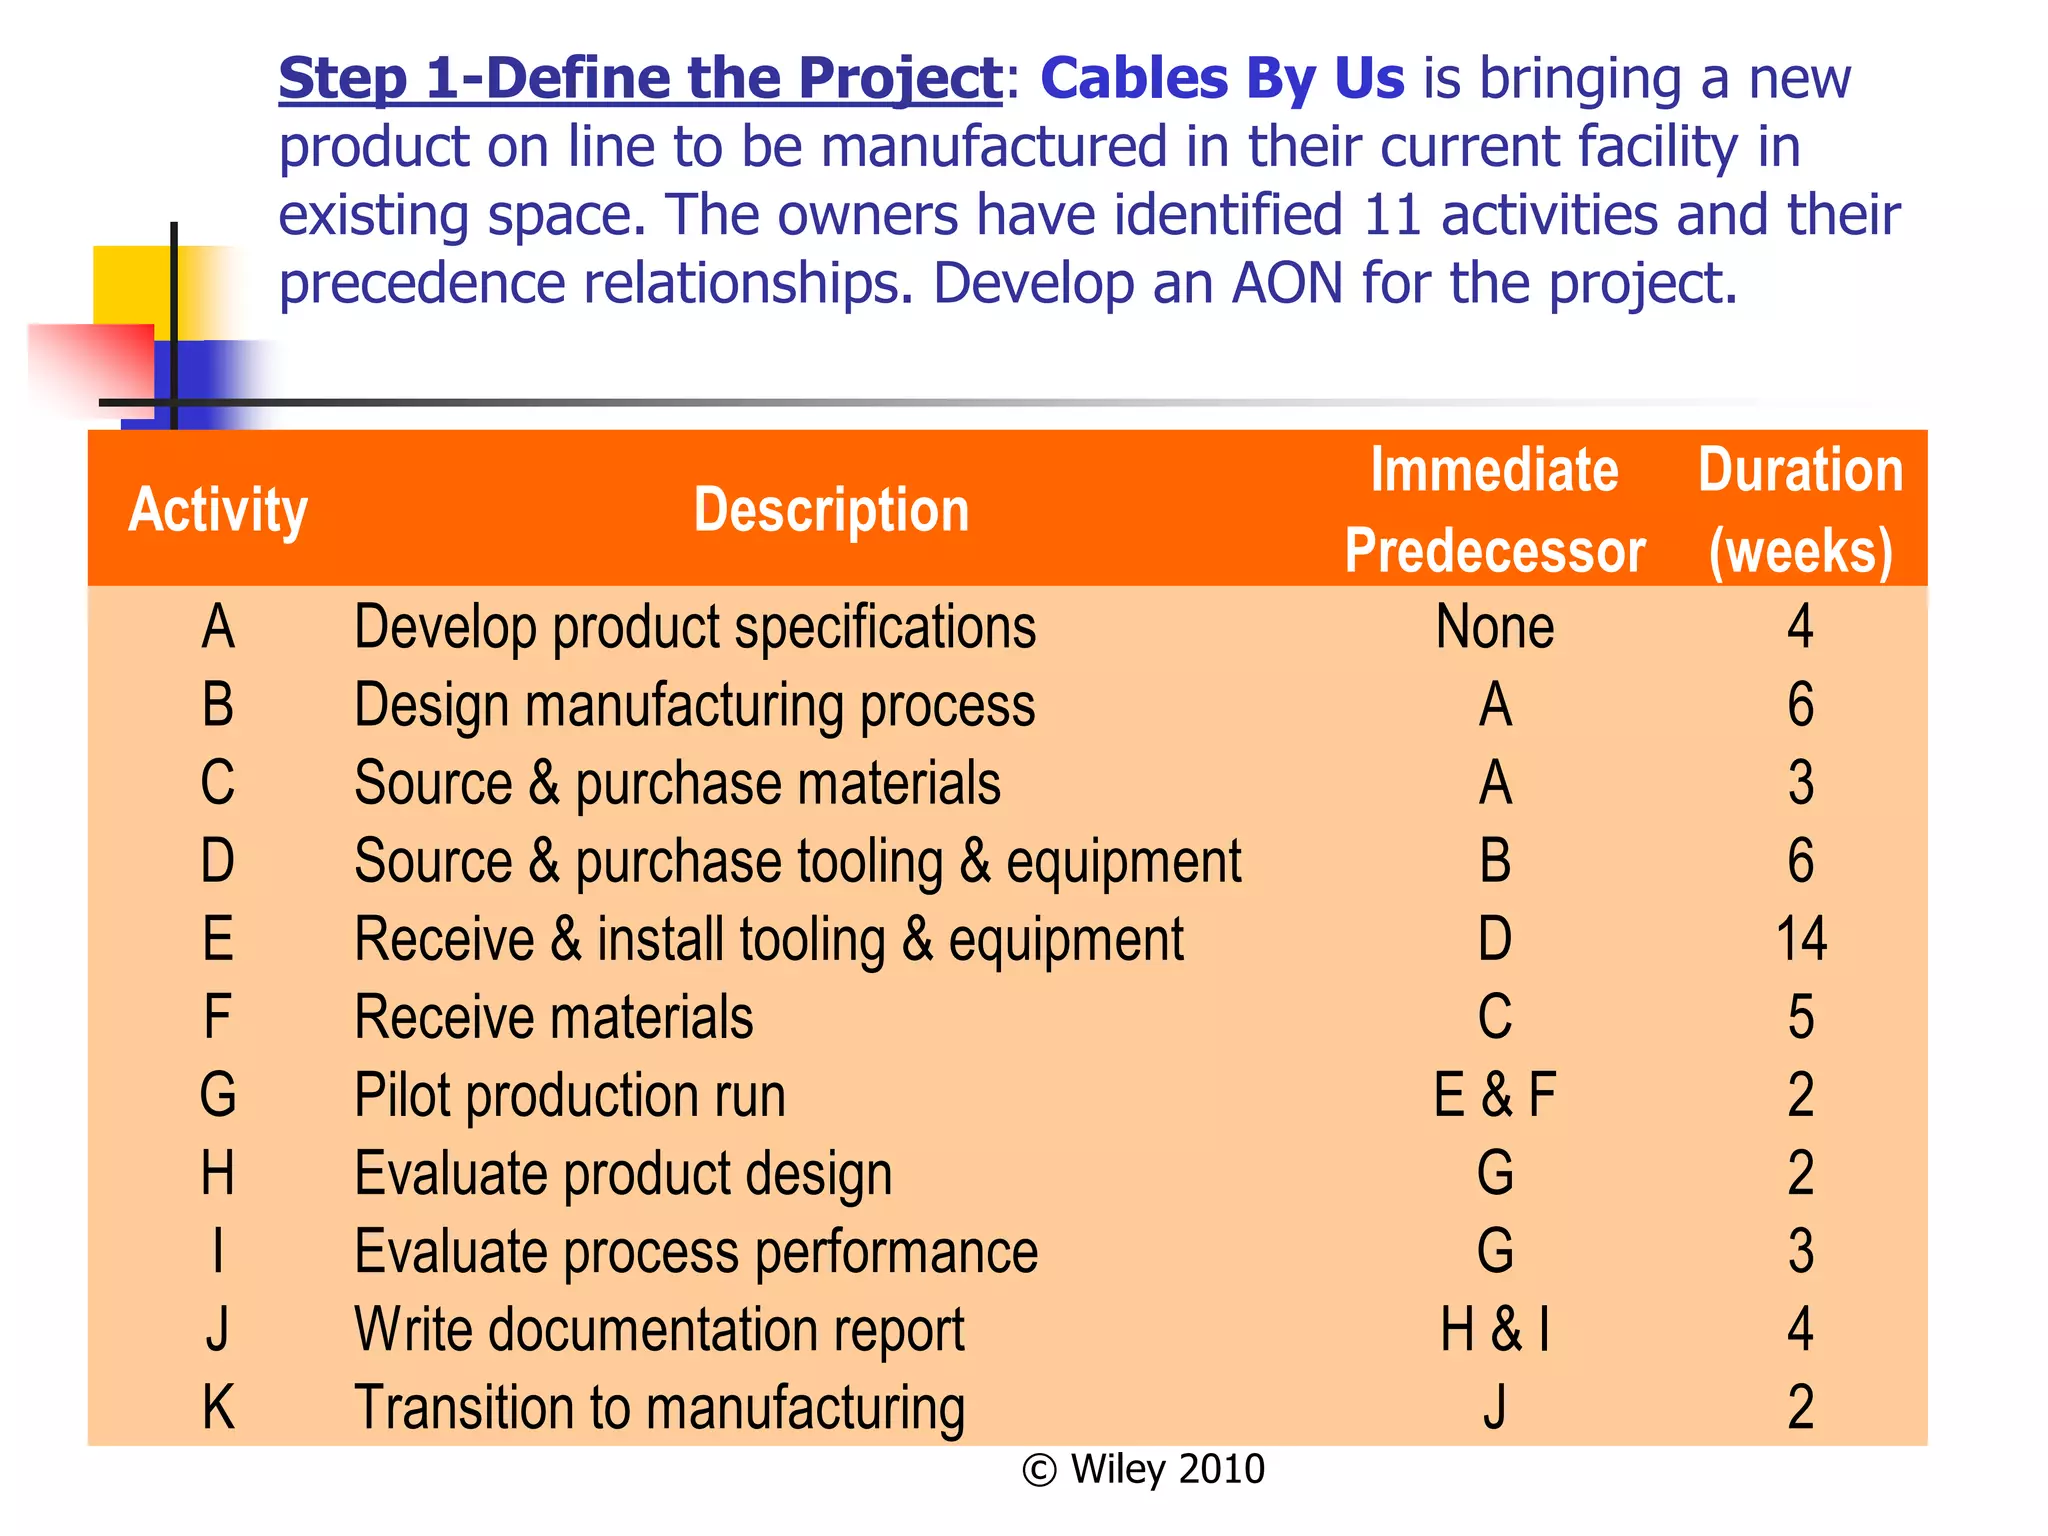
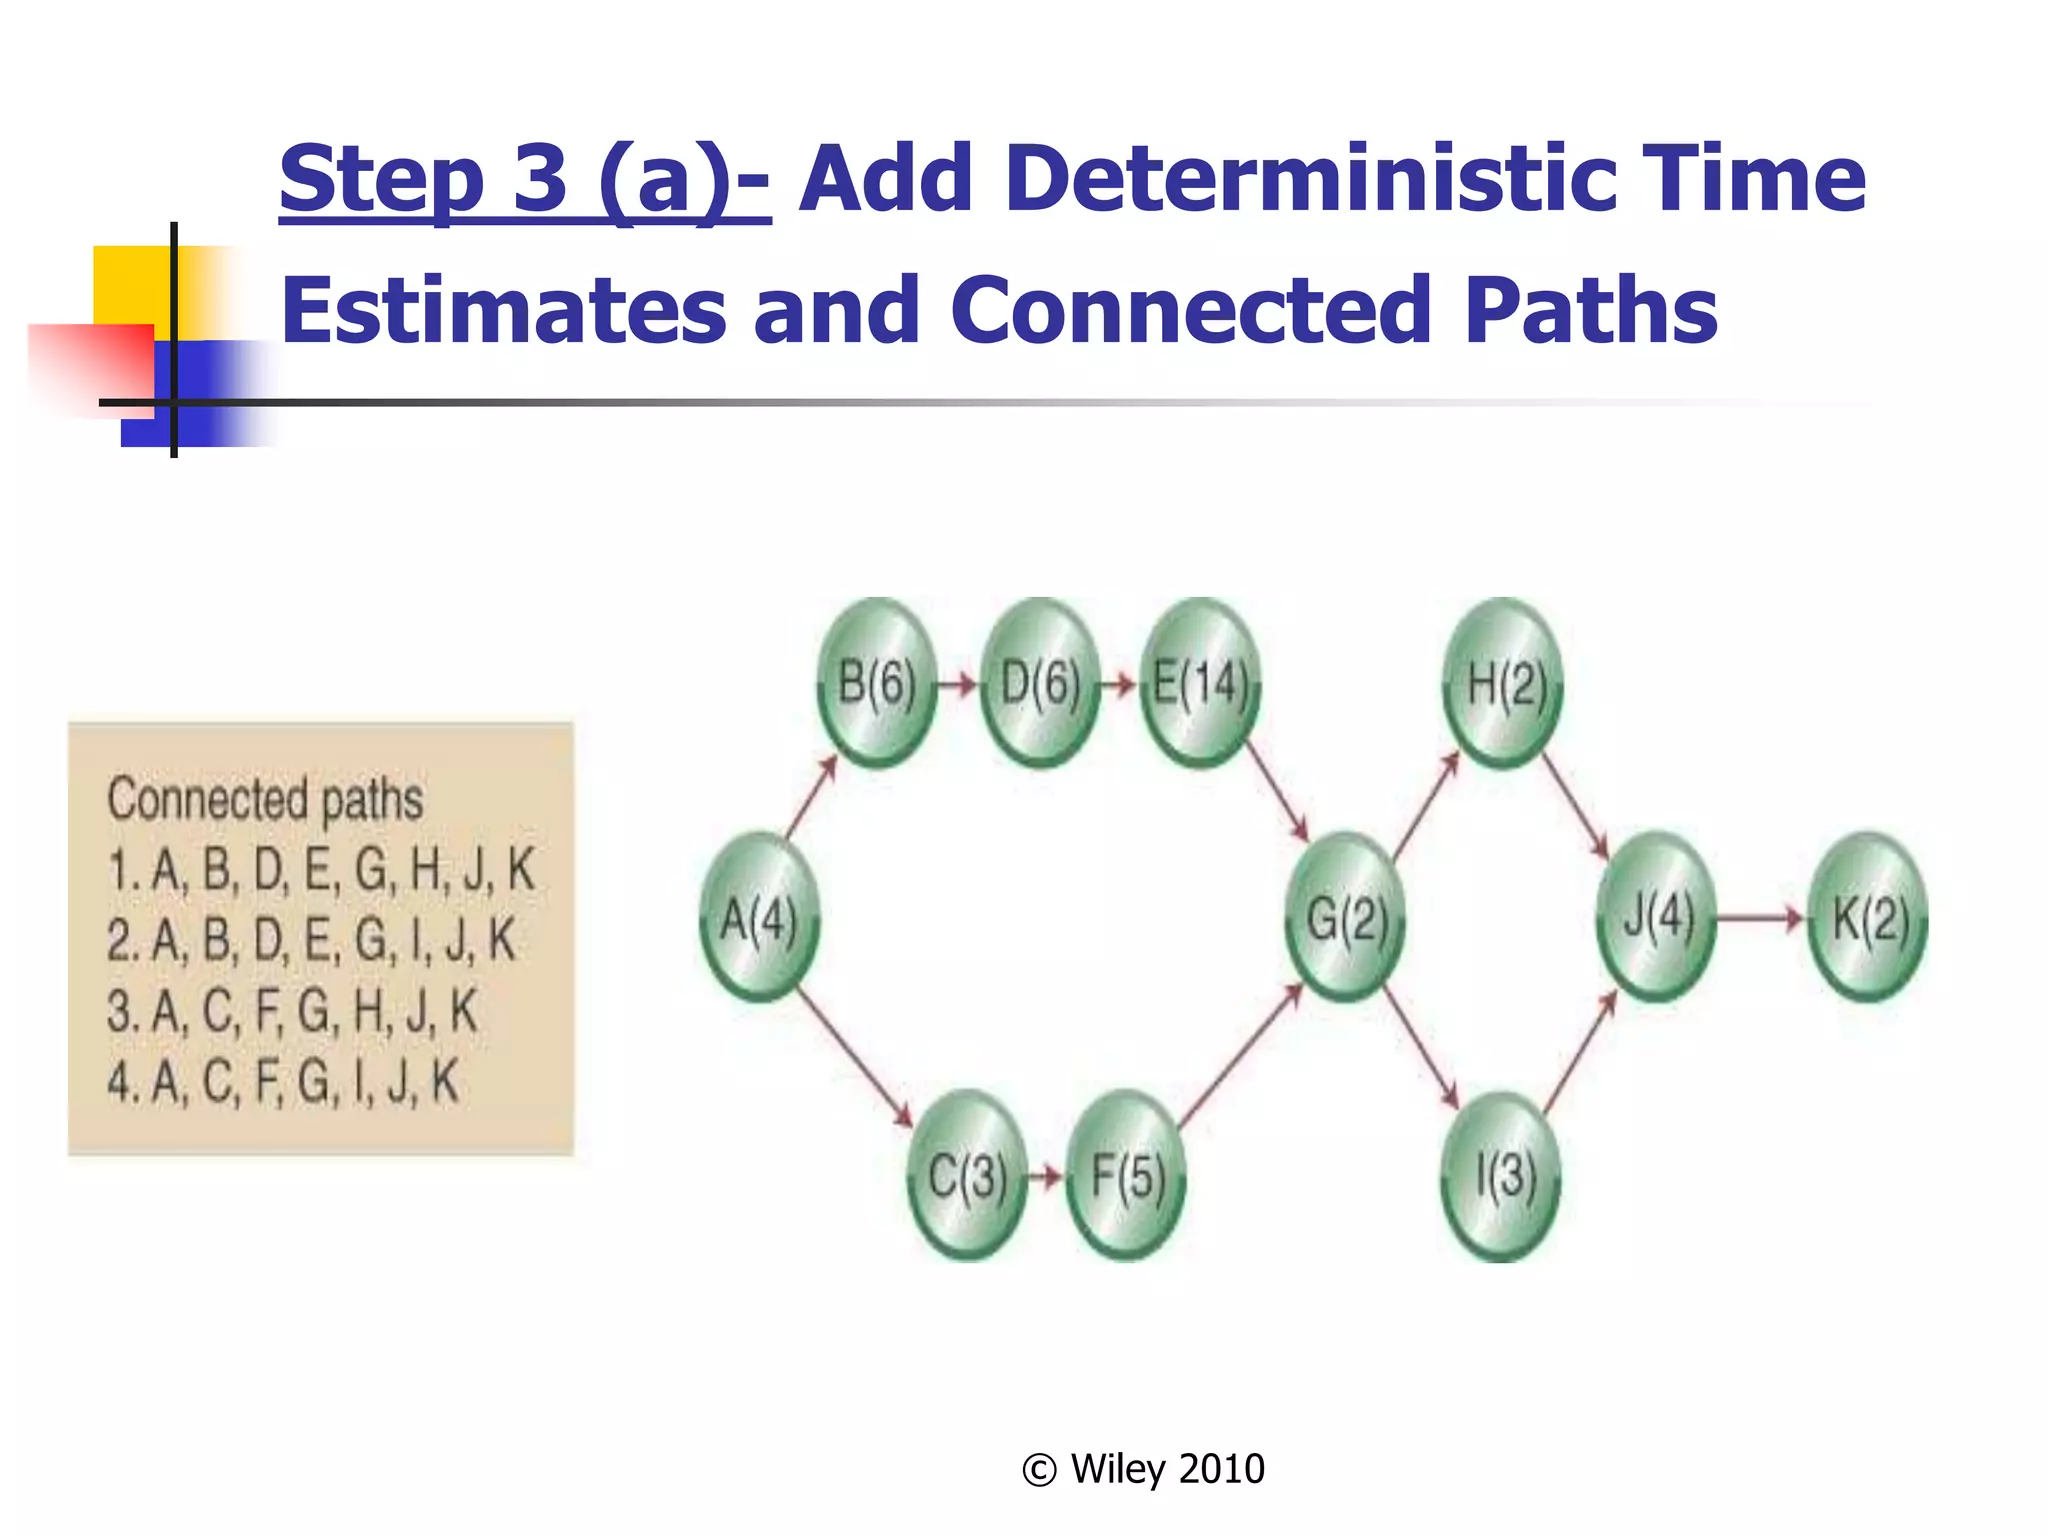
Problems 16.1-2: Use CPM deterministic
model (A). [10 points]
Problems 16.4-8: Use CPM probabilistic
model (A). Use the AON diagram for 16.4.
[20 points]
Problems 16.9-10: Use CPM deterministic
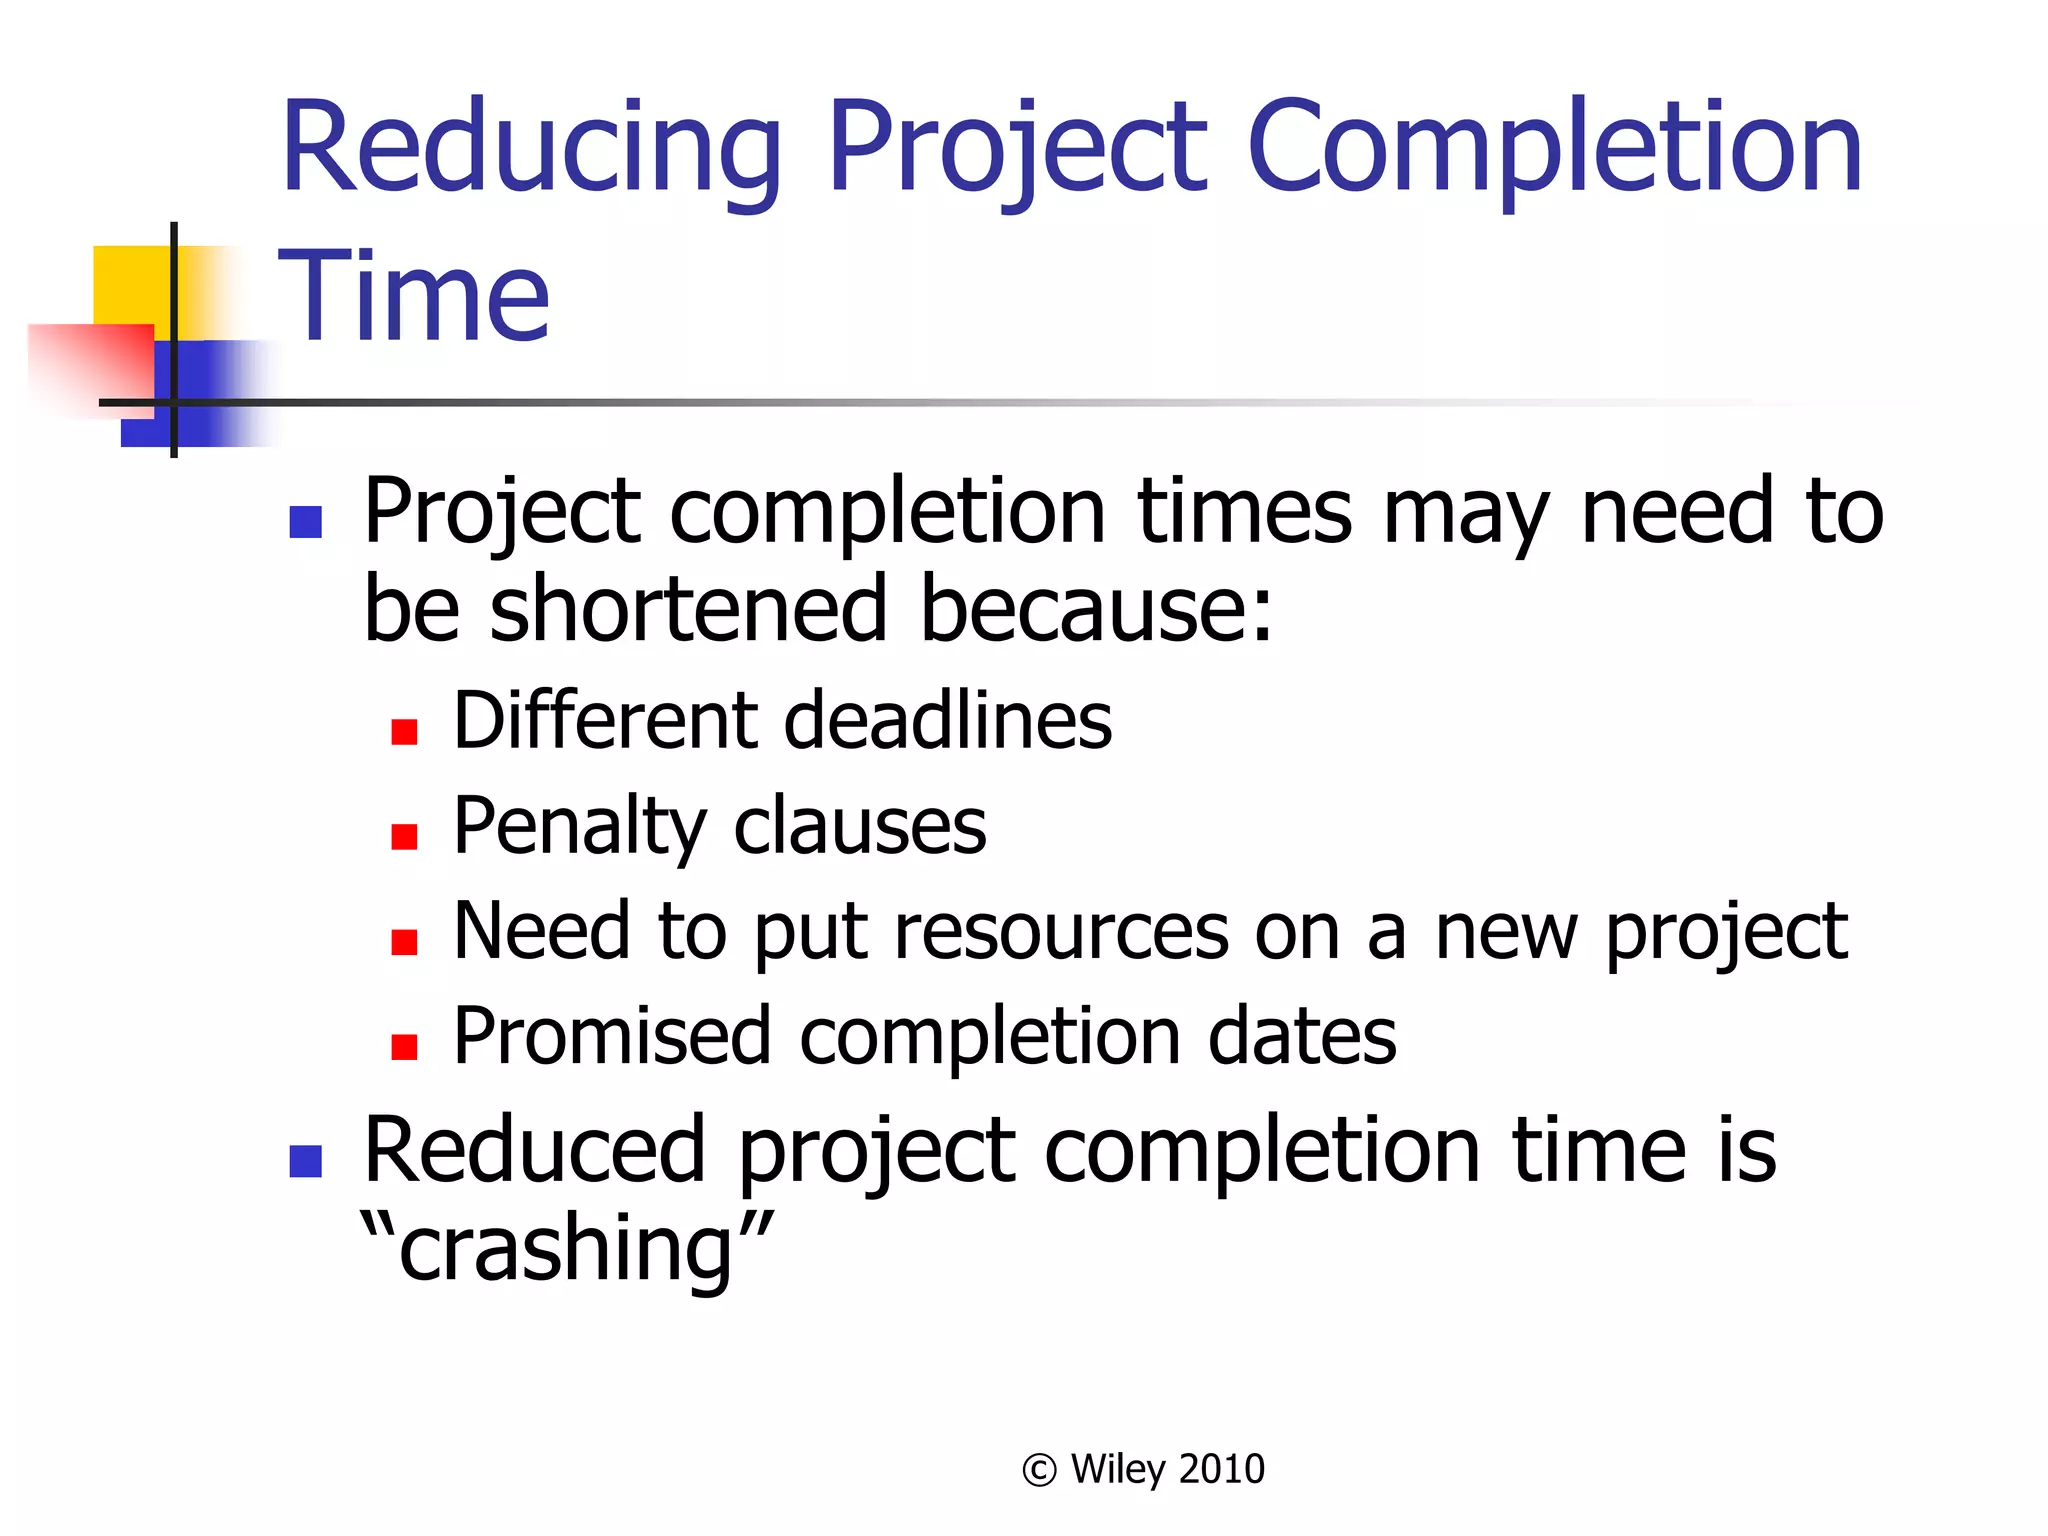
model (A). Crash the project one week at
a time—find the lowest cost task to reduce.
Watch for the creation of additional critical
paths. [10 points]