


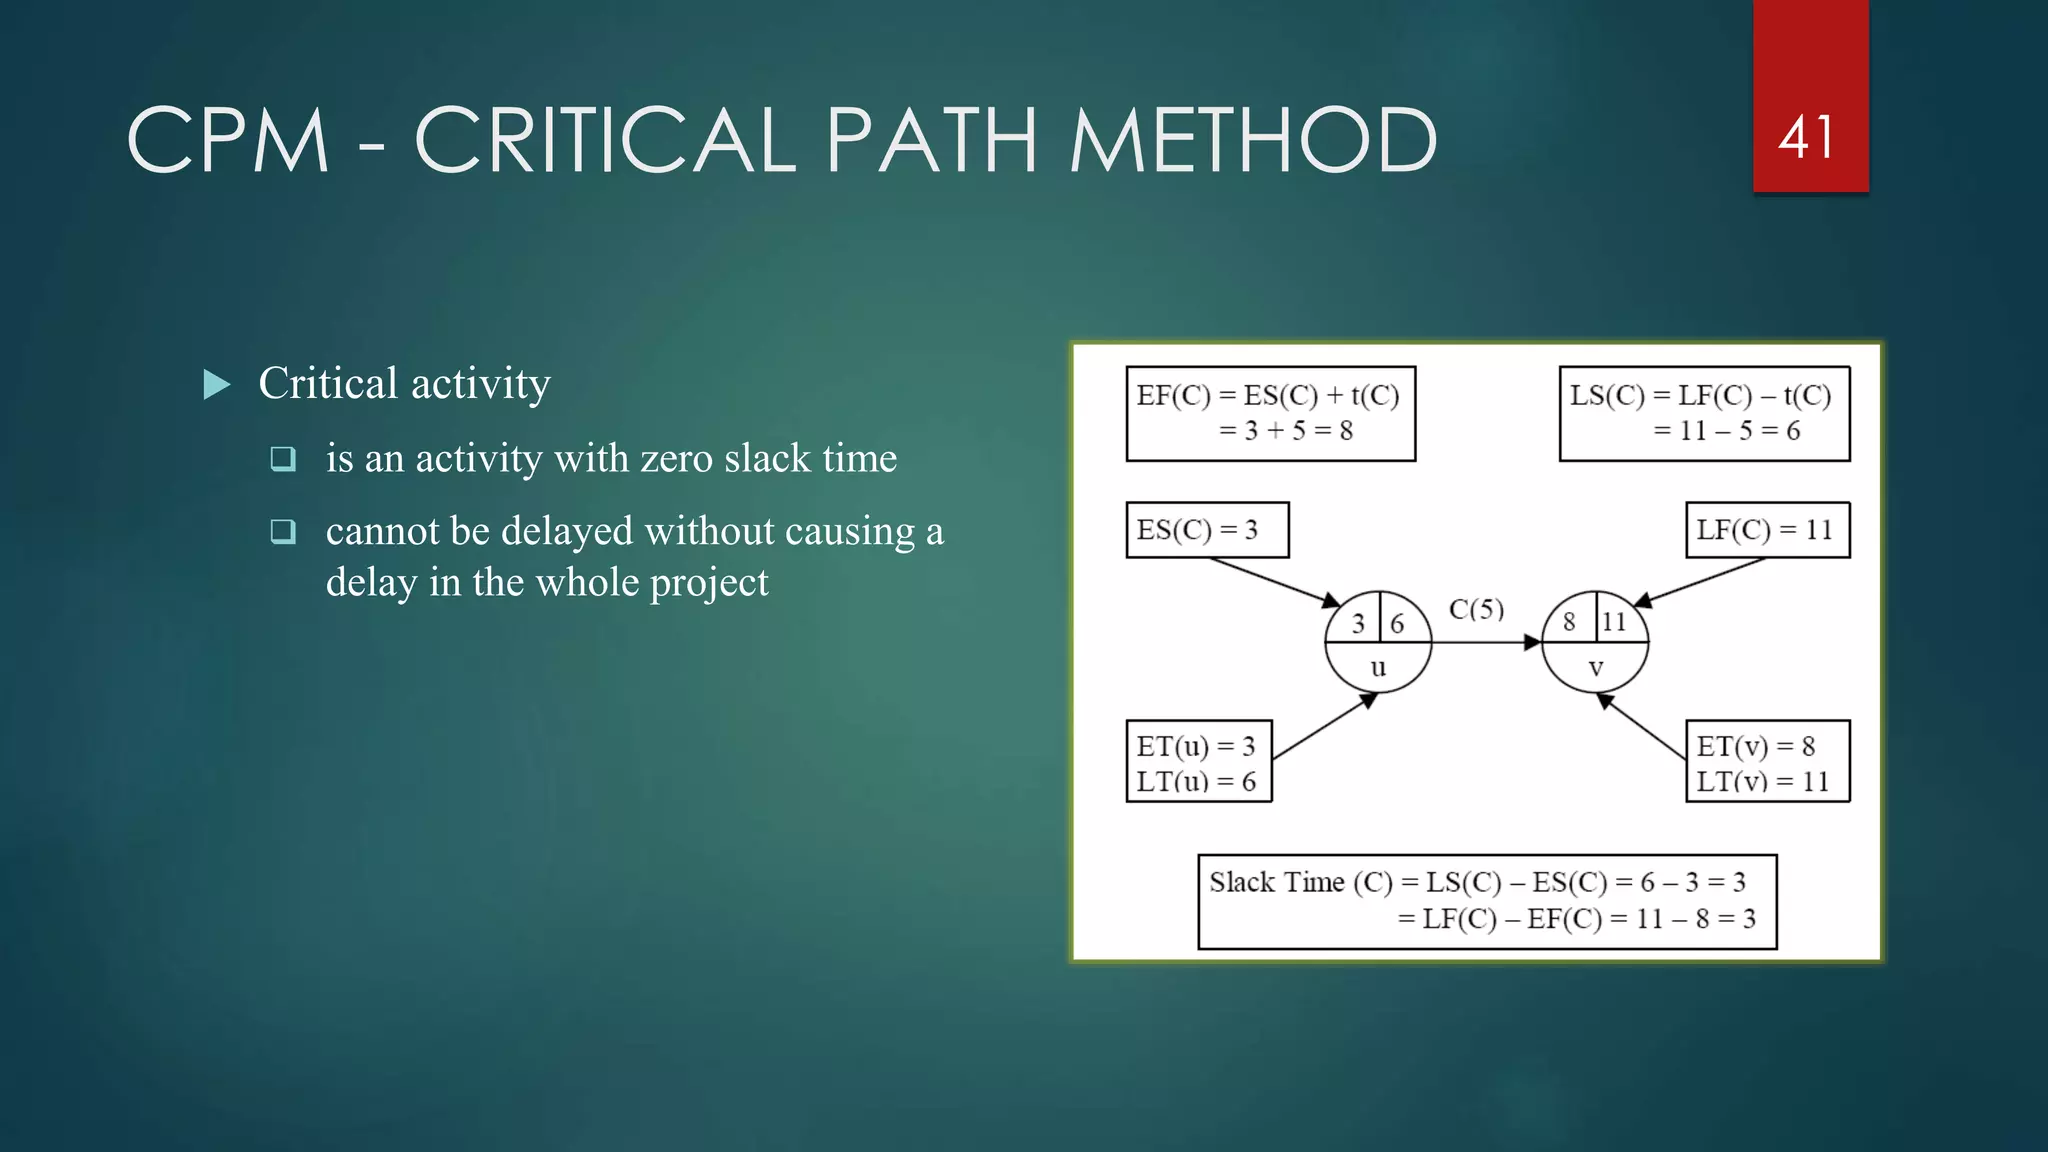
![CPM - CRITICAL PATH METHOD
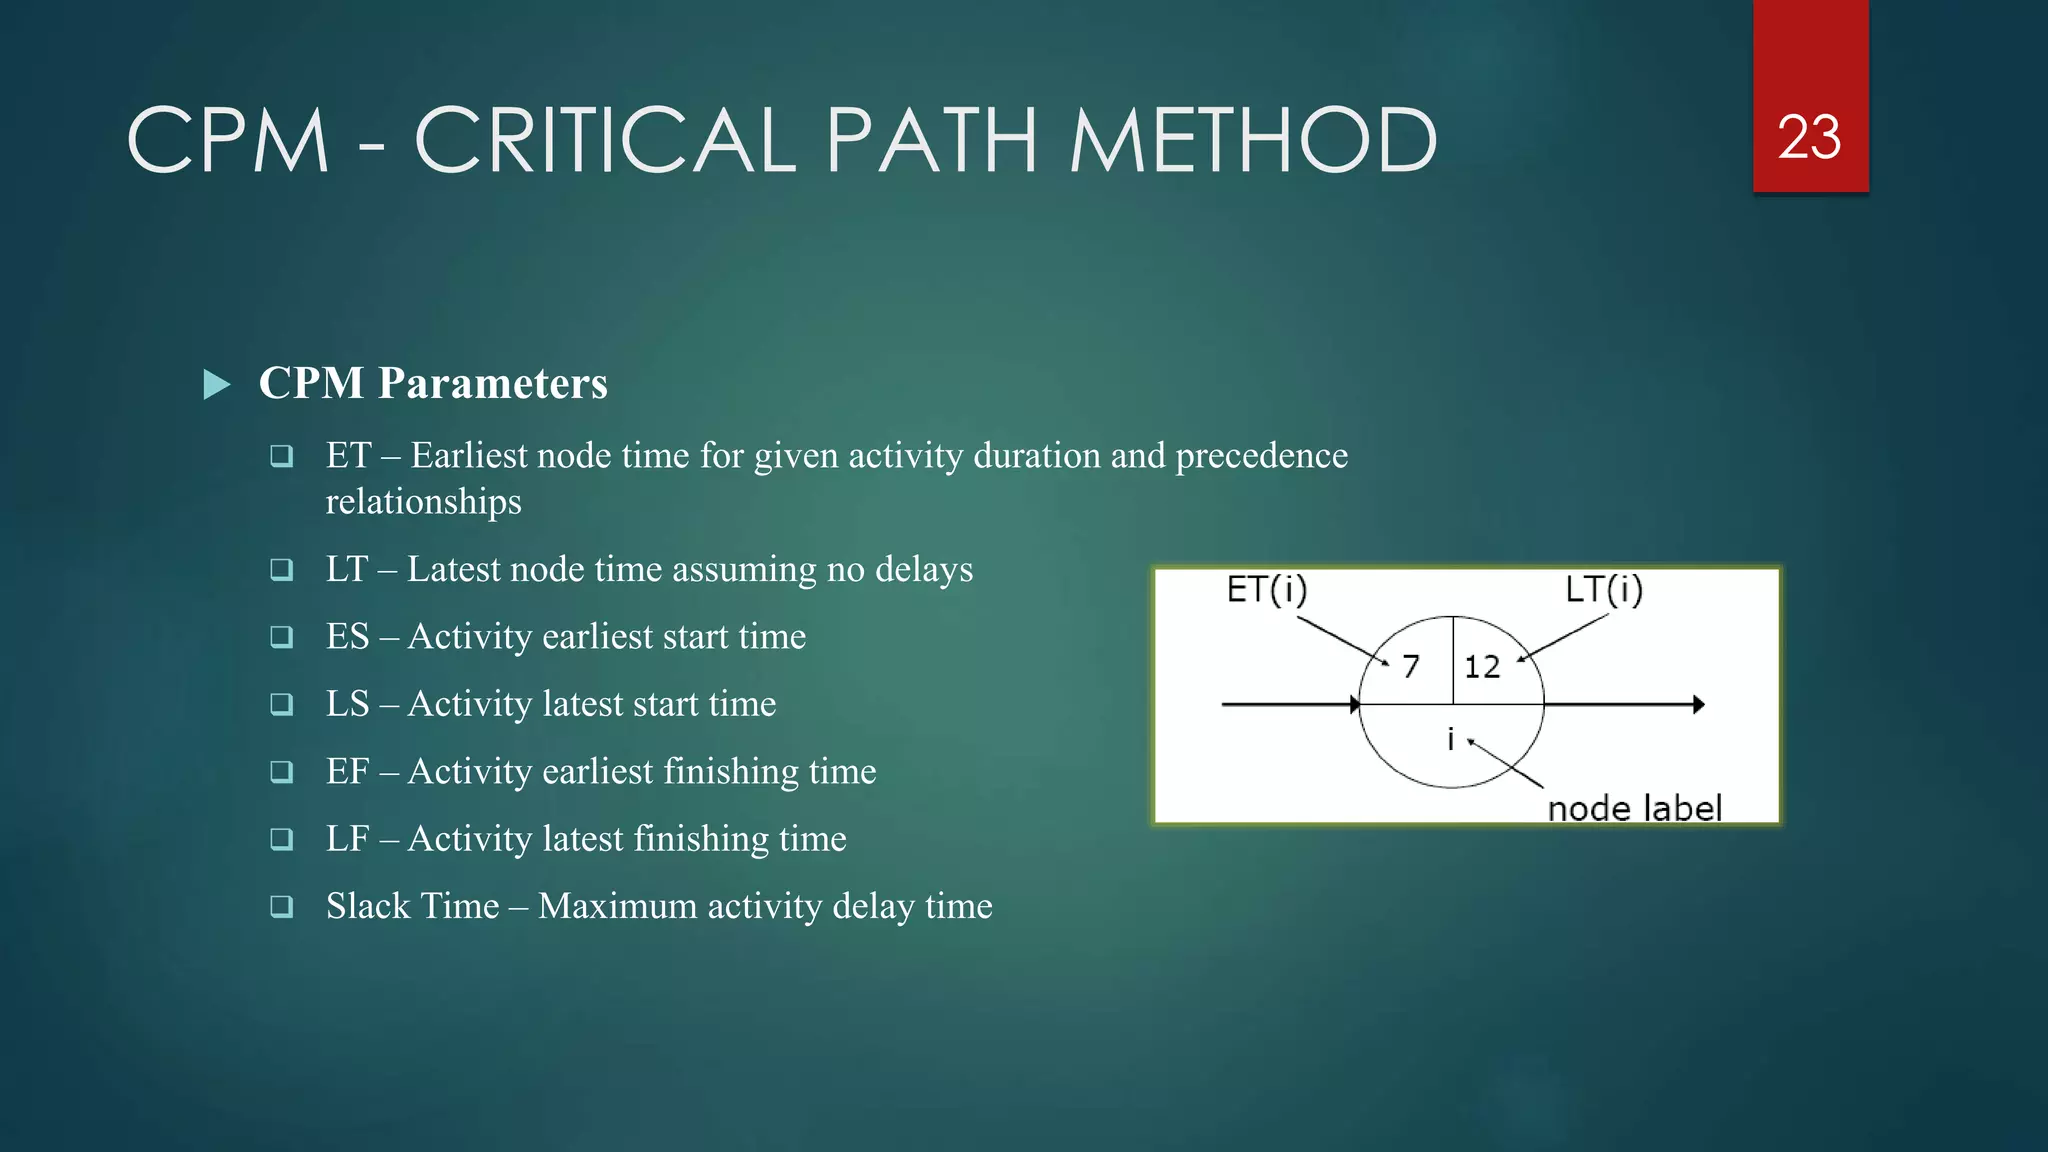
CPM Parameters
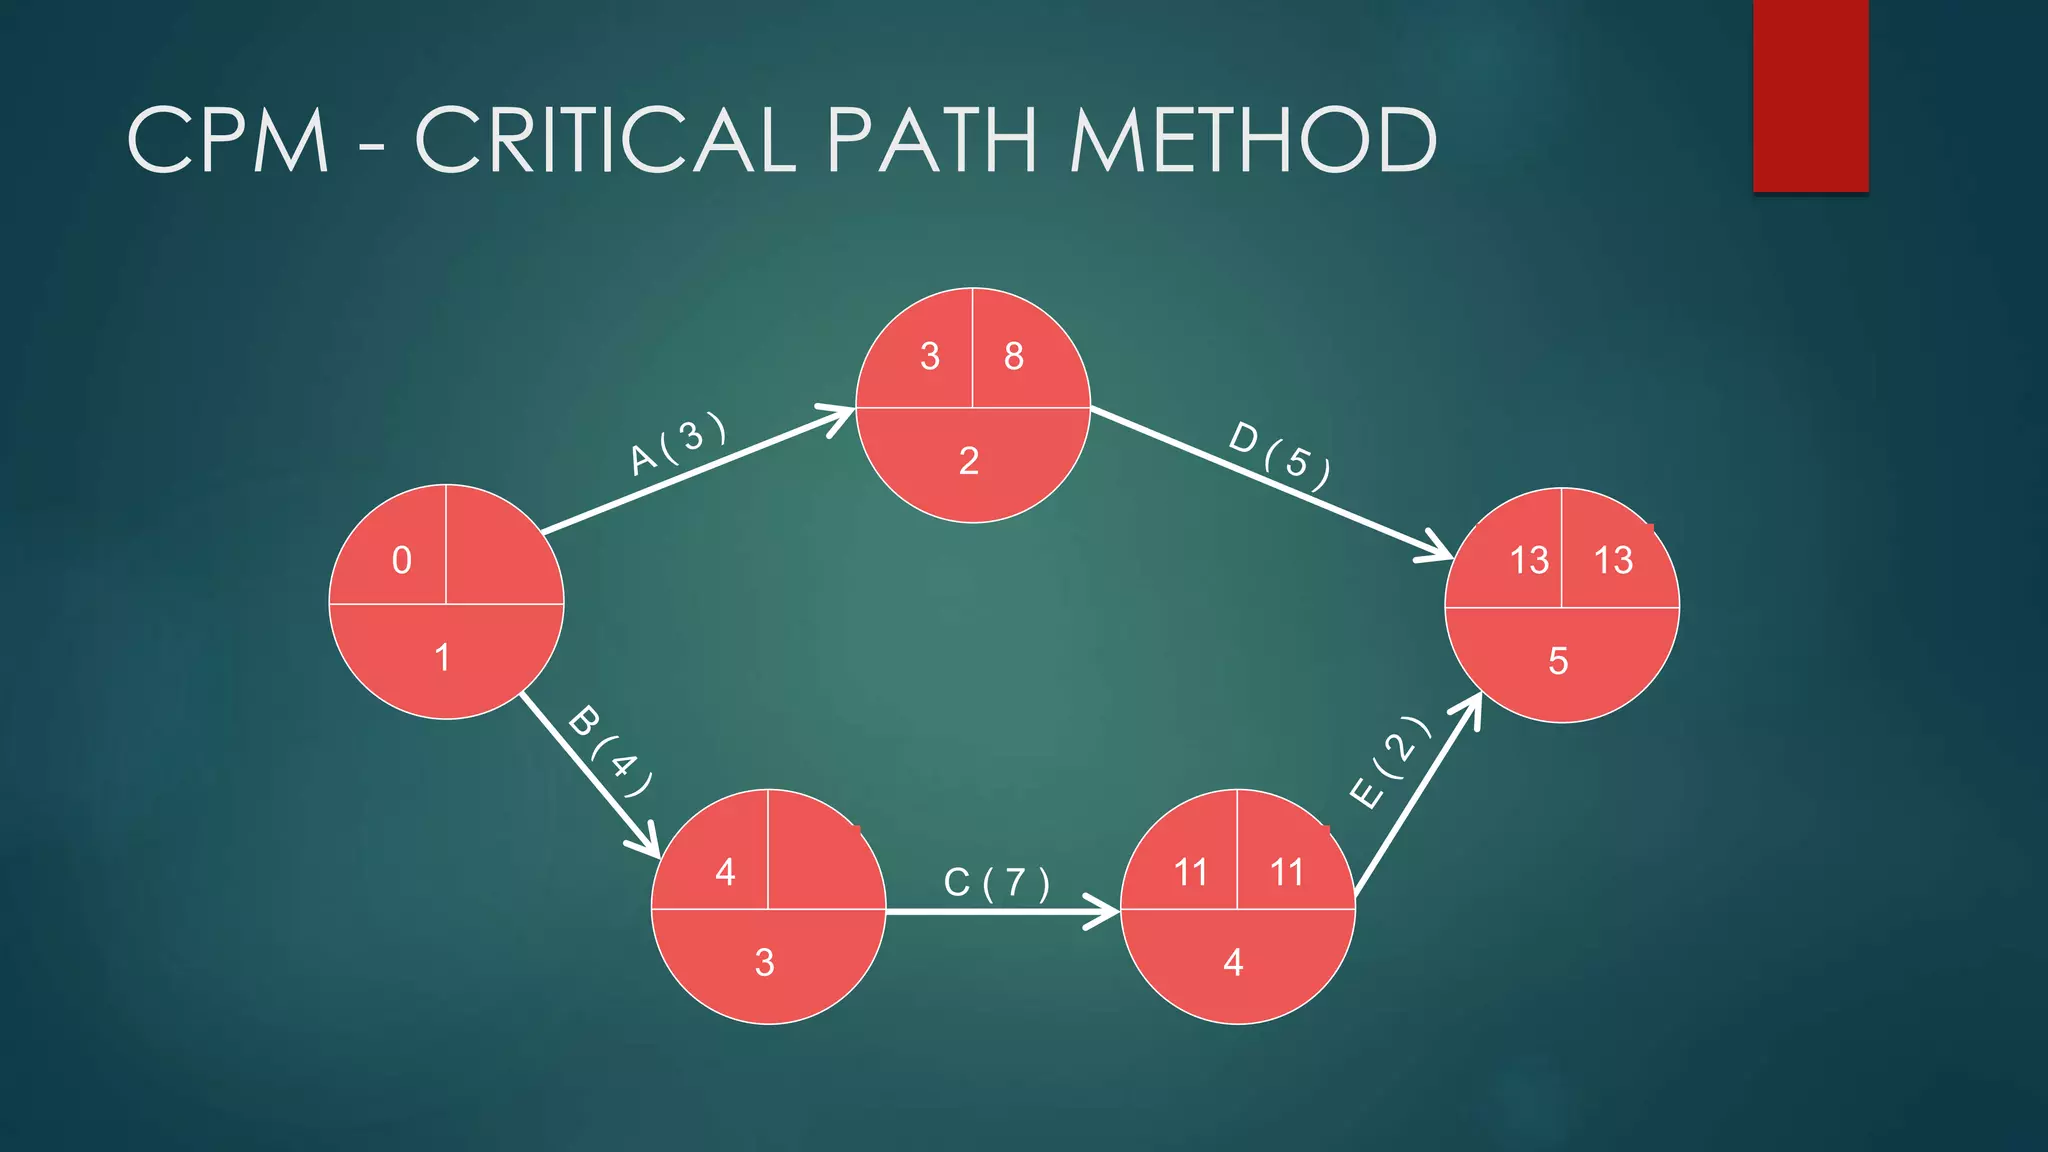
Step 1: Calculate ET for each node
For each node i for which predecessors j are
labelled with ET(j), ET(i) is given by:
ET(i)= maxj [ET(j)+ t(j,i)]
where t(j,i) is the duration of task between
nodes (j,i)
24
Step 2: Calculate LT for each node
For each node i for which successors j are
labelled with LT(j), LT(i) is given by:
LT(i)= minj [LT(j) – t(i,j)]
where t(j,i) is the duration of task between
nodes (i,j)](https://image.slidesharecdn.com/a38ee801-11ba-4271-9080-59da1cc4b3f5-150603113553-lva1-app6892/75/Project-Management-Fundamental-24-2048.jpg)


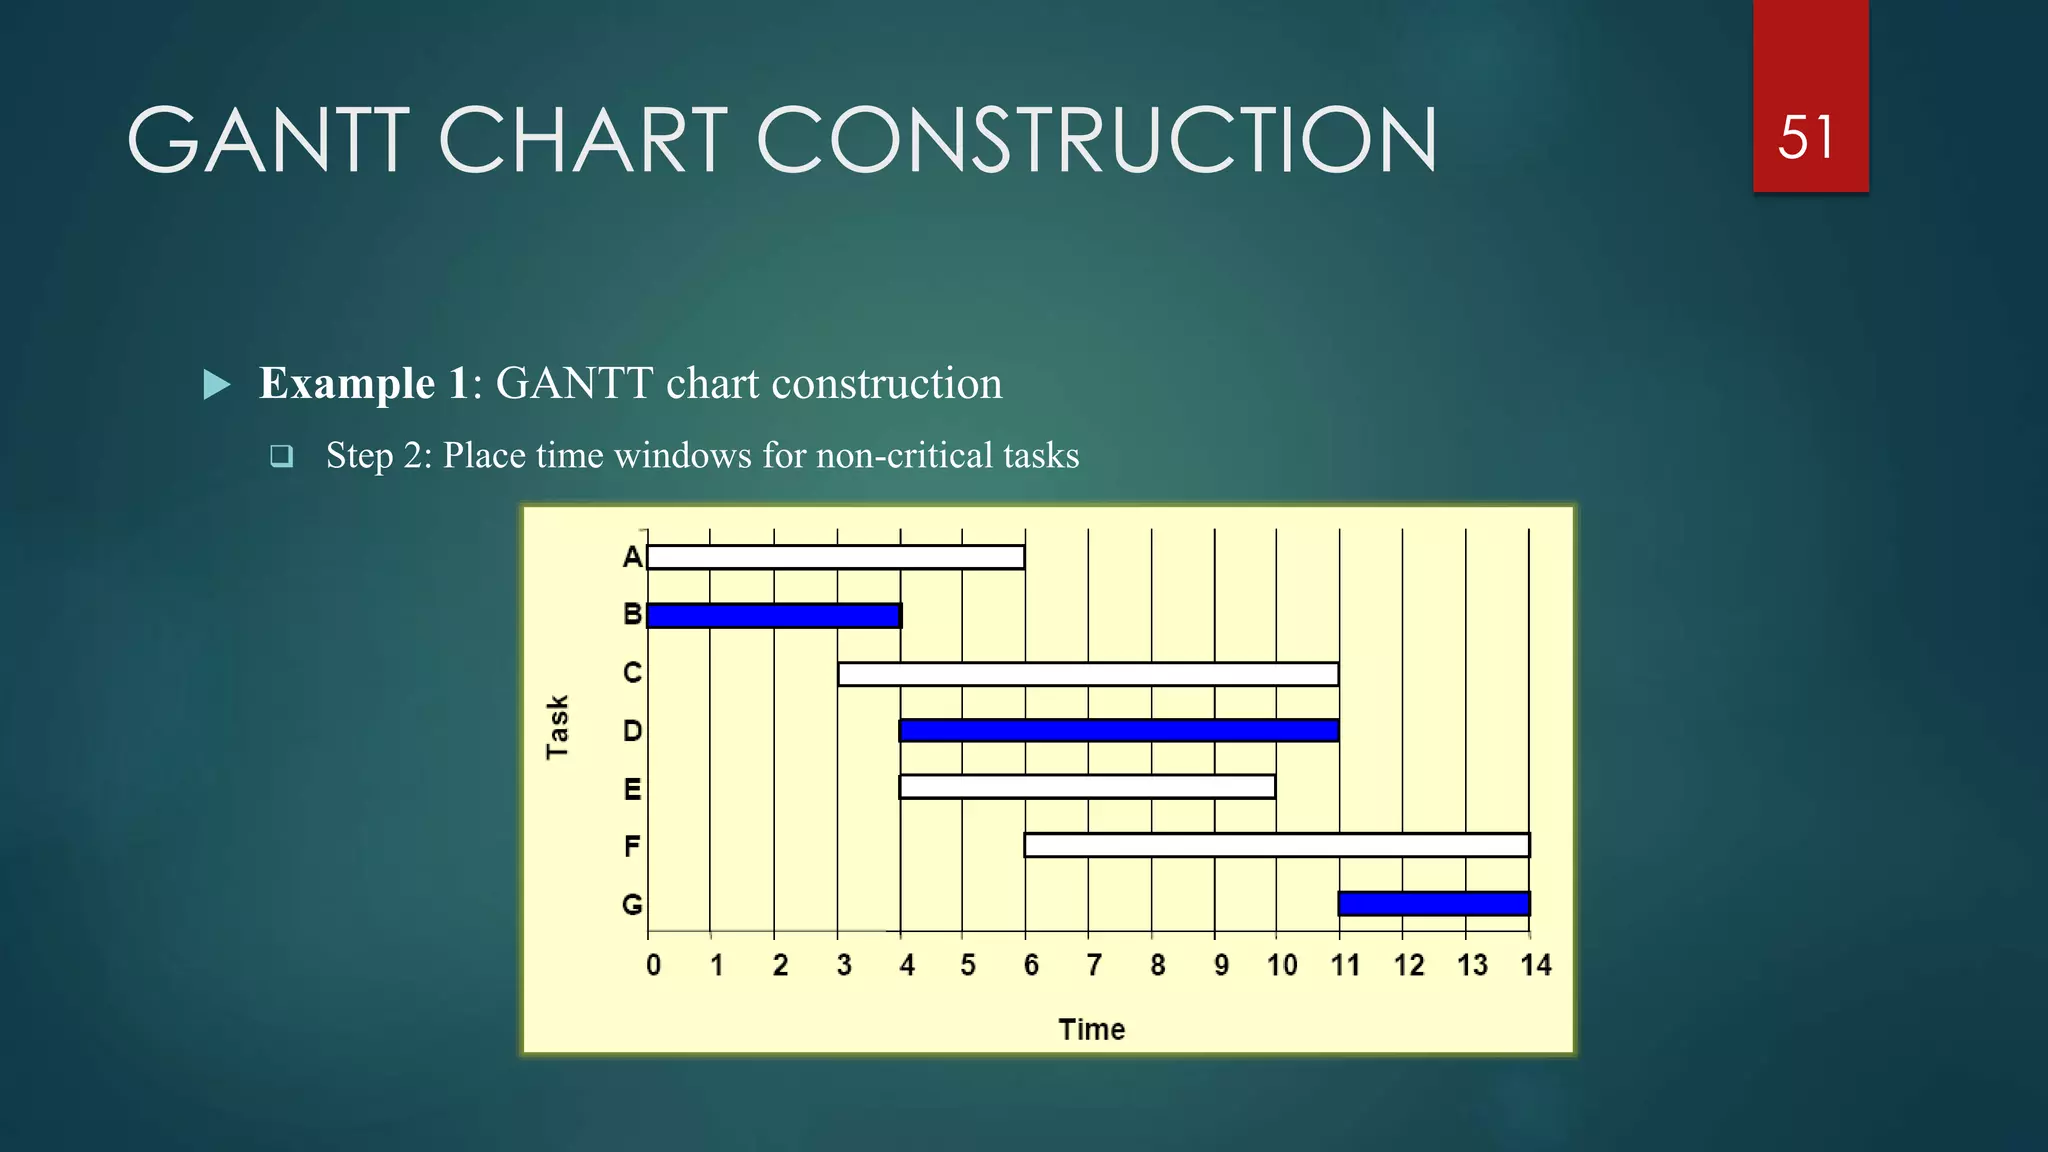
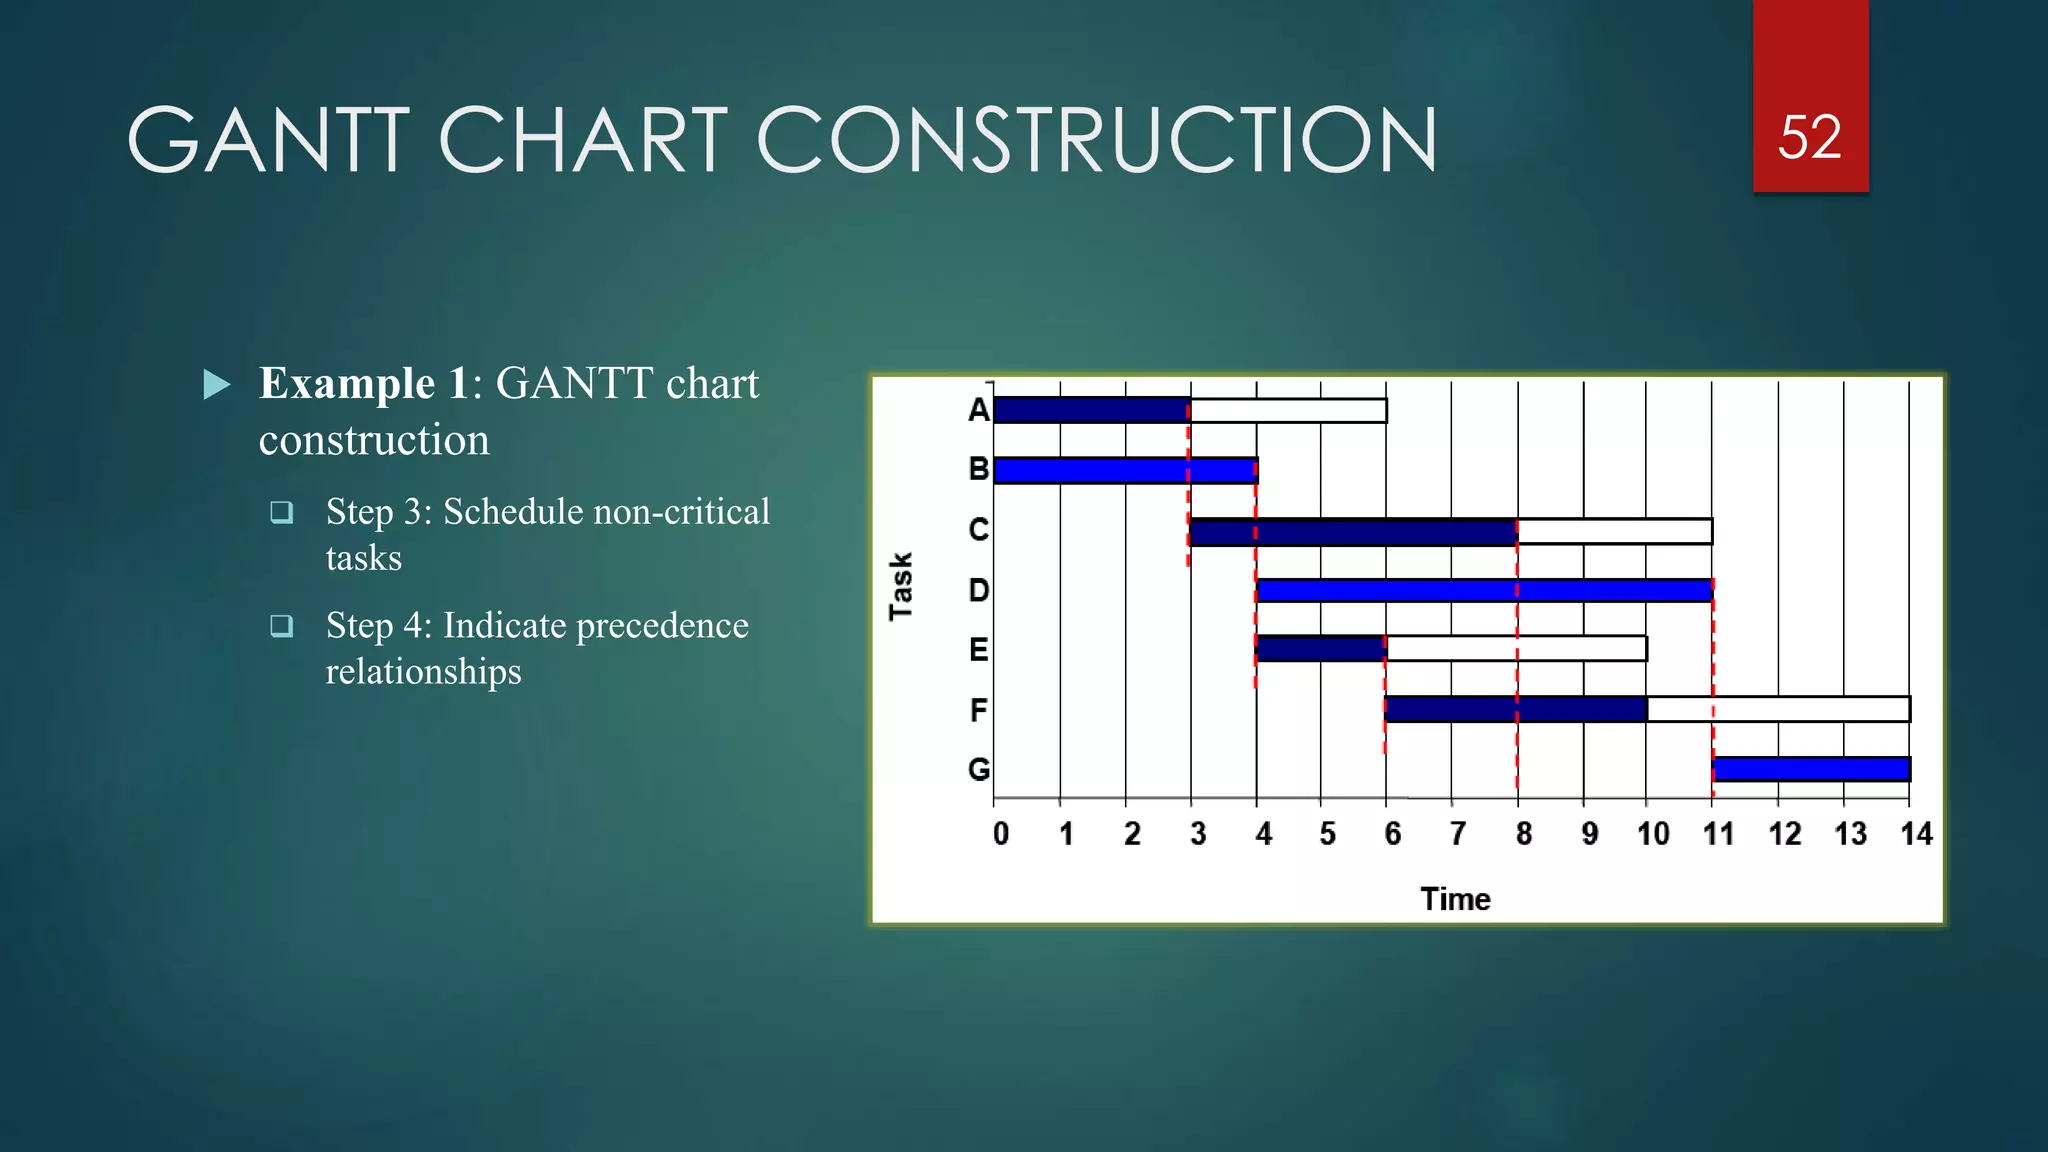


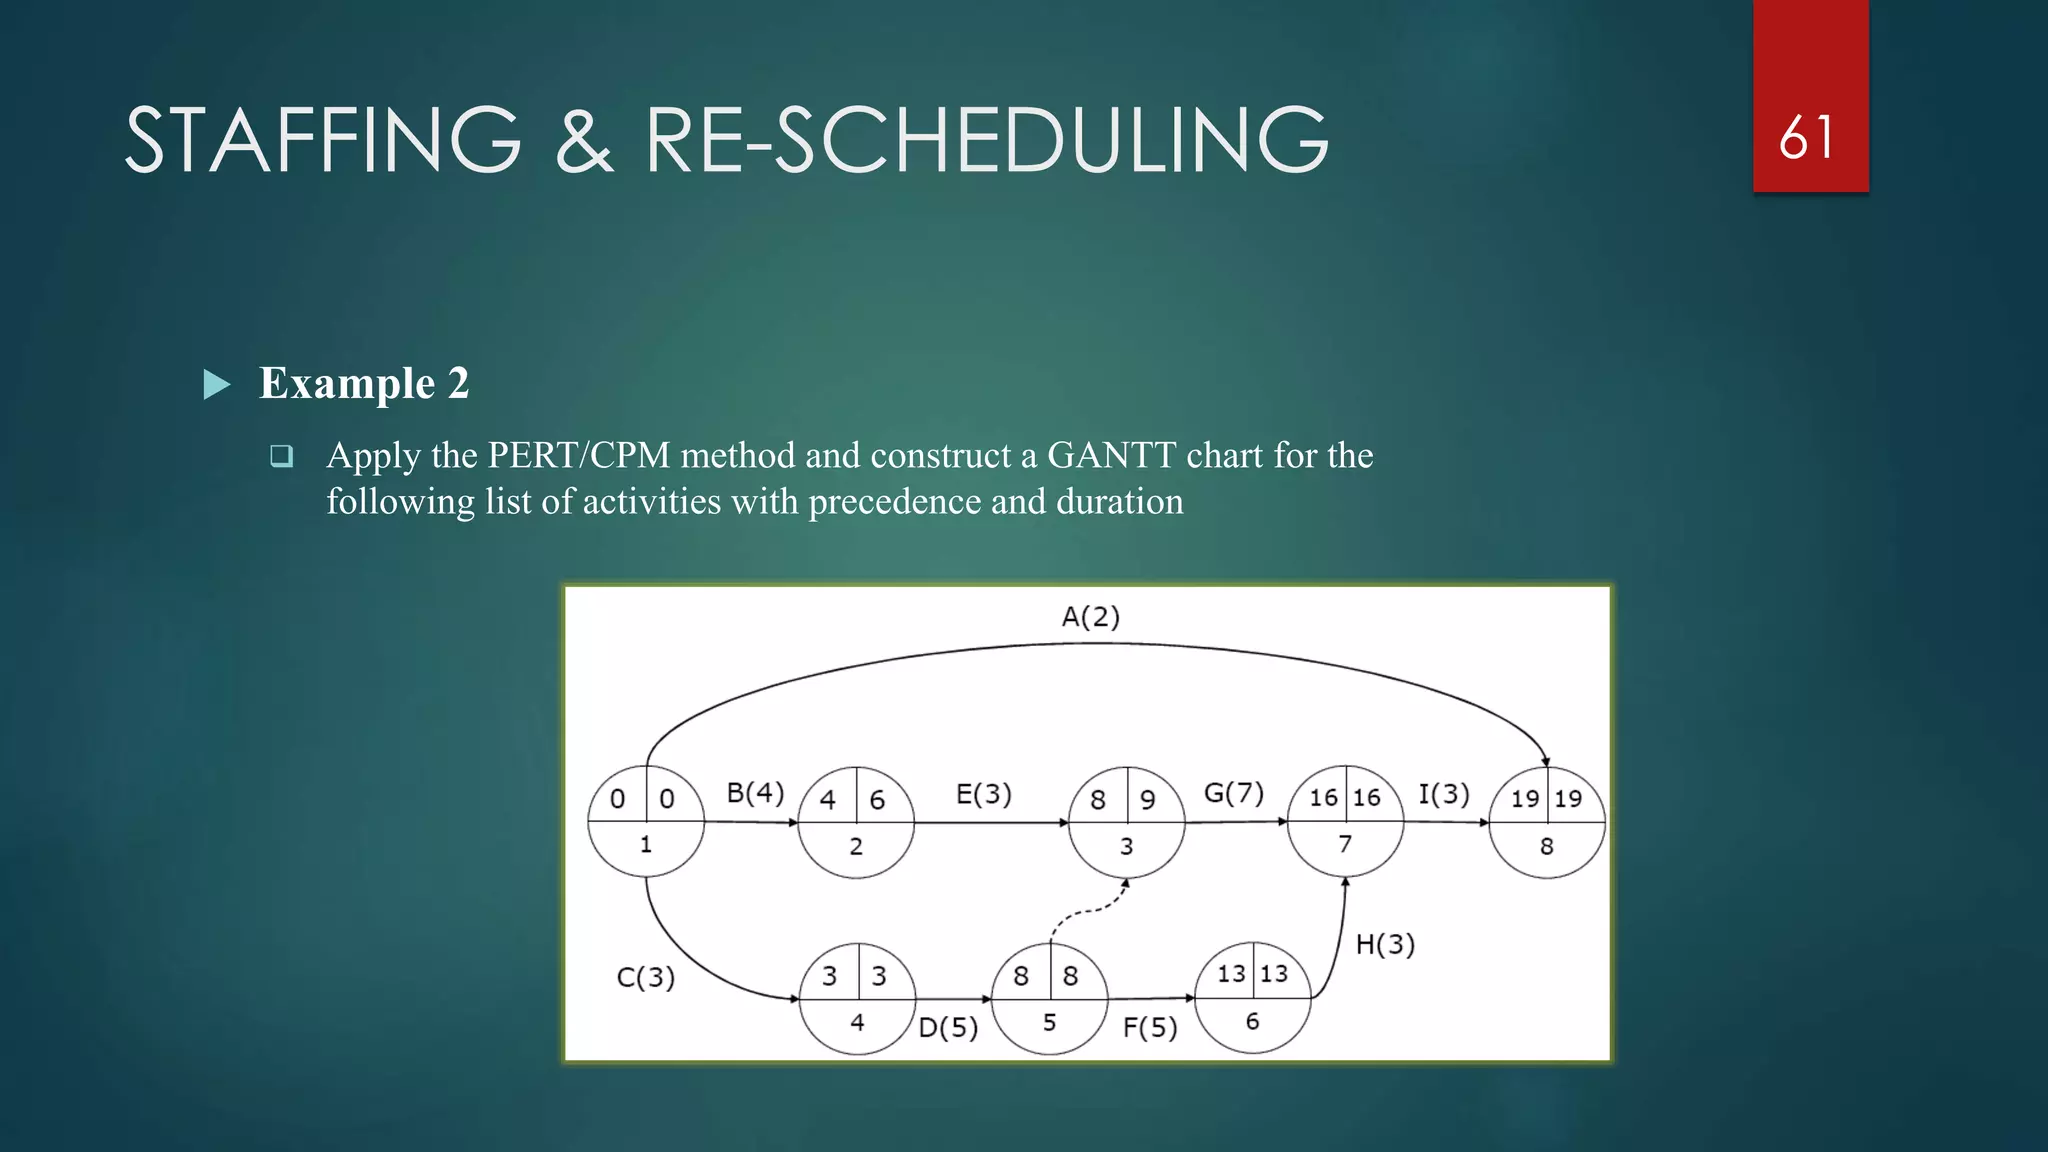


The document discusses various topics related to project management fundamentals including project cash flow, time value of money, project selection criteria, project scheduling, critical path method (CPM), Gantt charts, and staffing & rescheduling. It provides definitions and explanations of key concepts such as cost types, discount rates, numeric and non-numeric selection models, precedence relationships, critical paths, slack times, and resource smoothing. Examples are given to illustrate how to construct Gantt charts from CPM/PERT analysis and optimize schedules through staff reallocation.