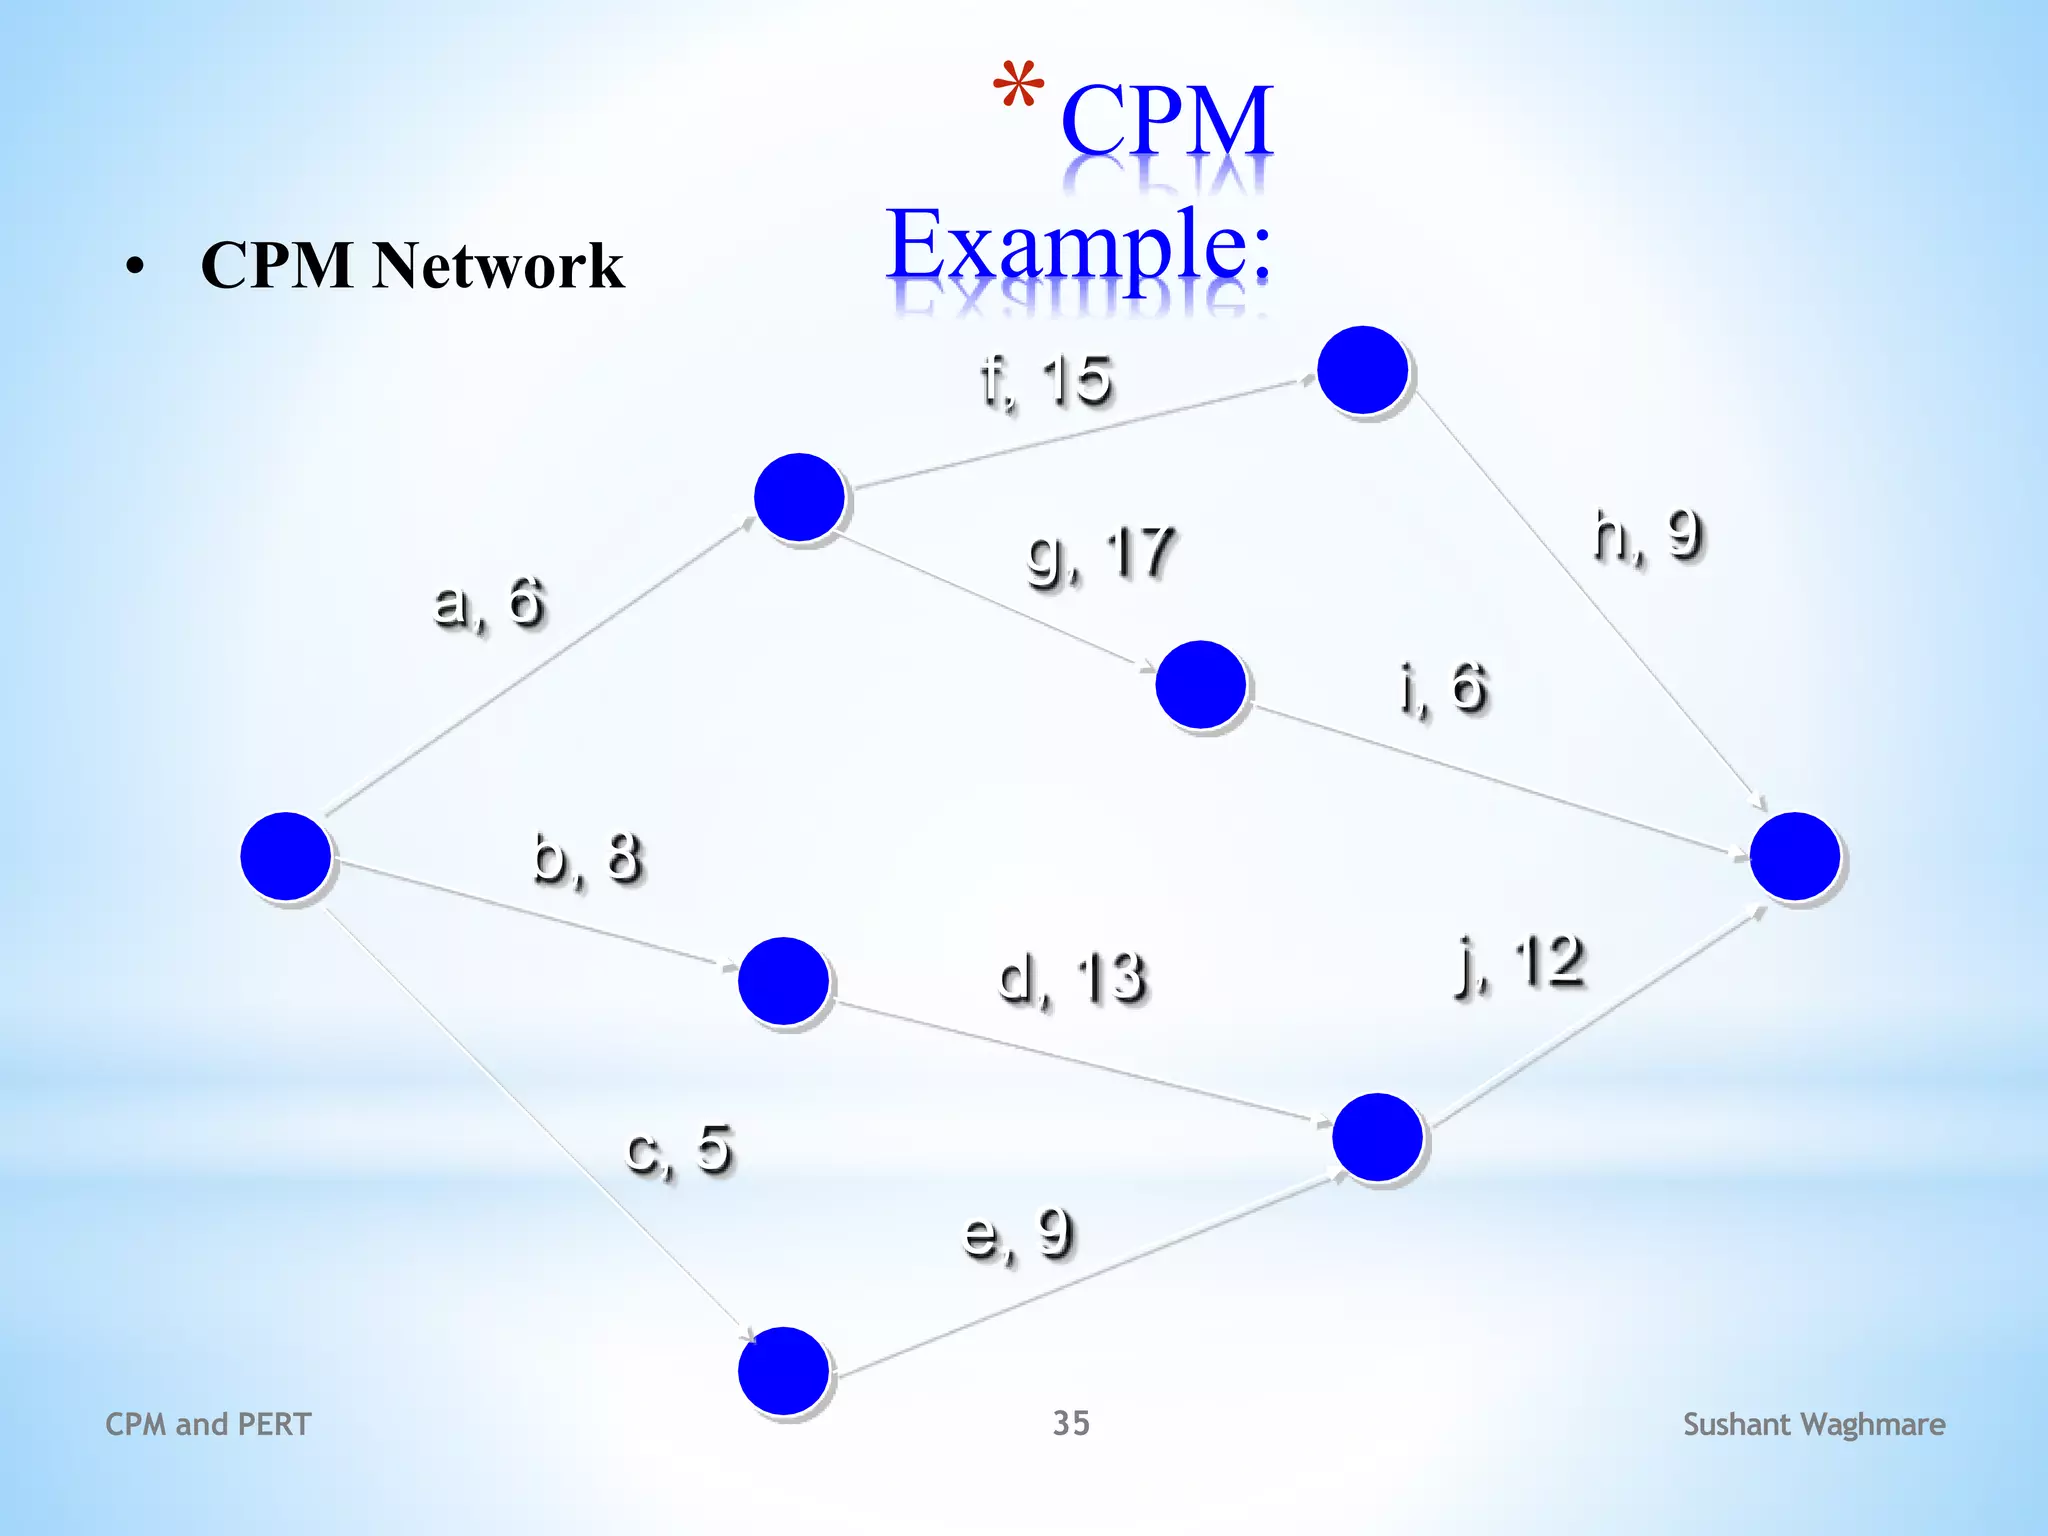
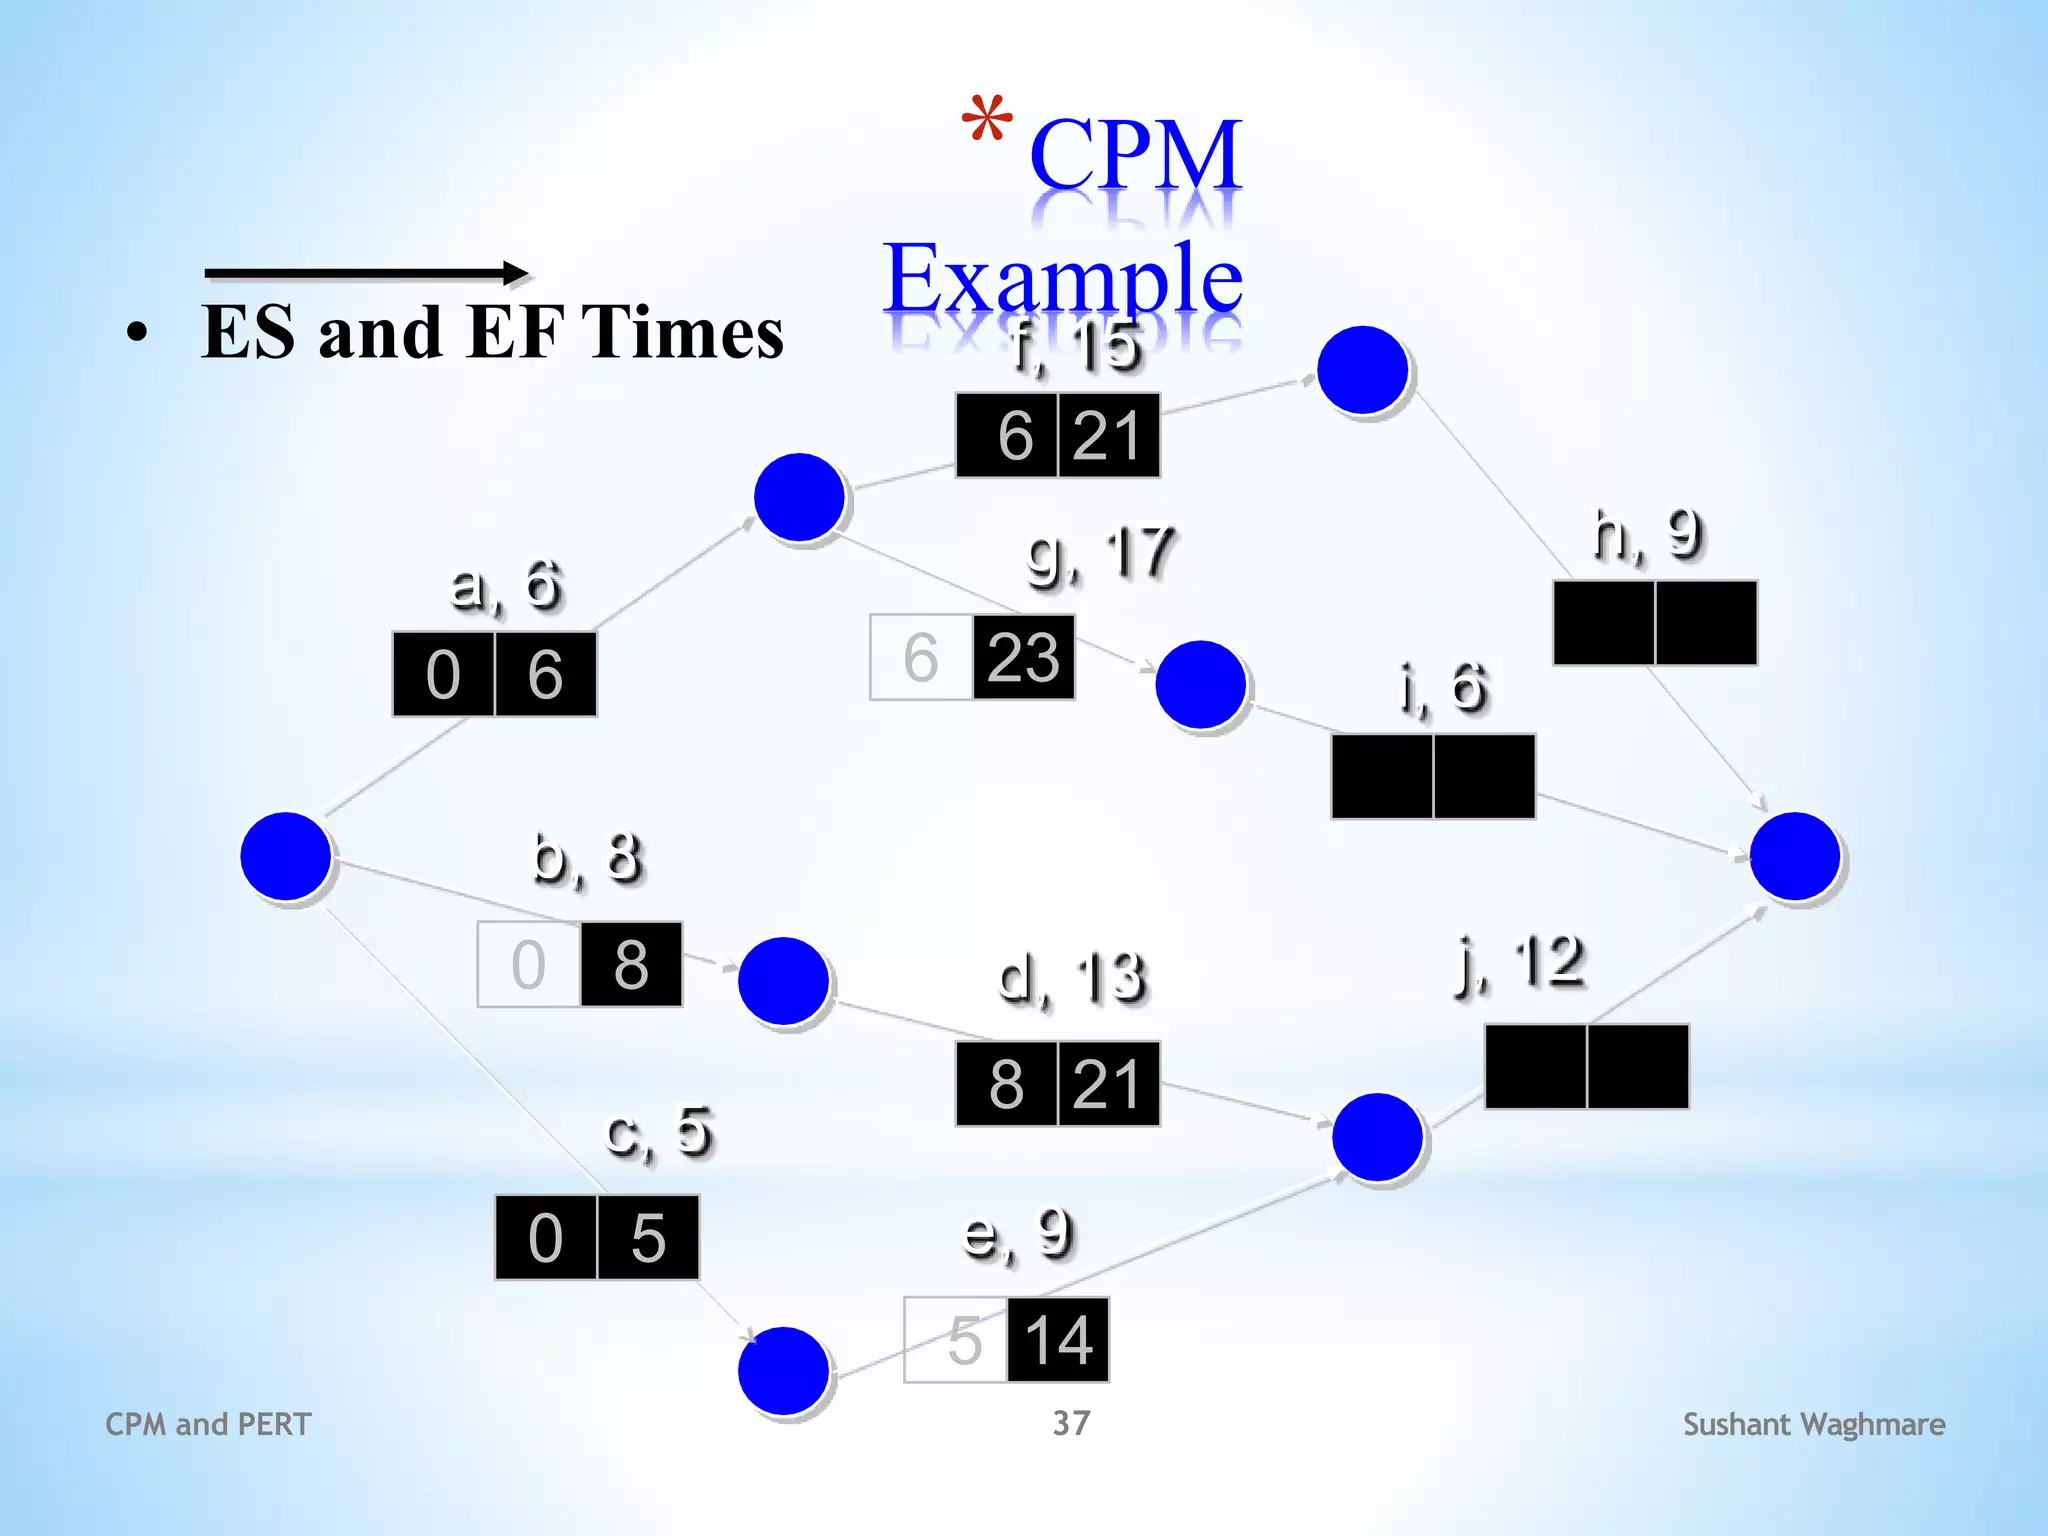
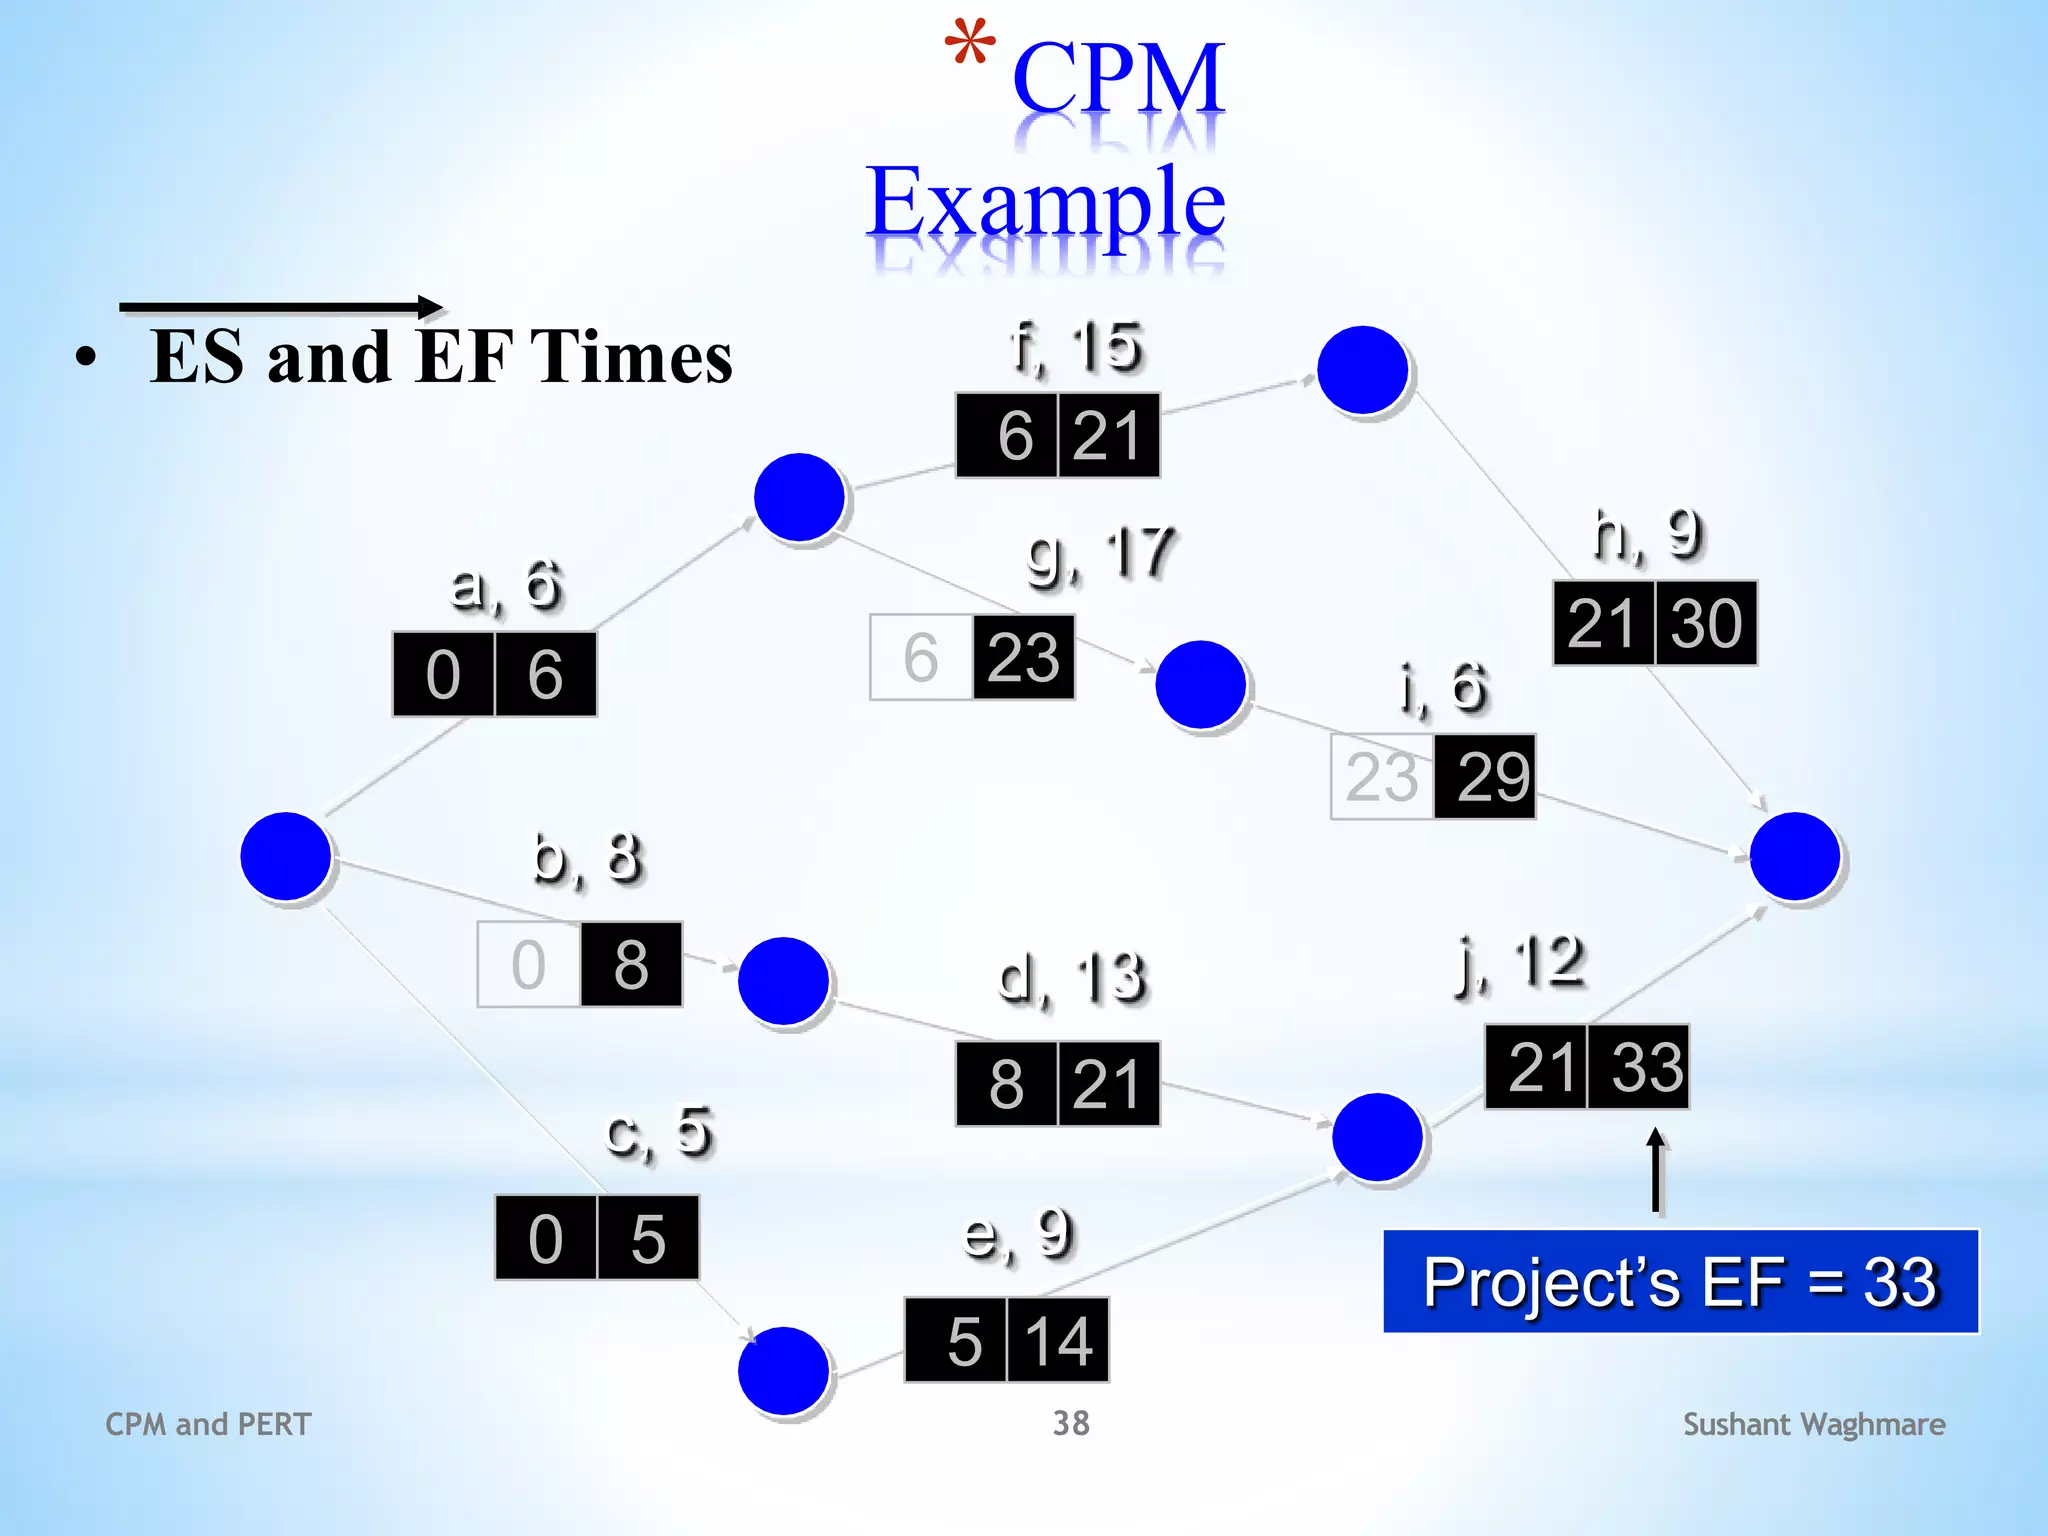
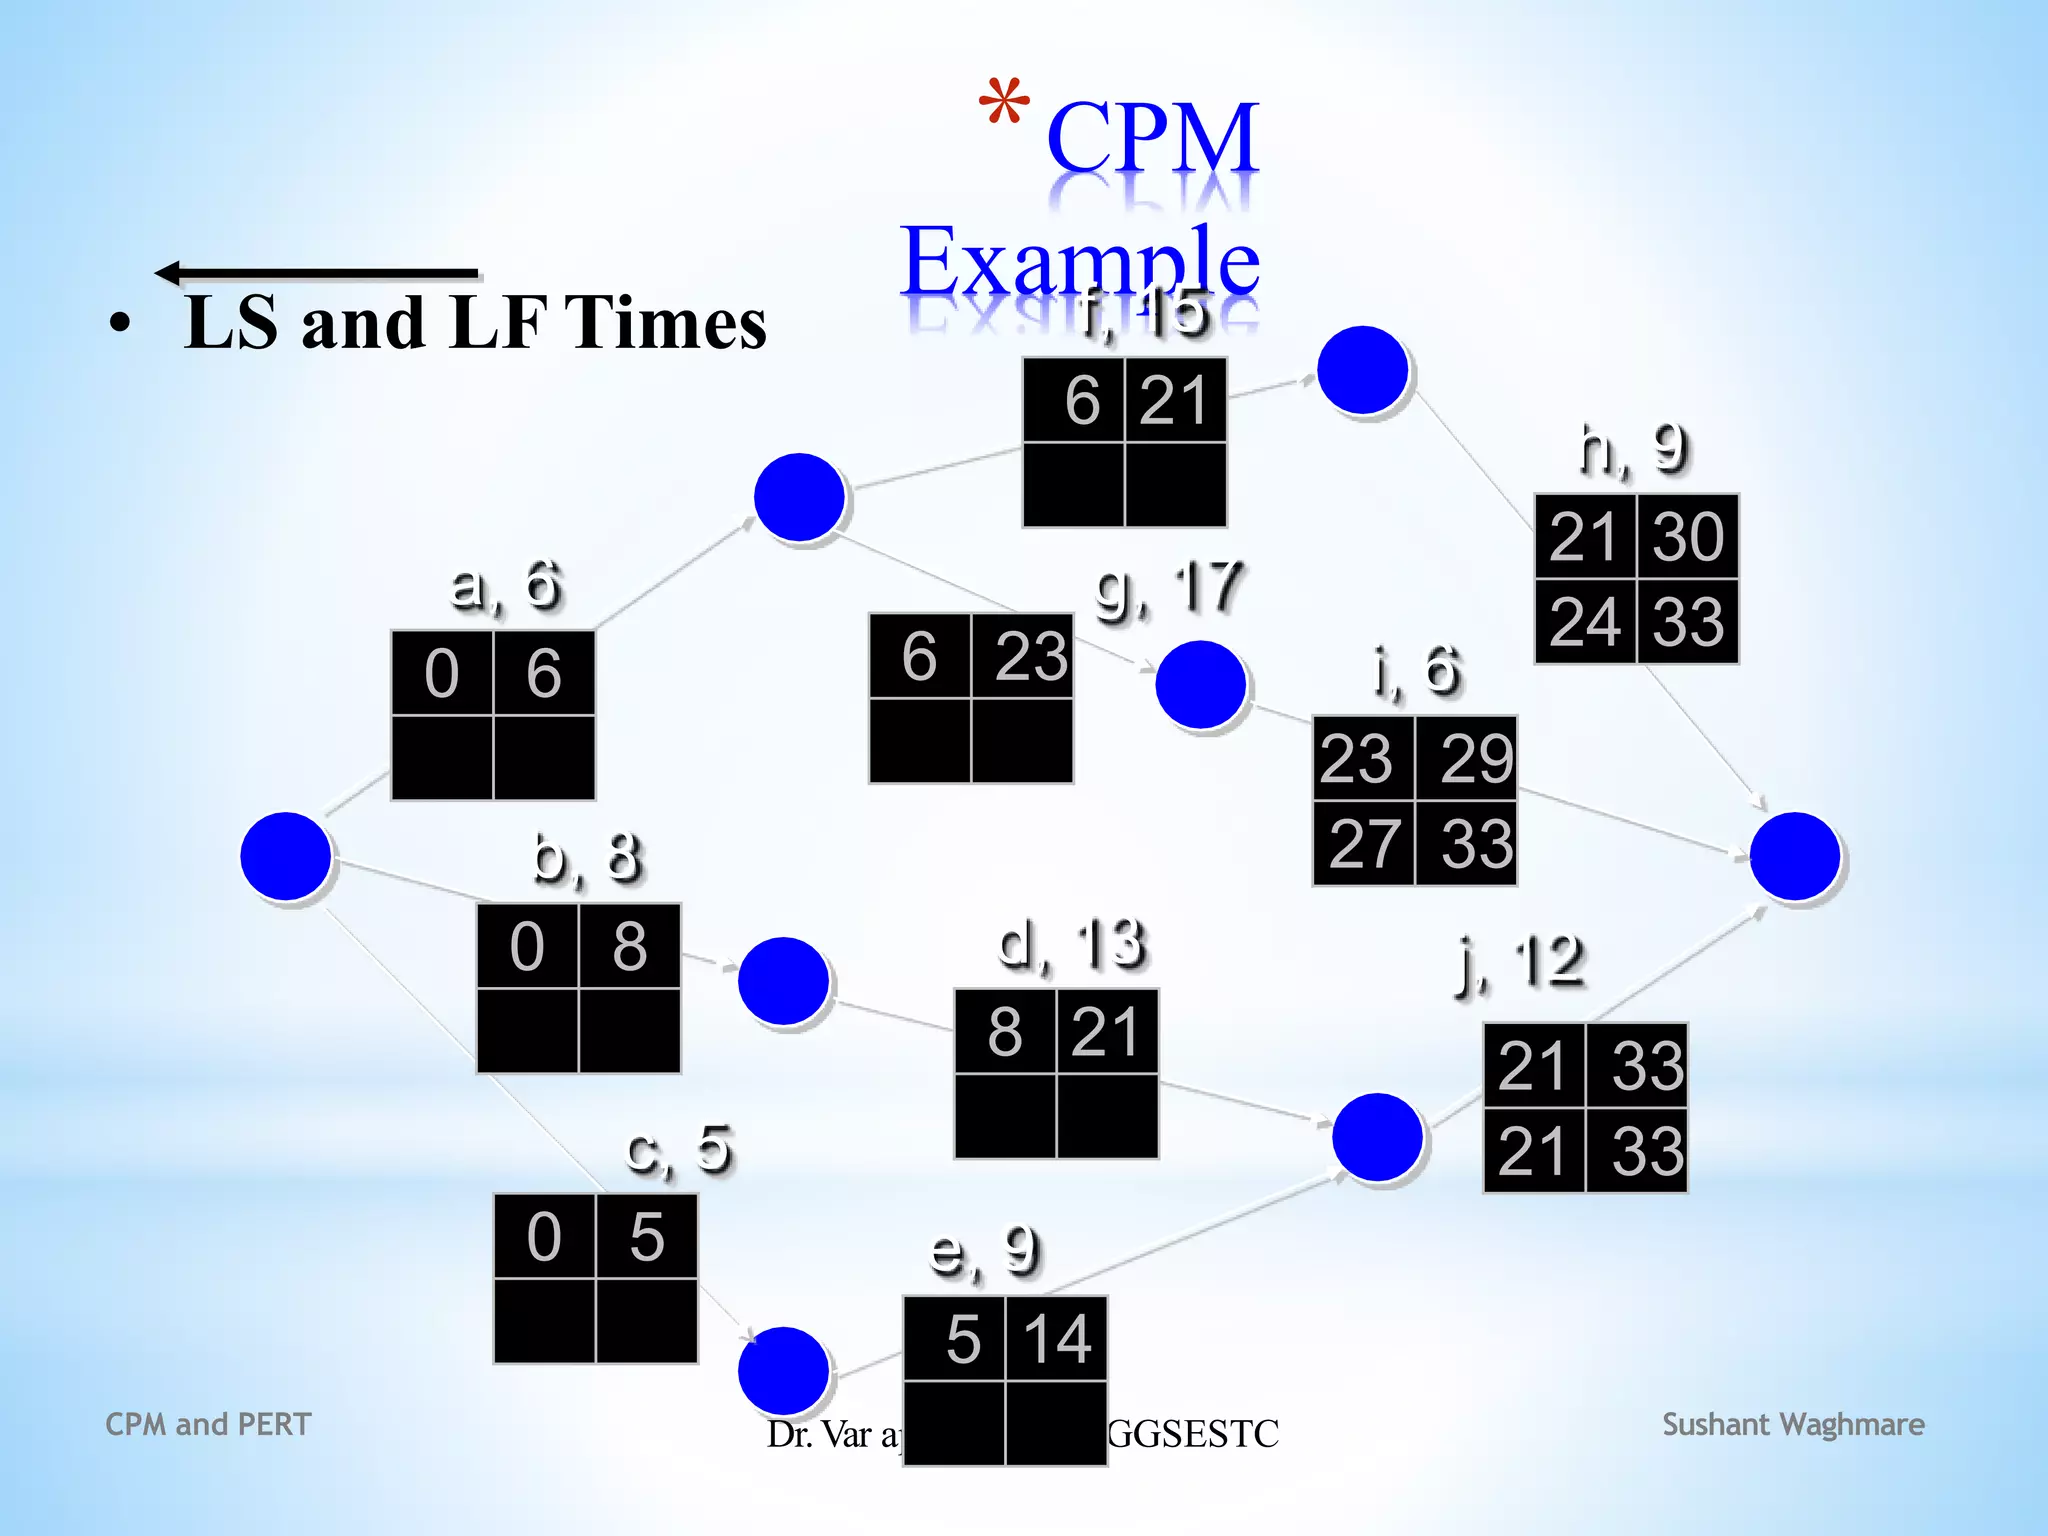
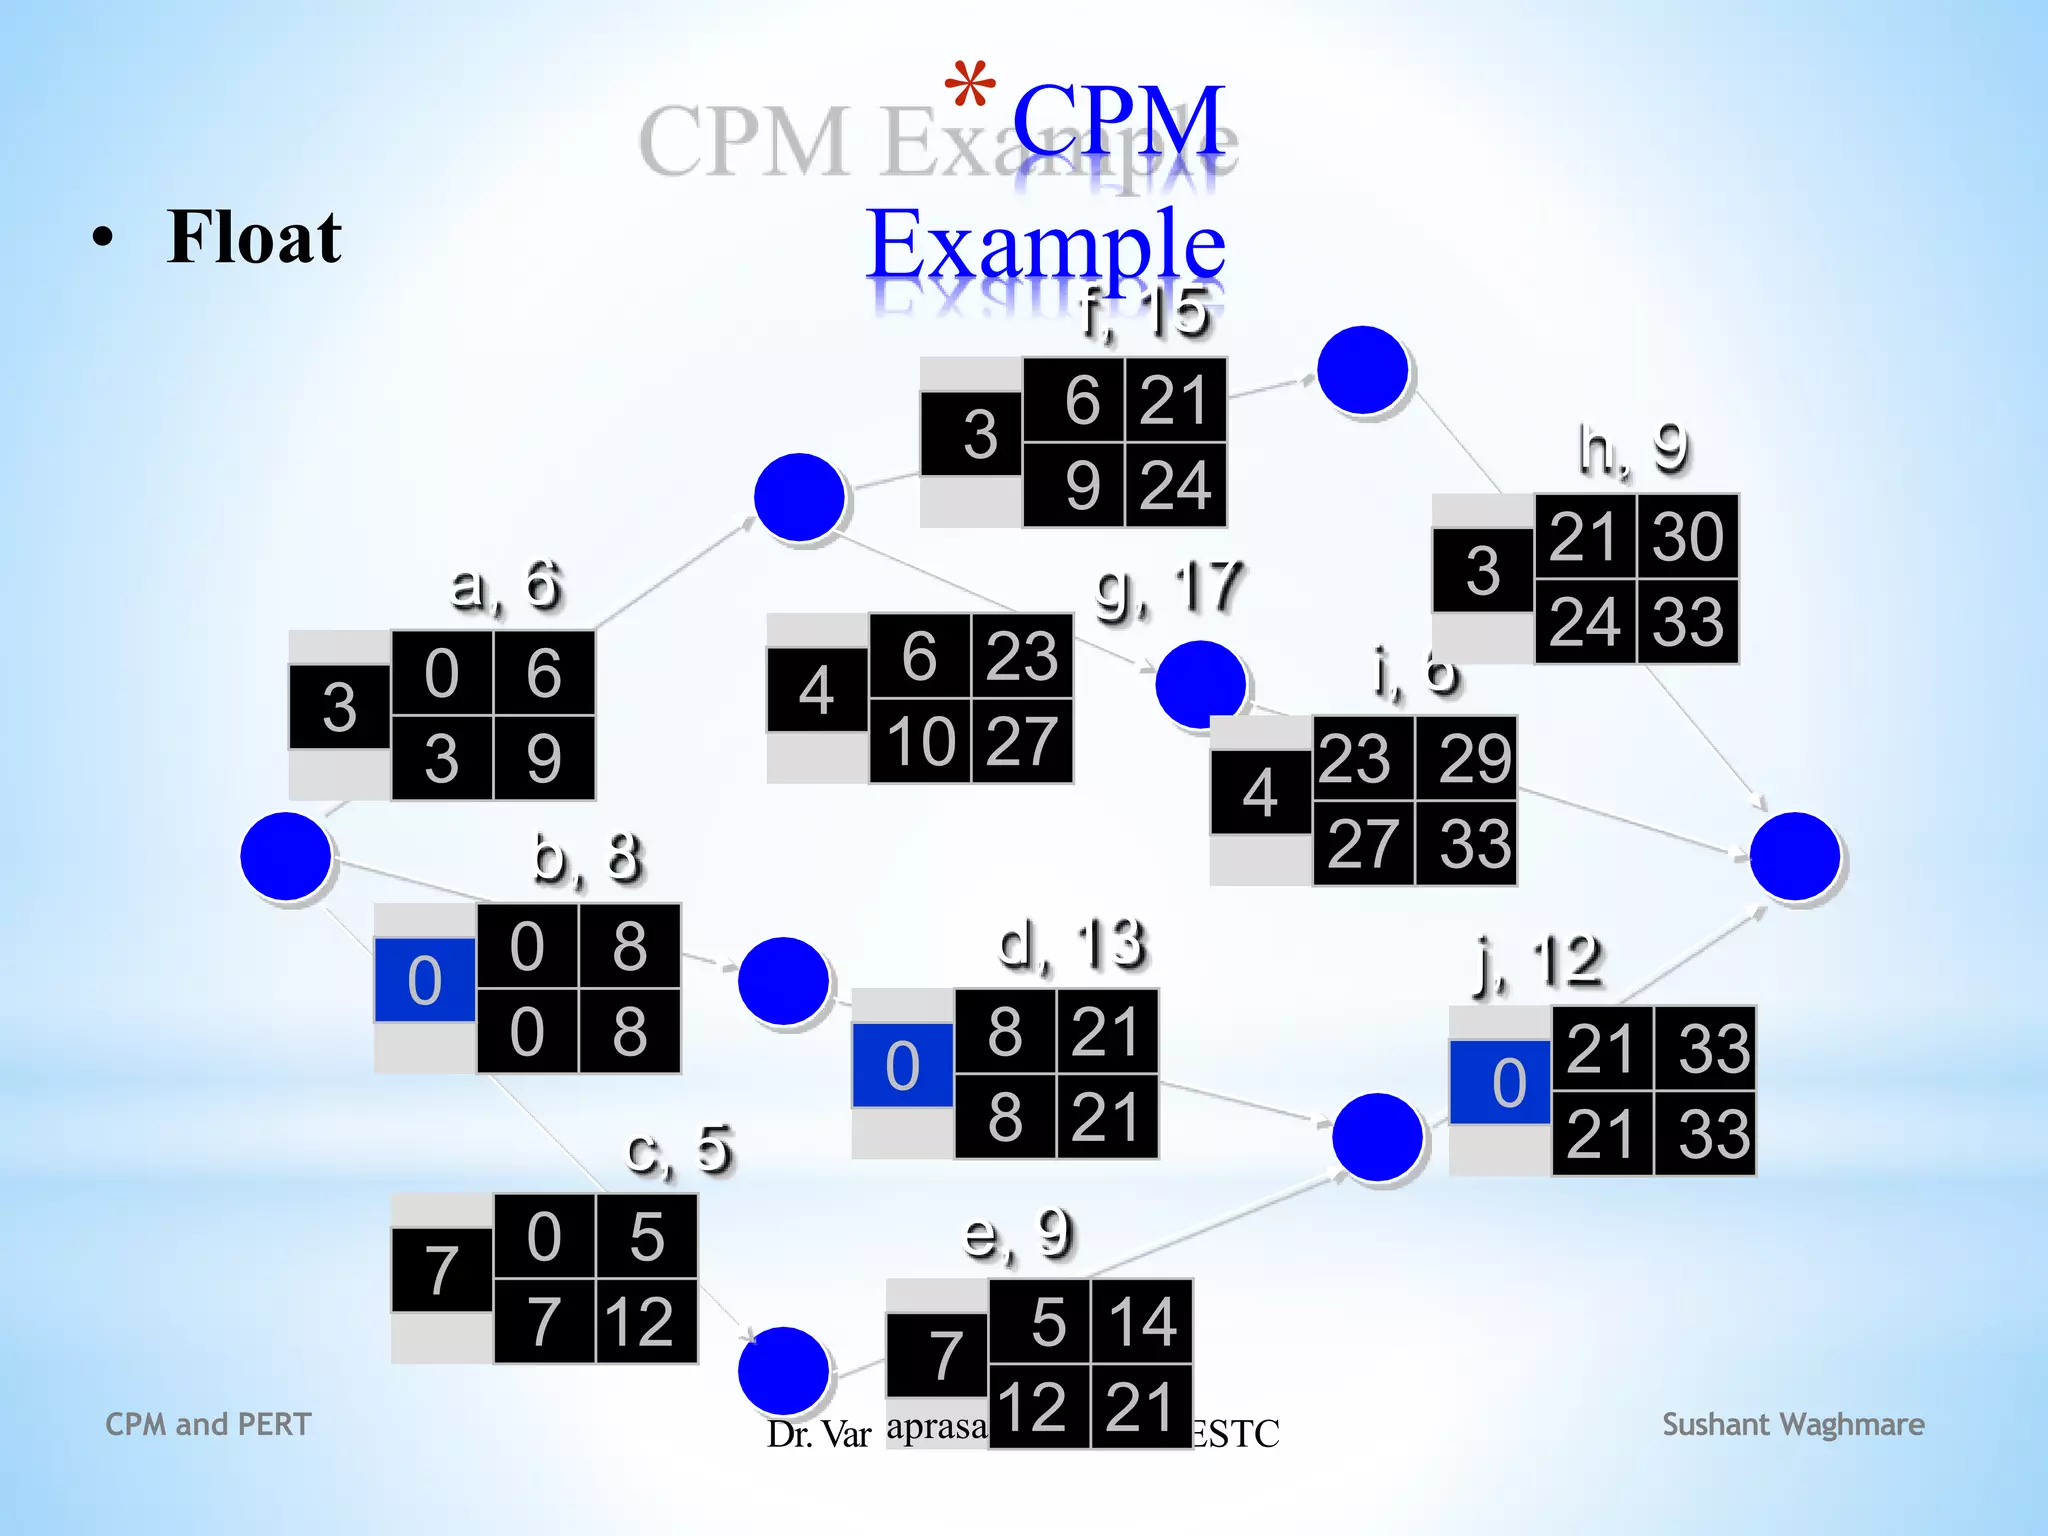
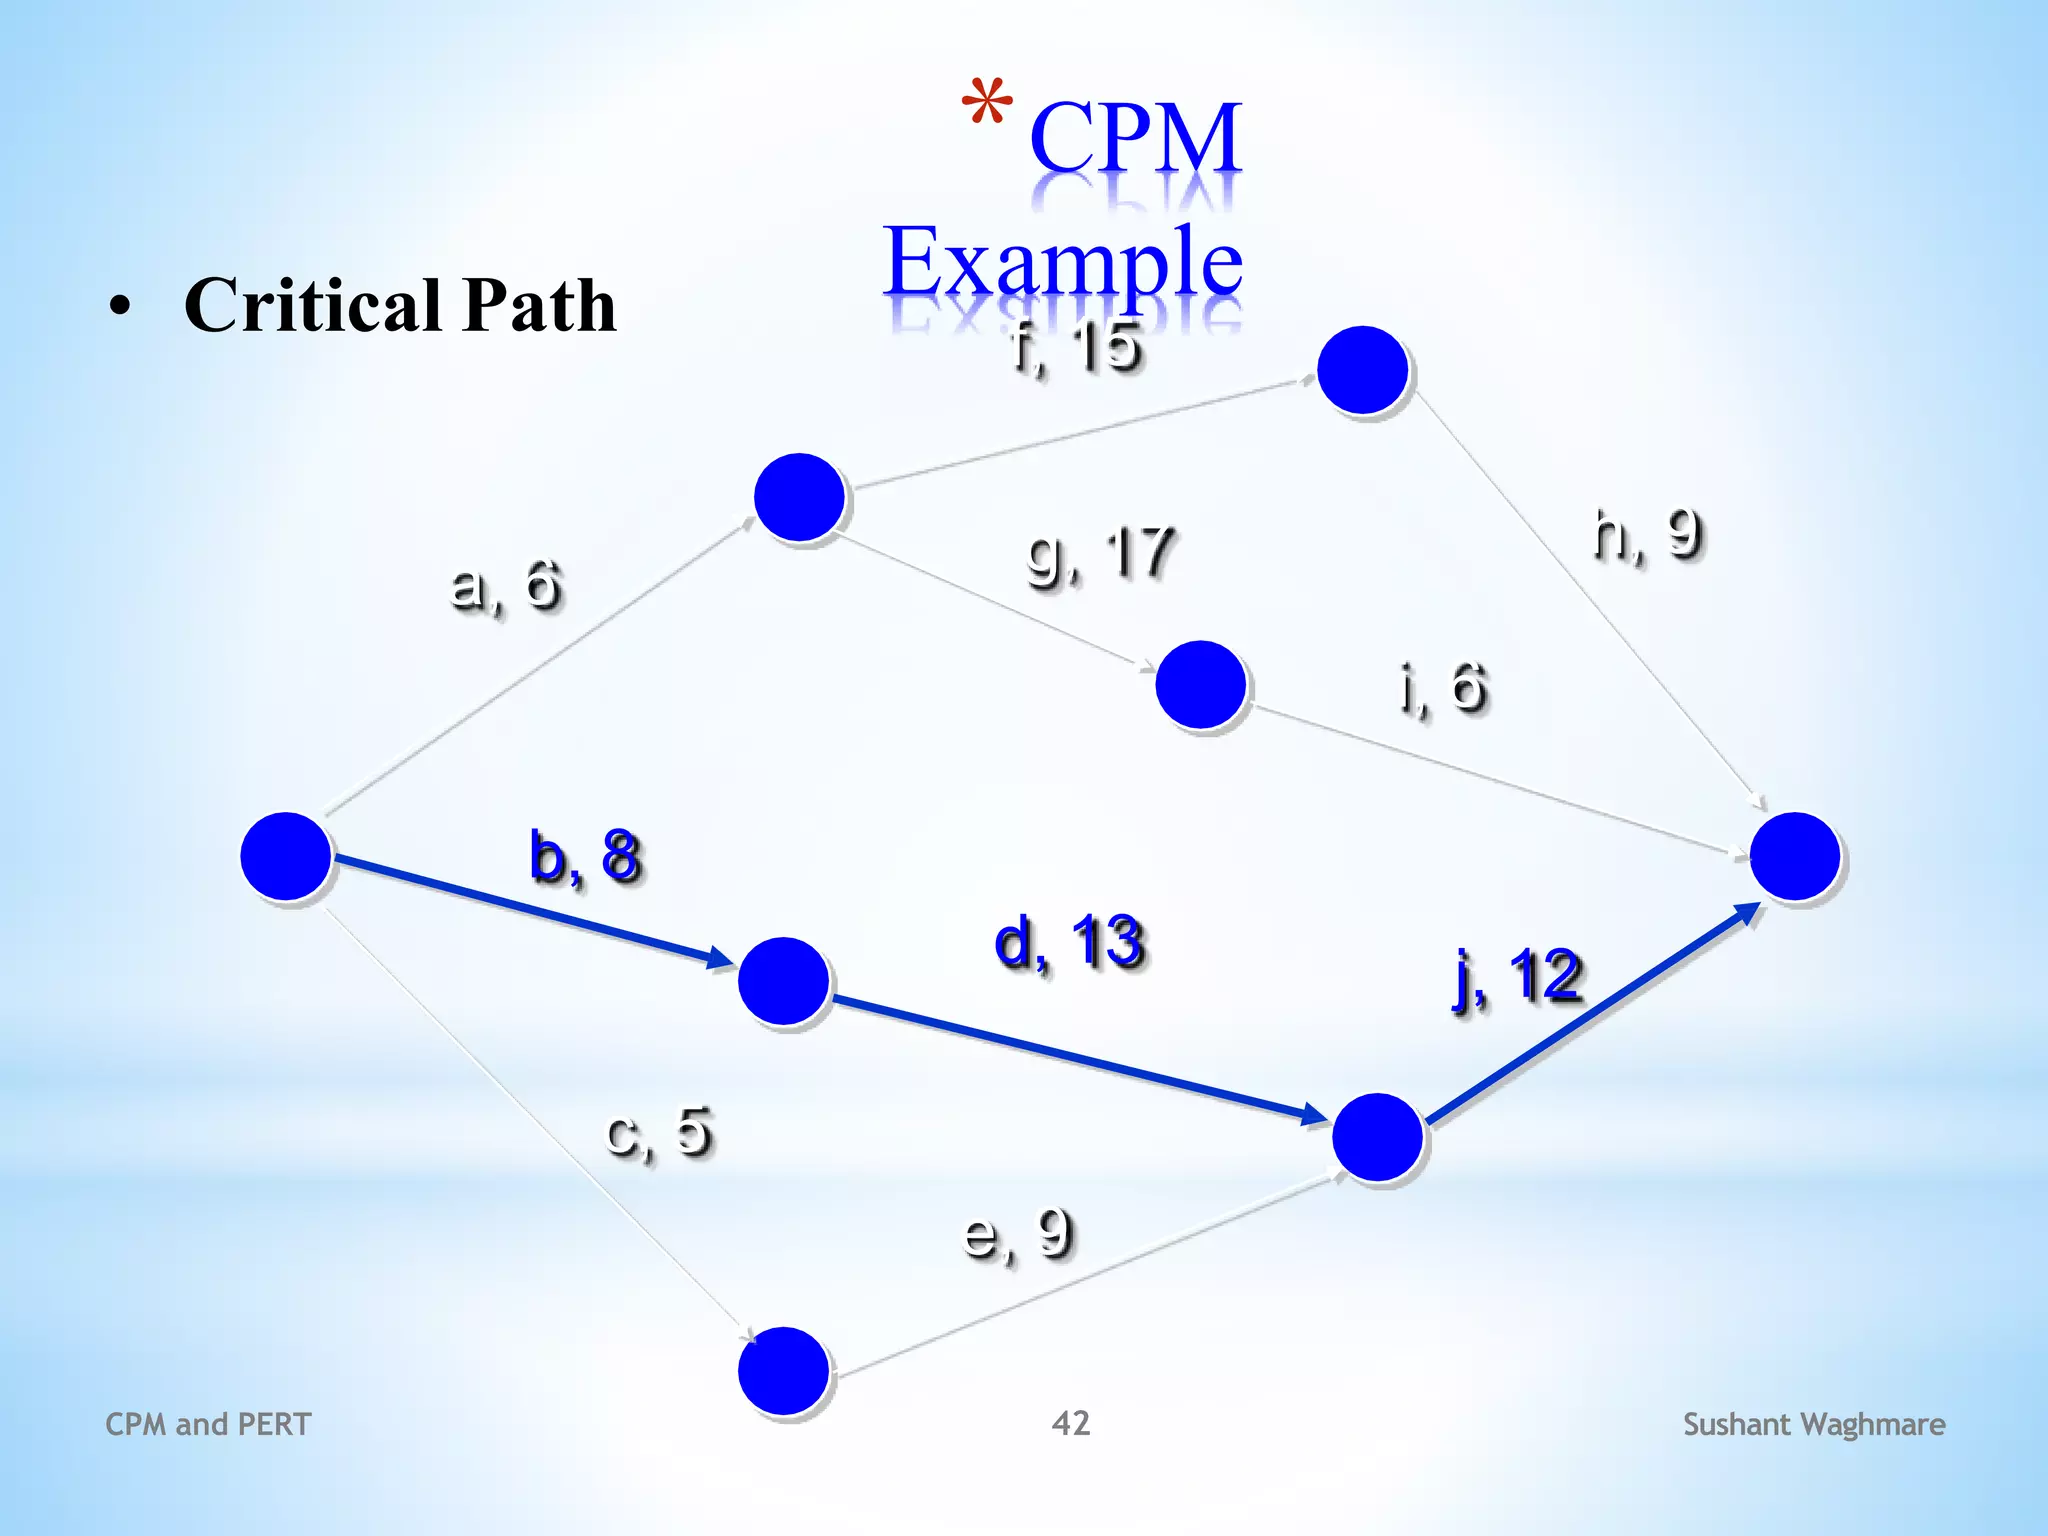
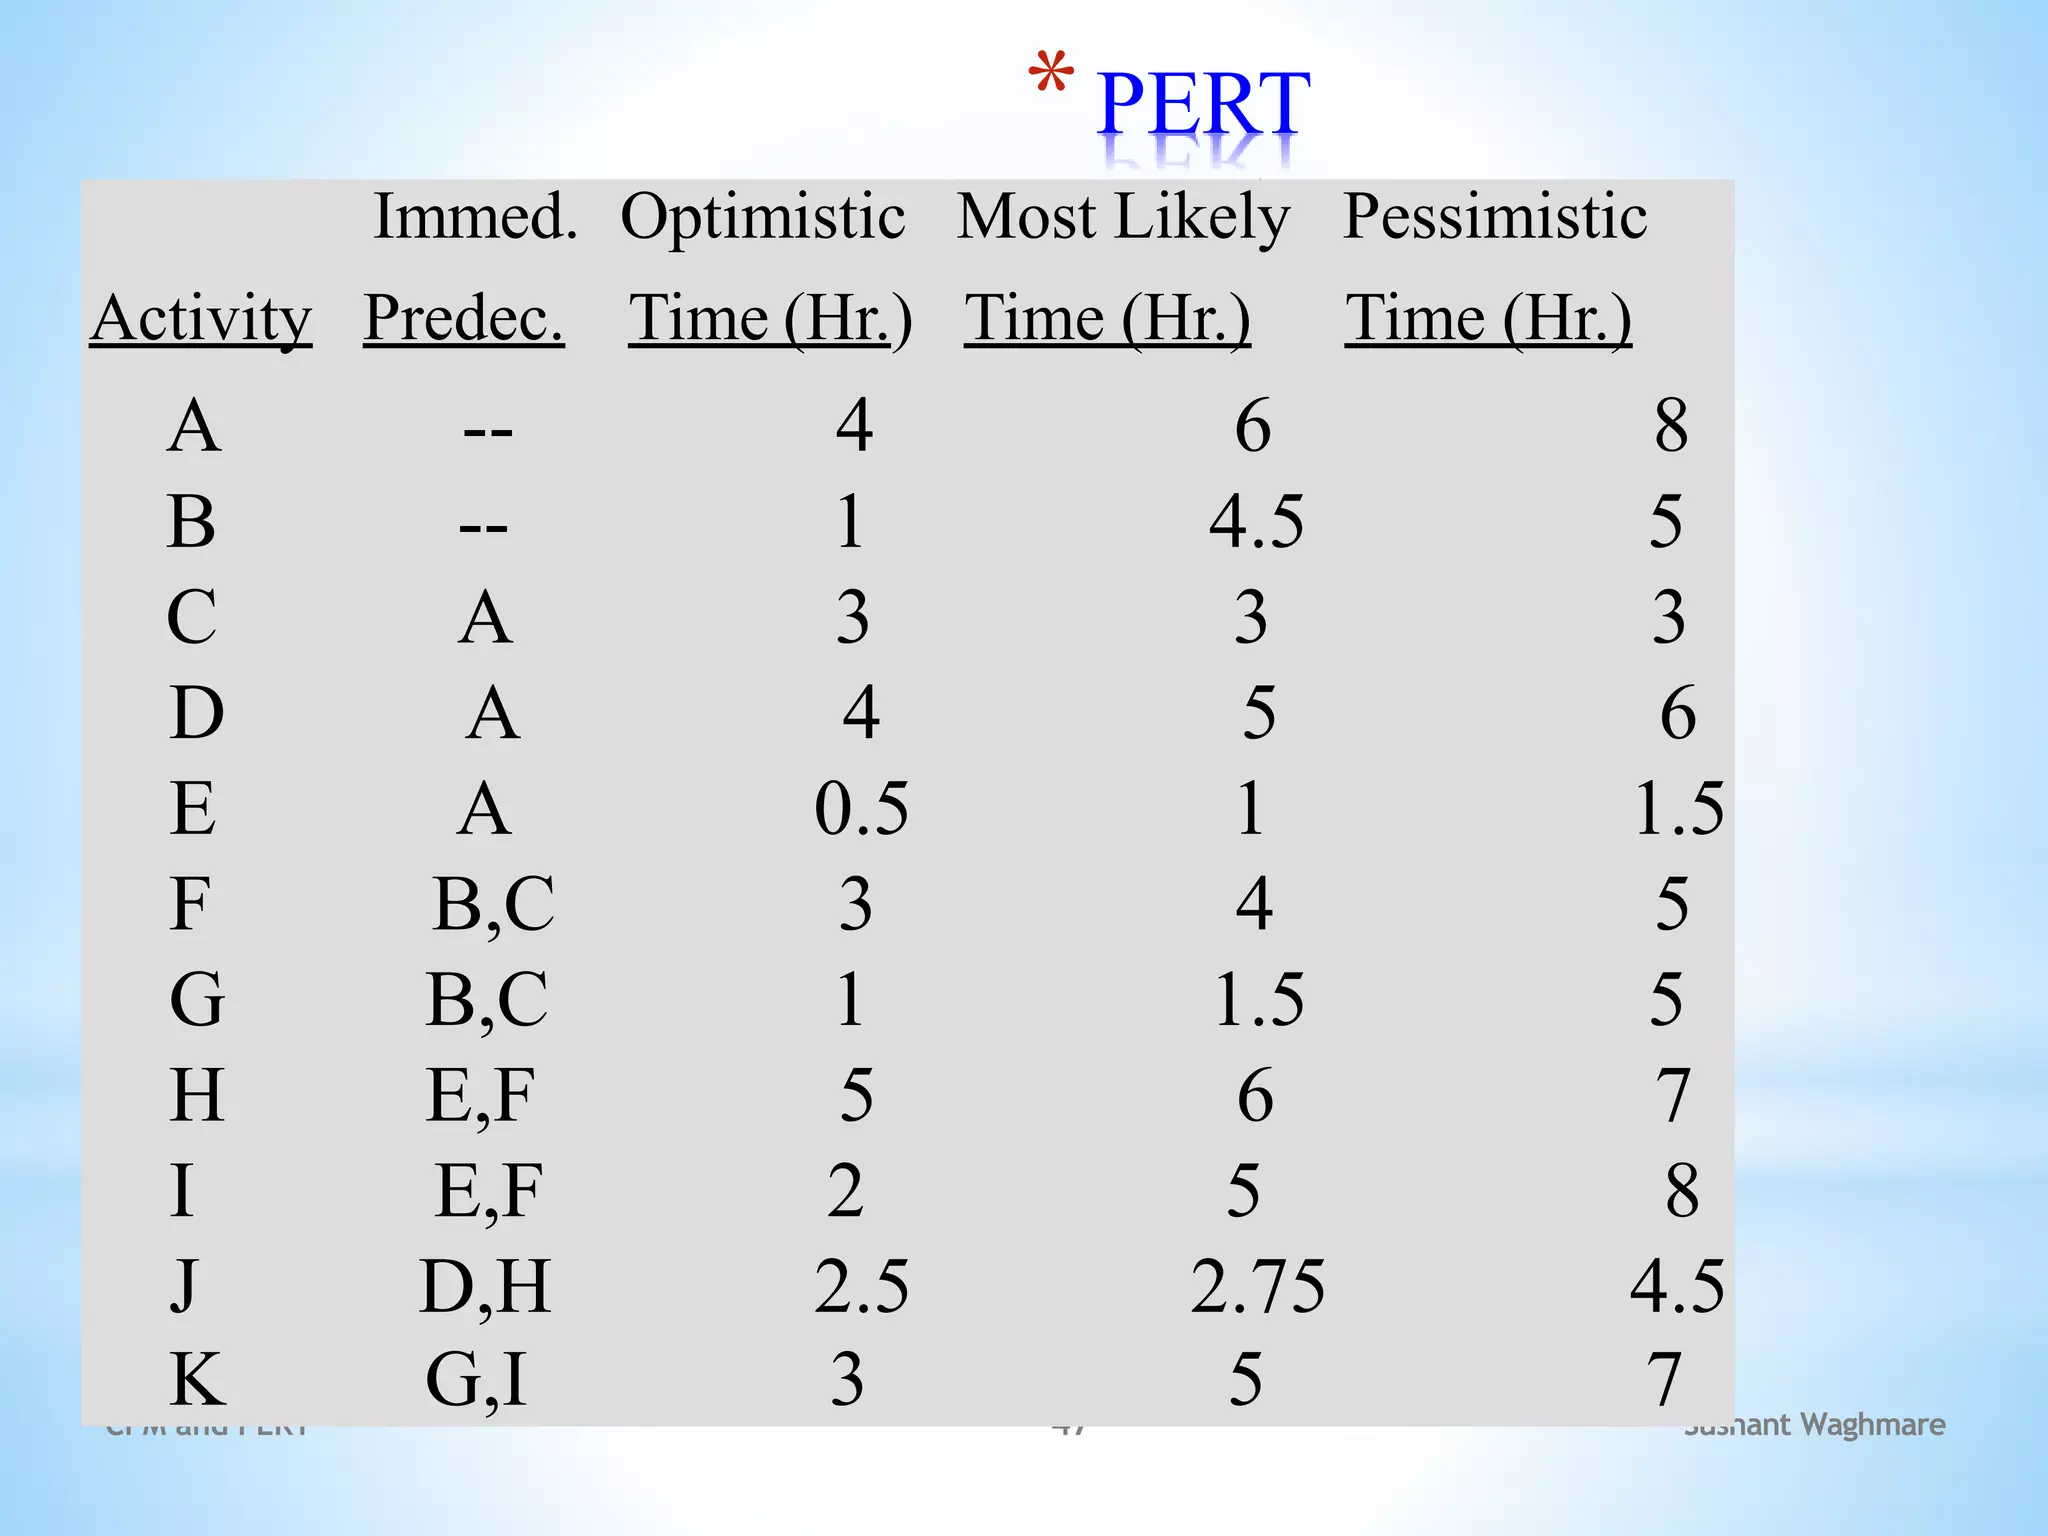
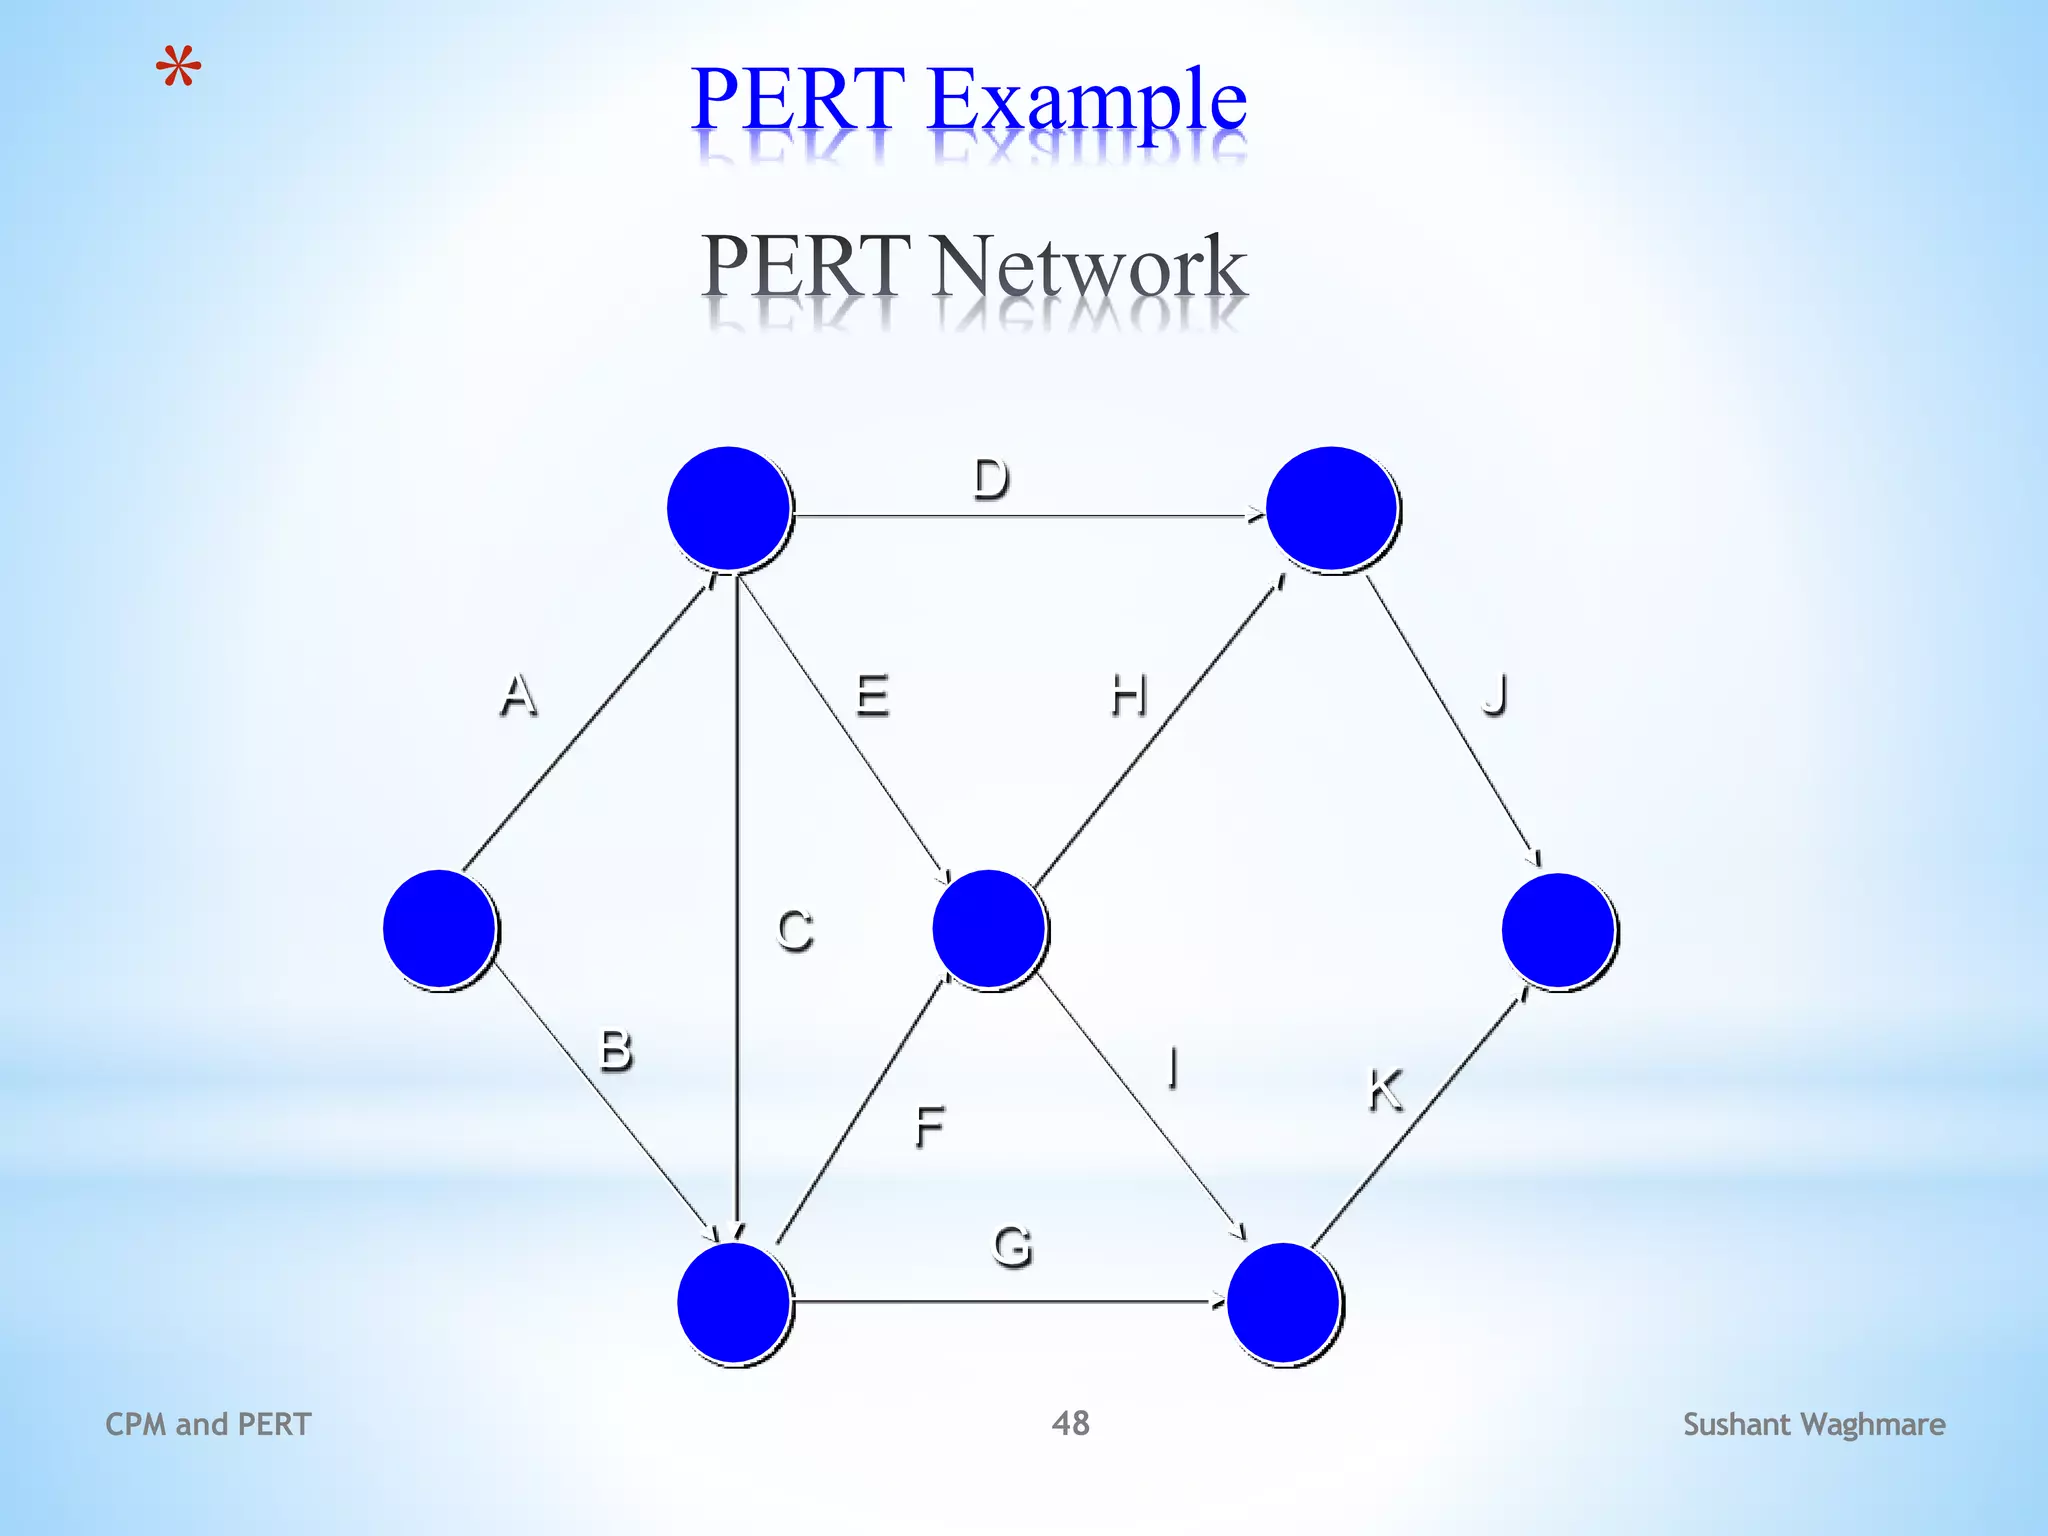
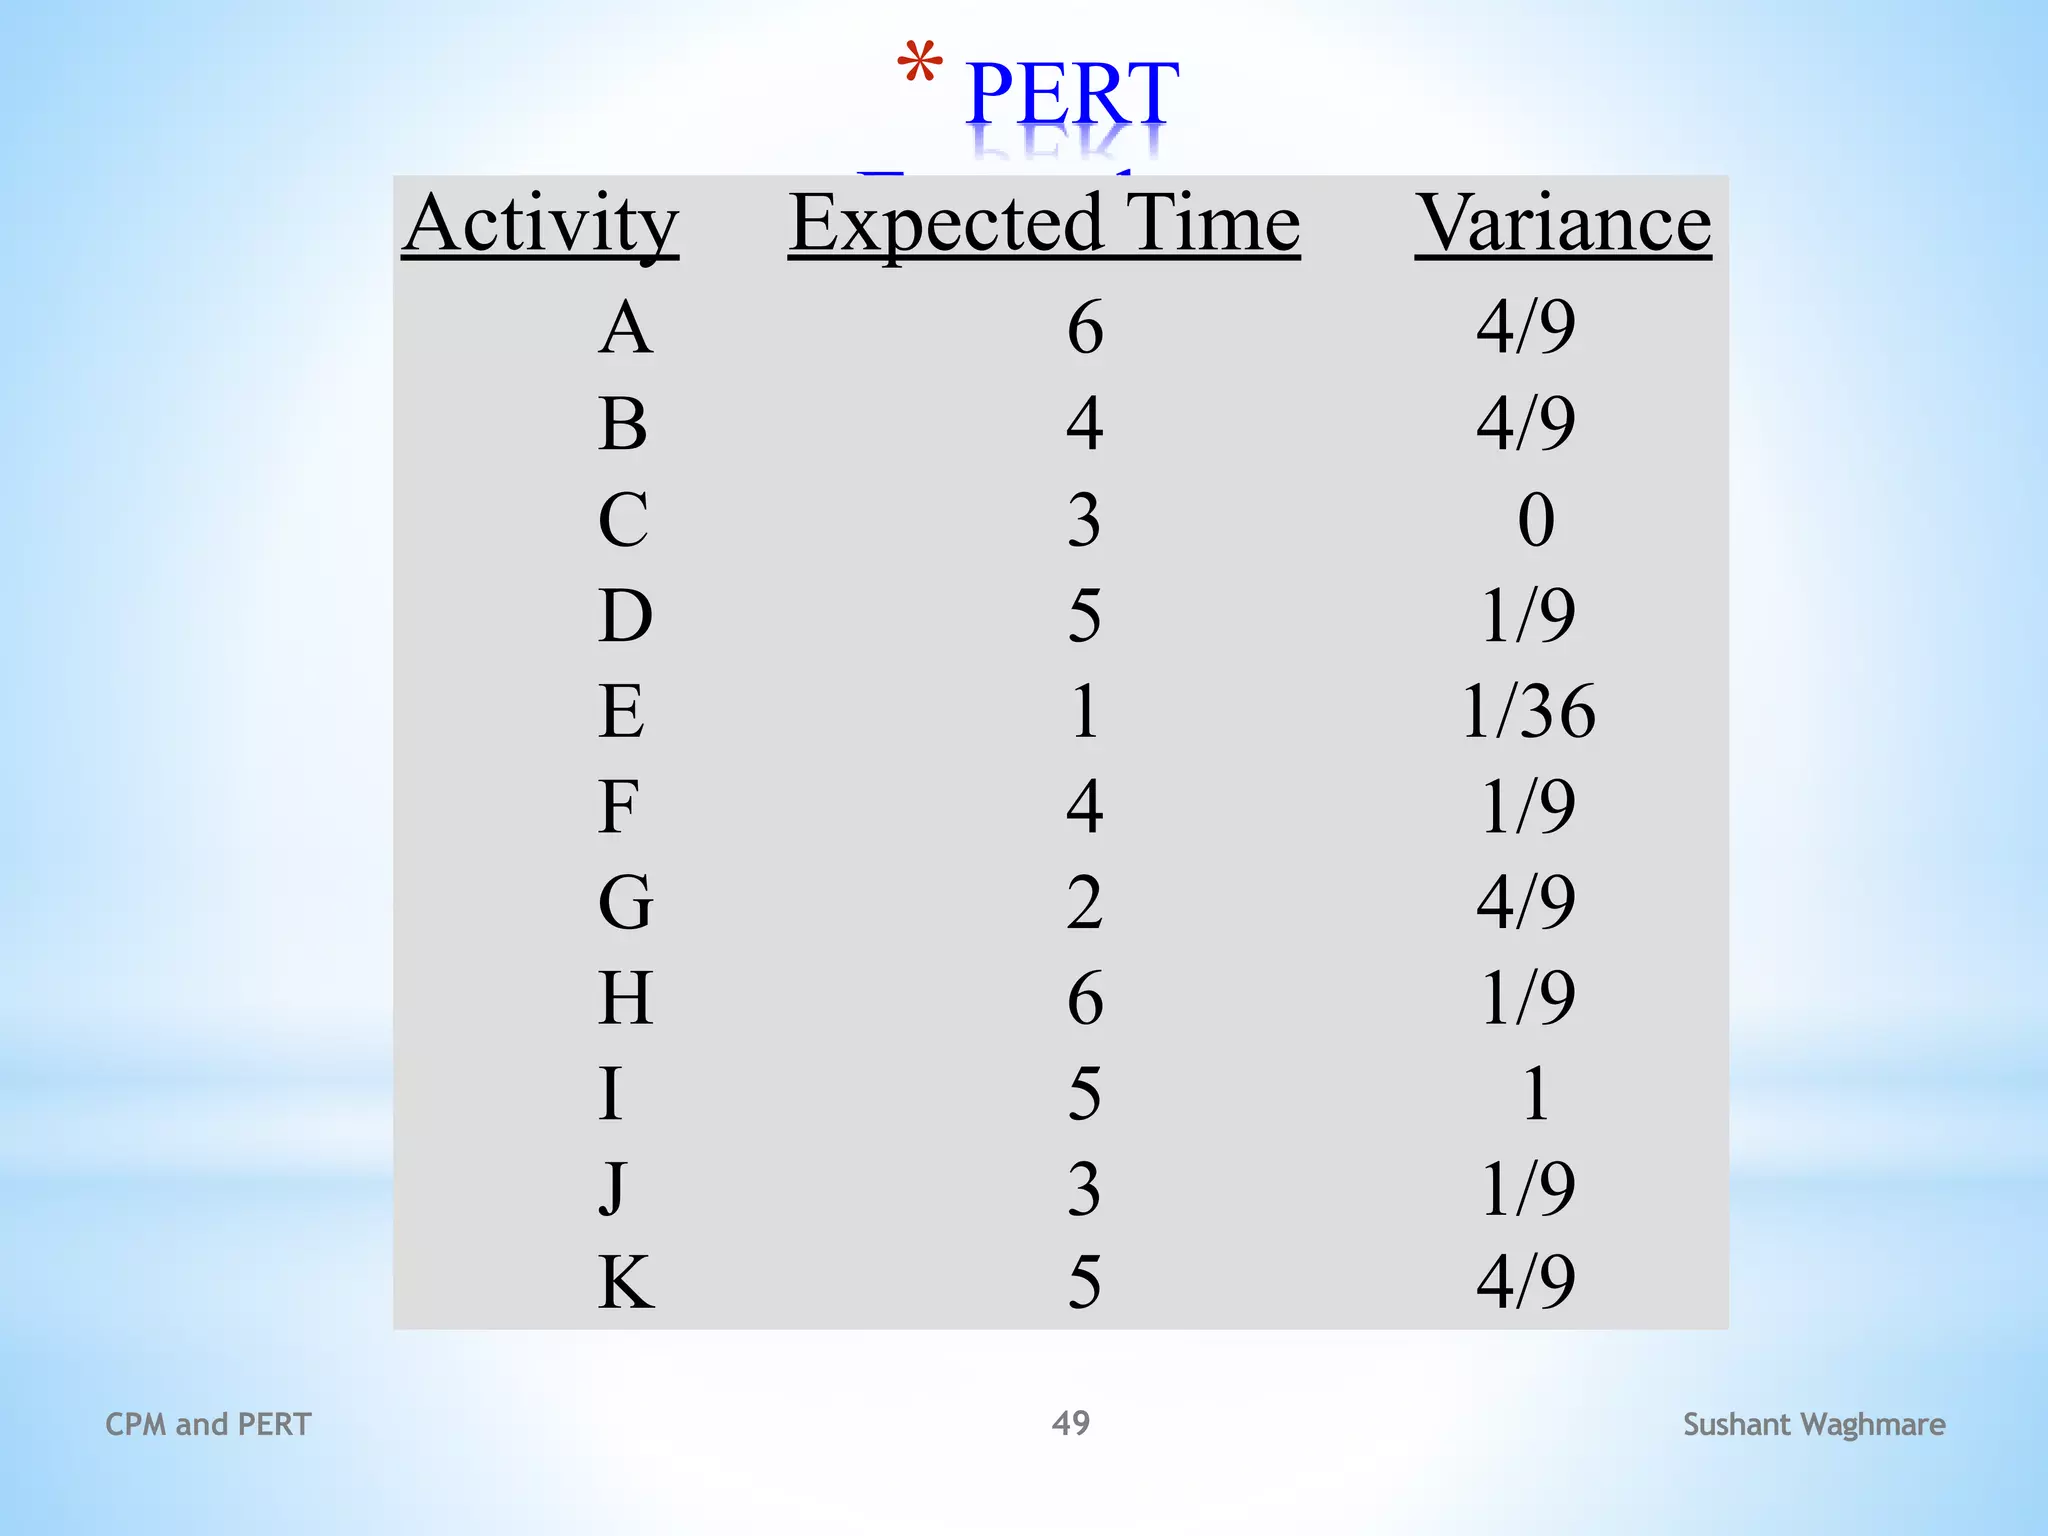
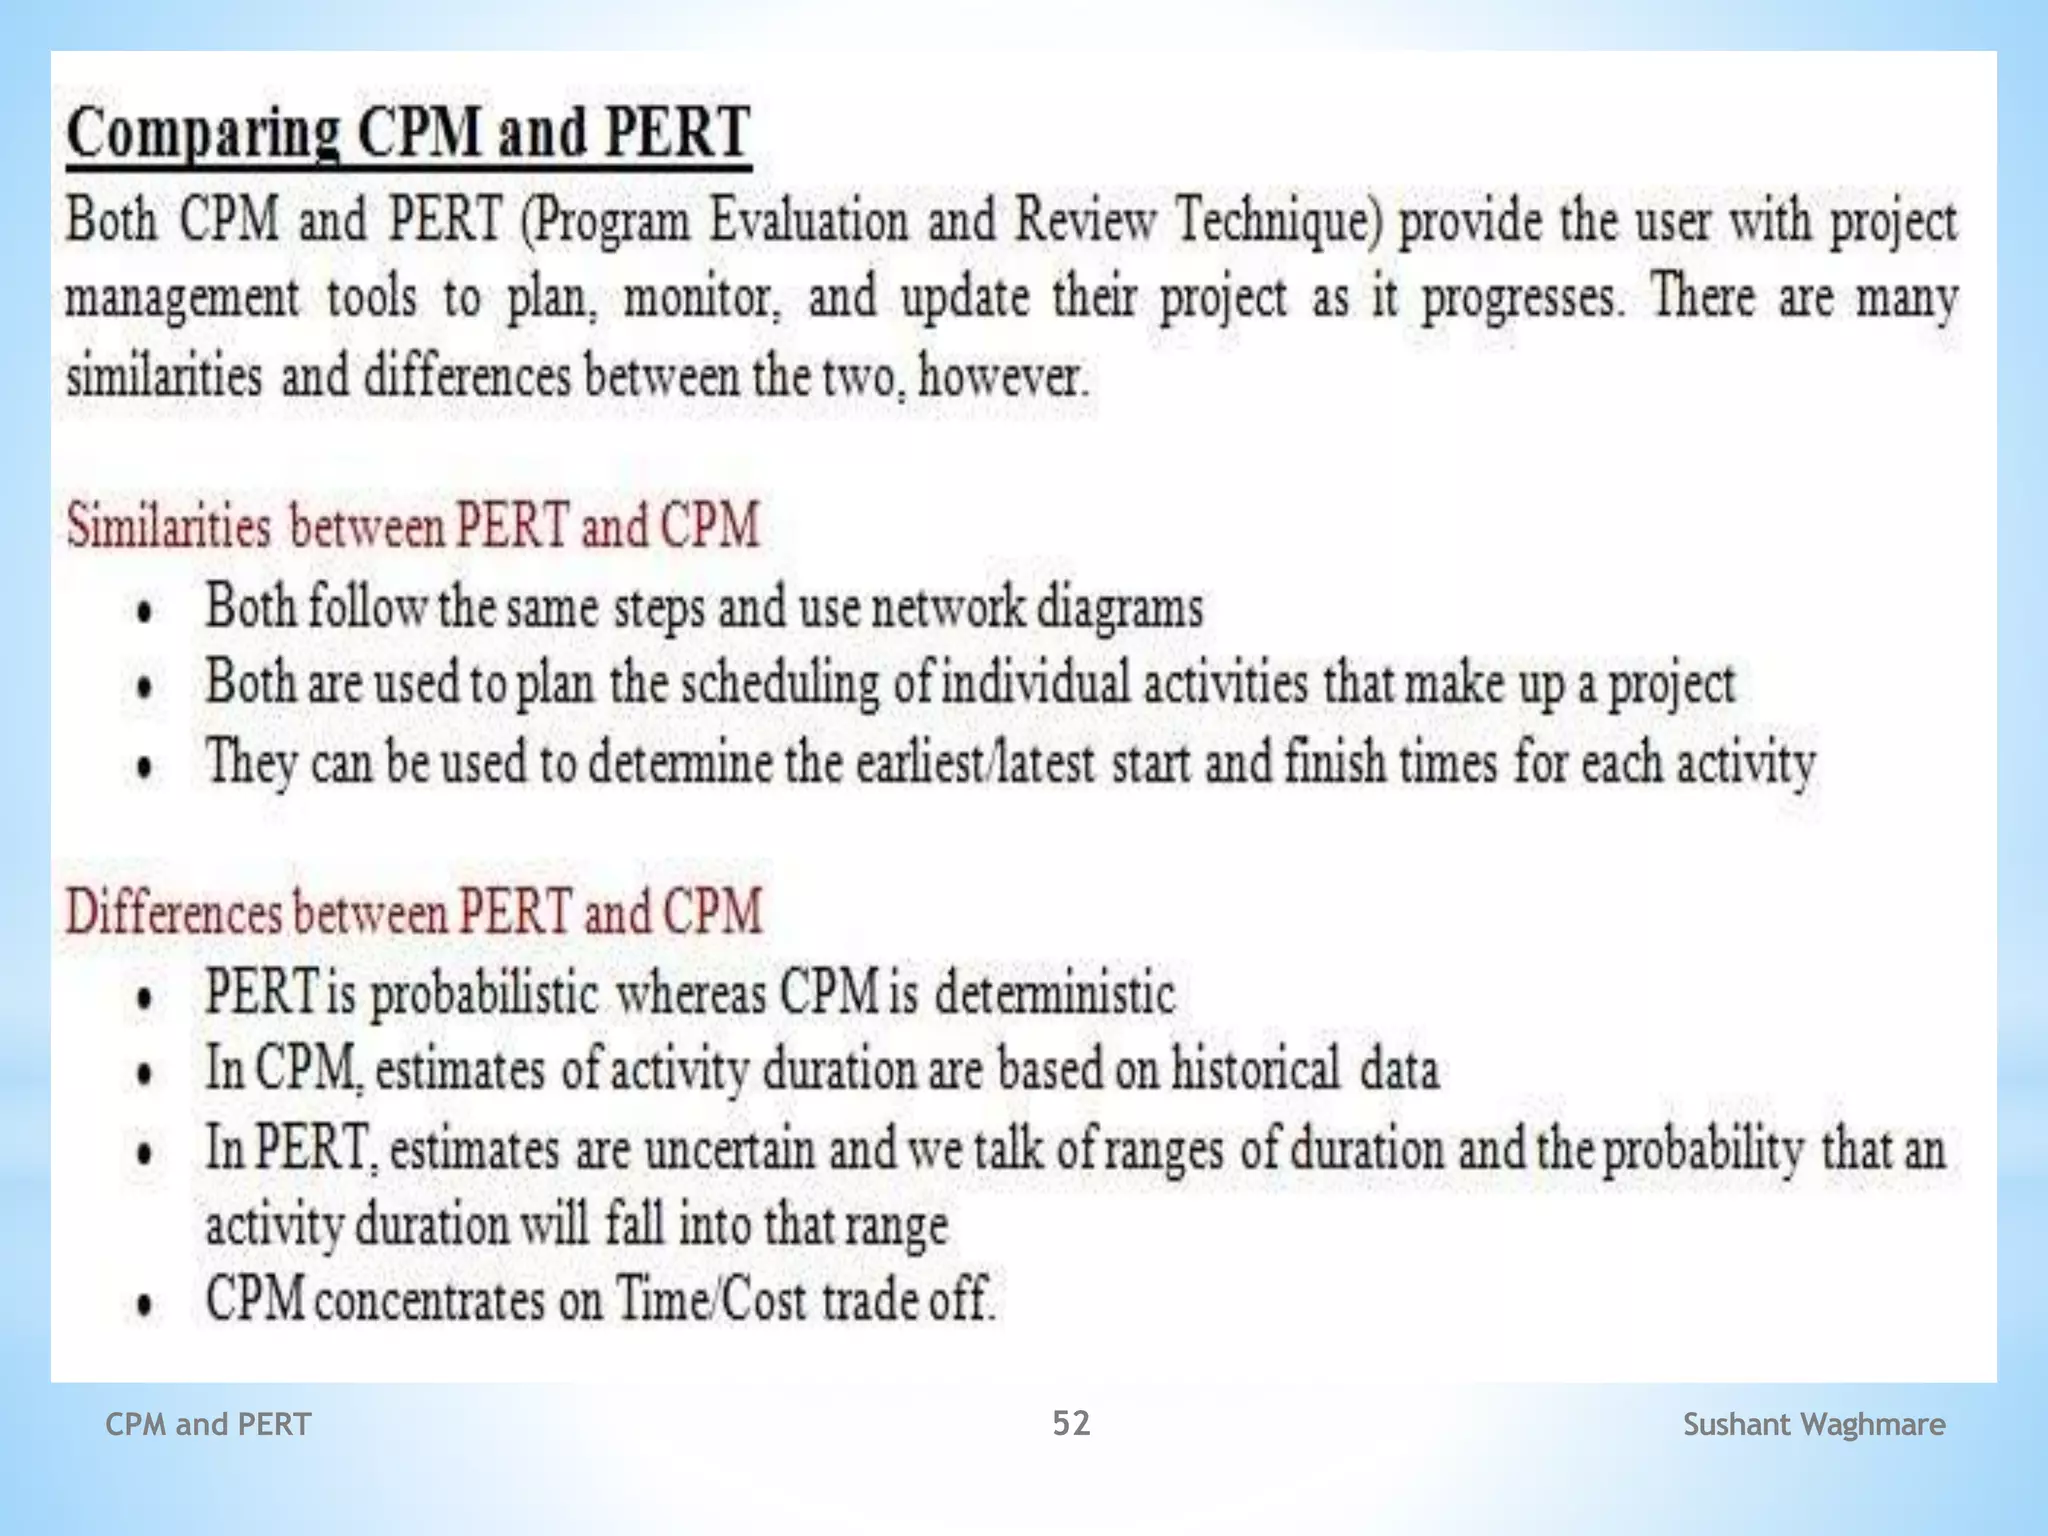
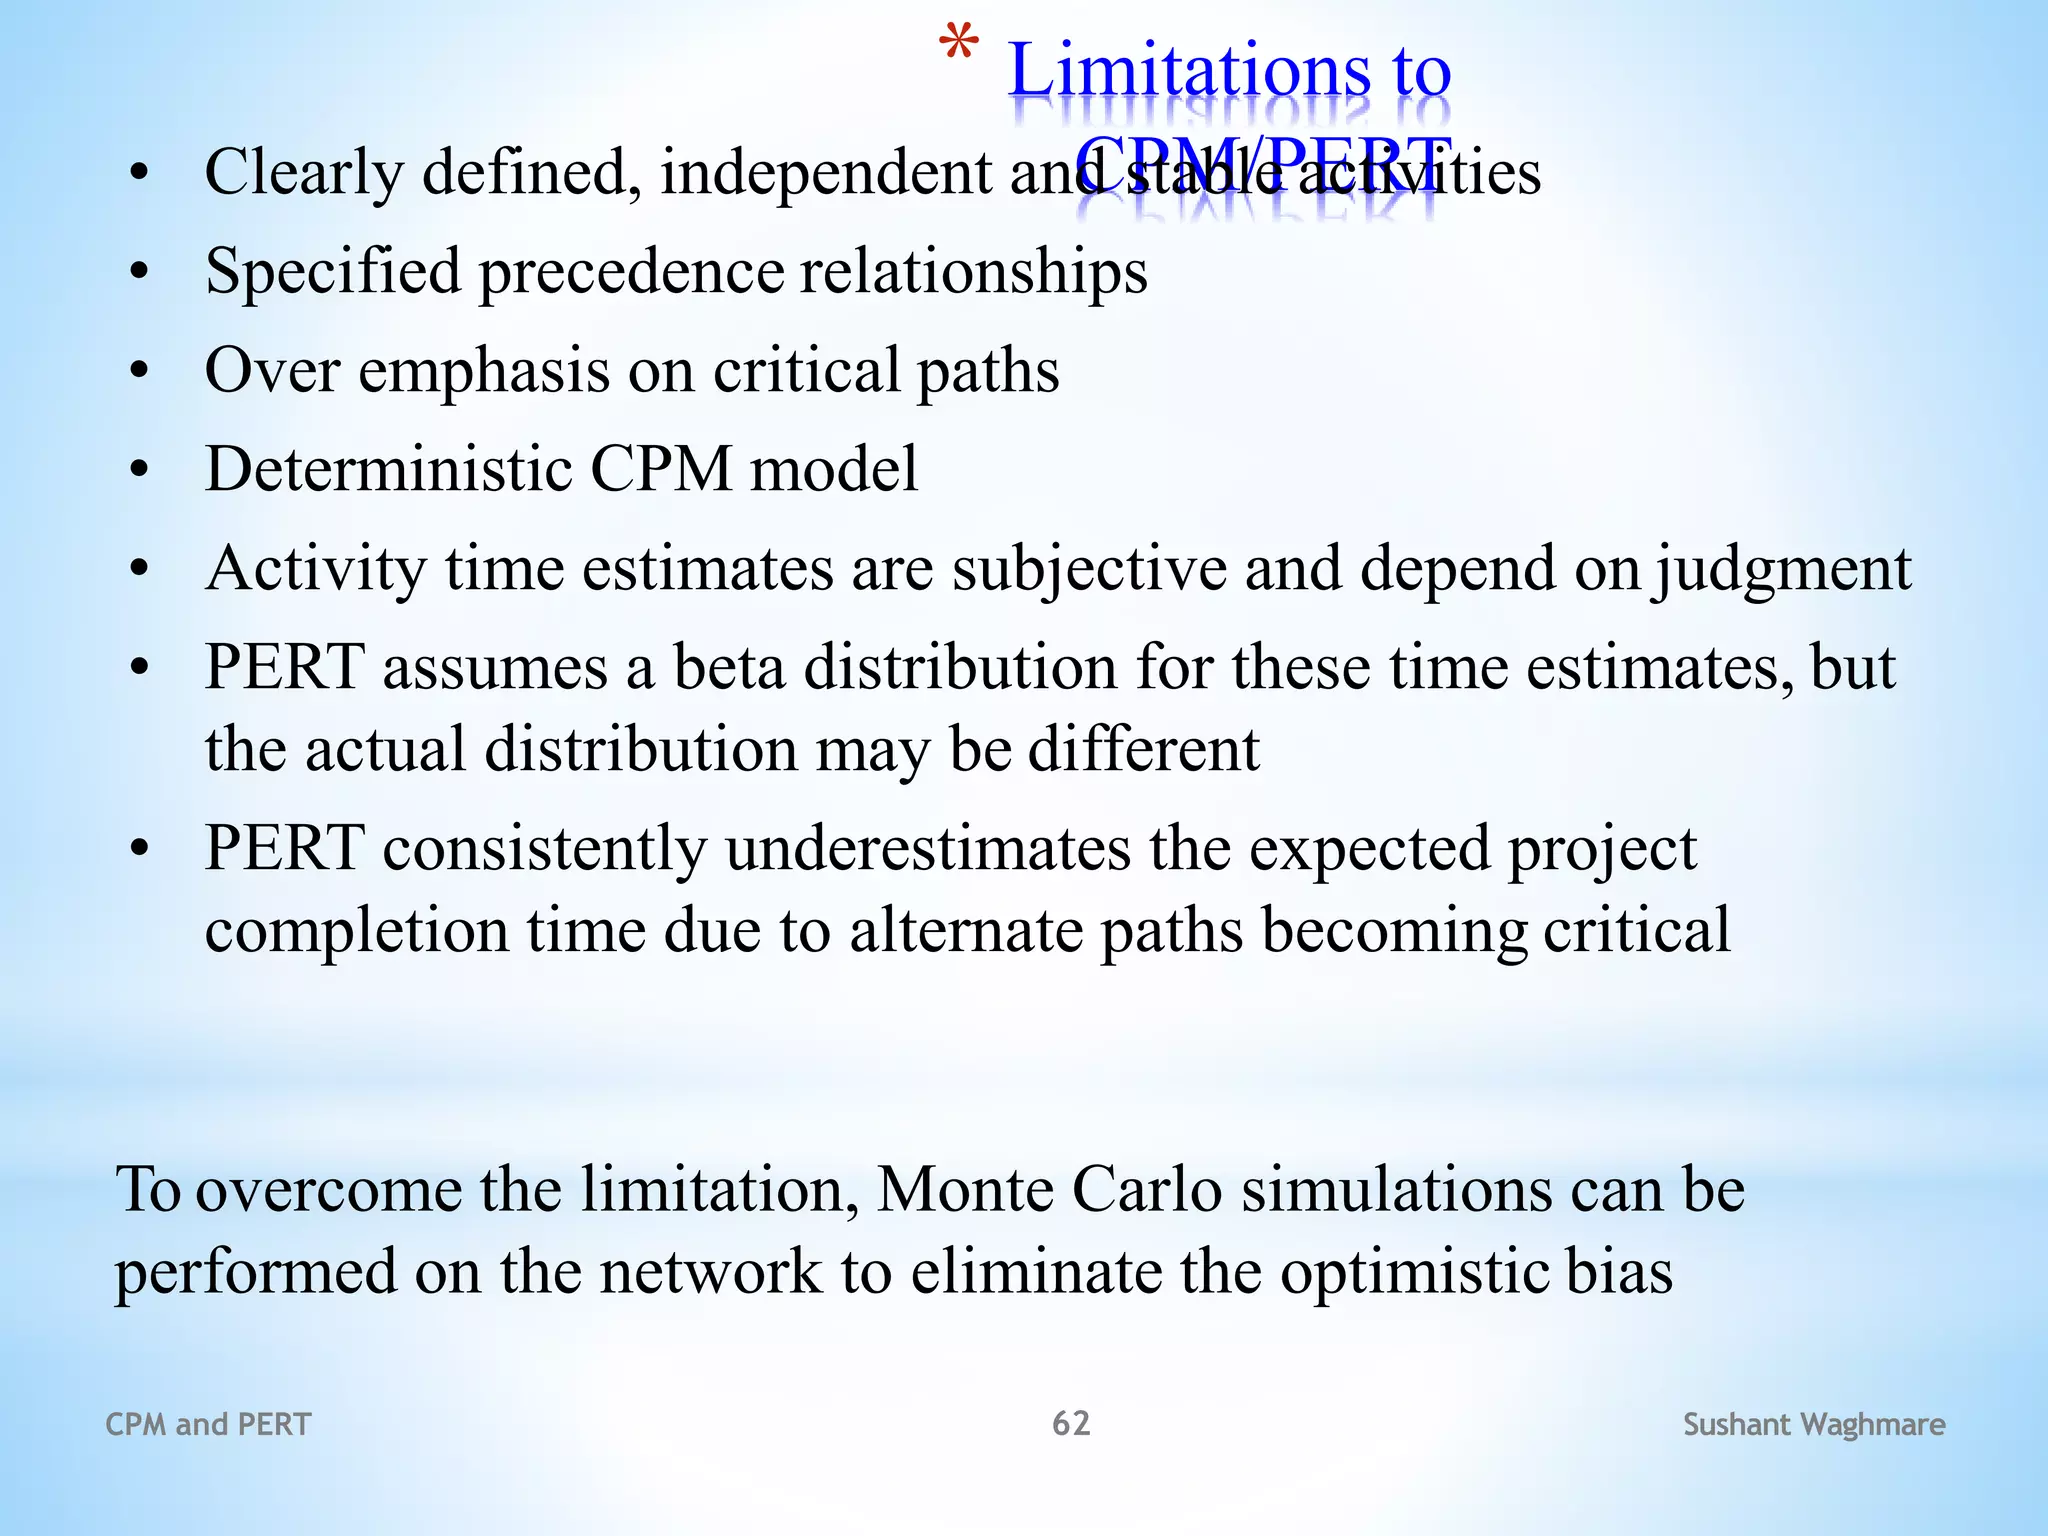
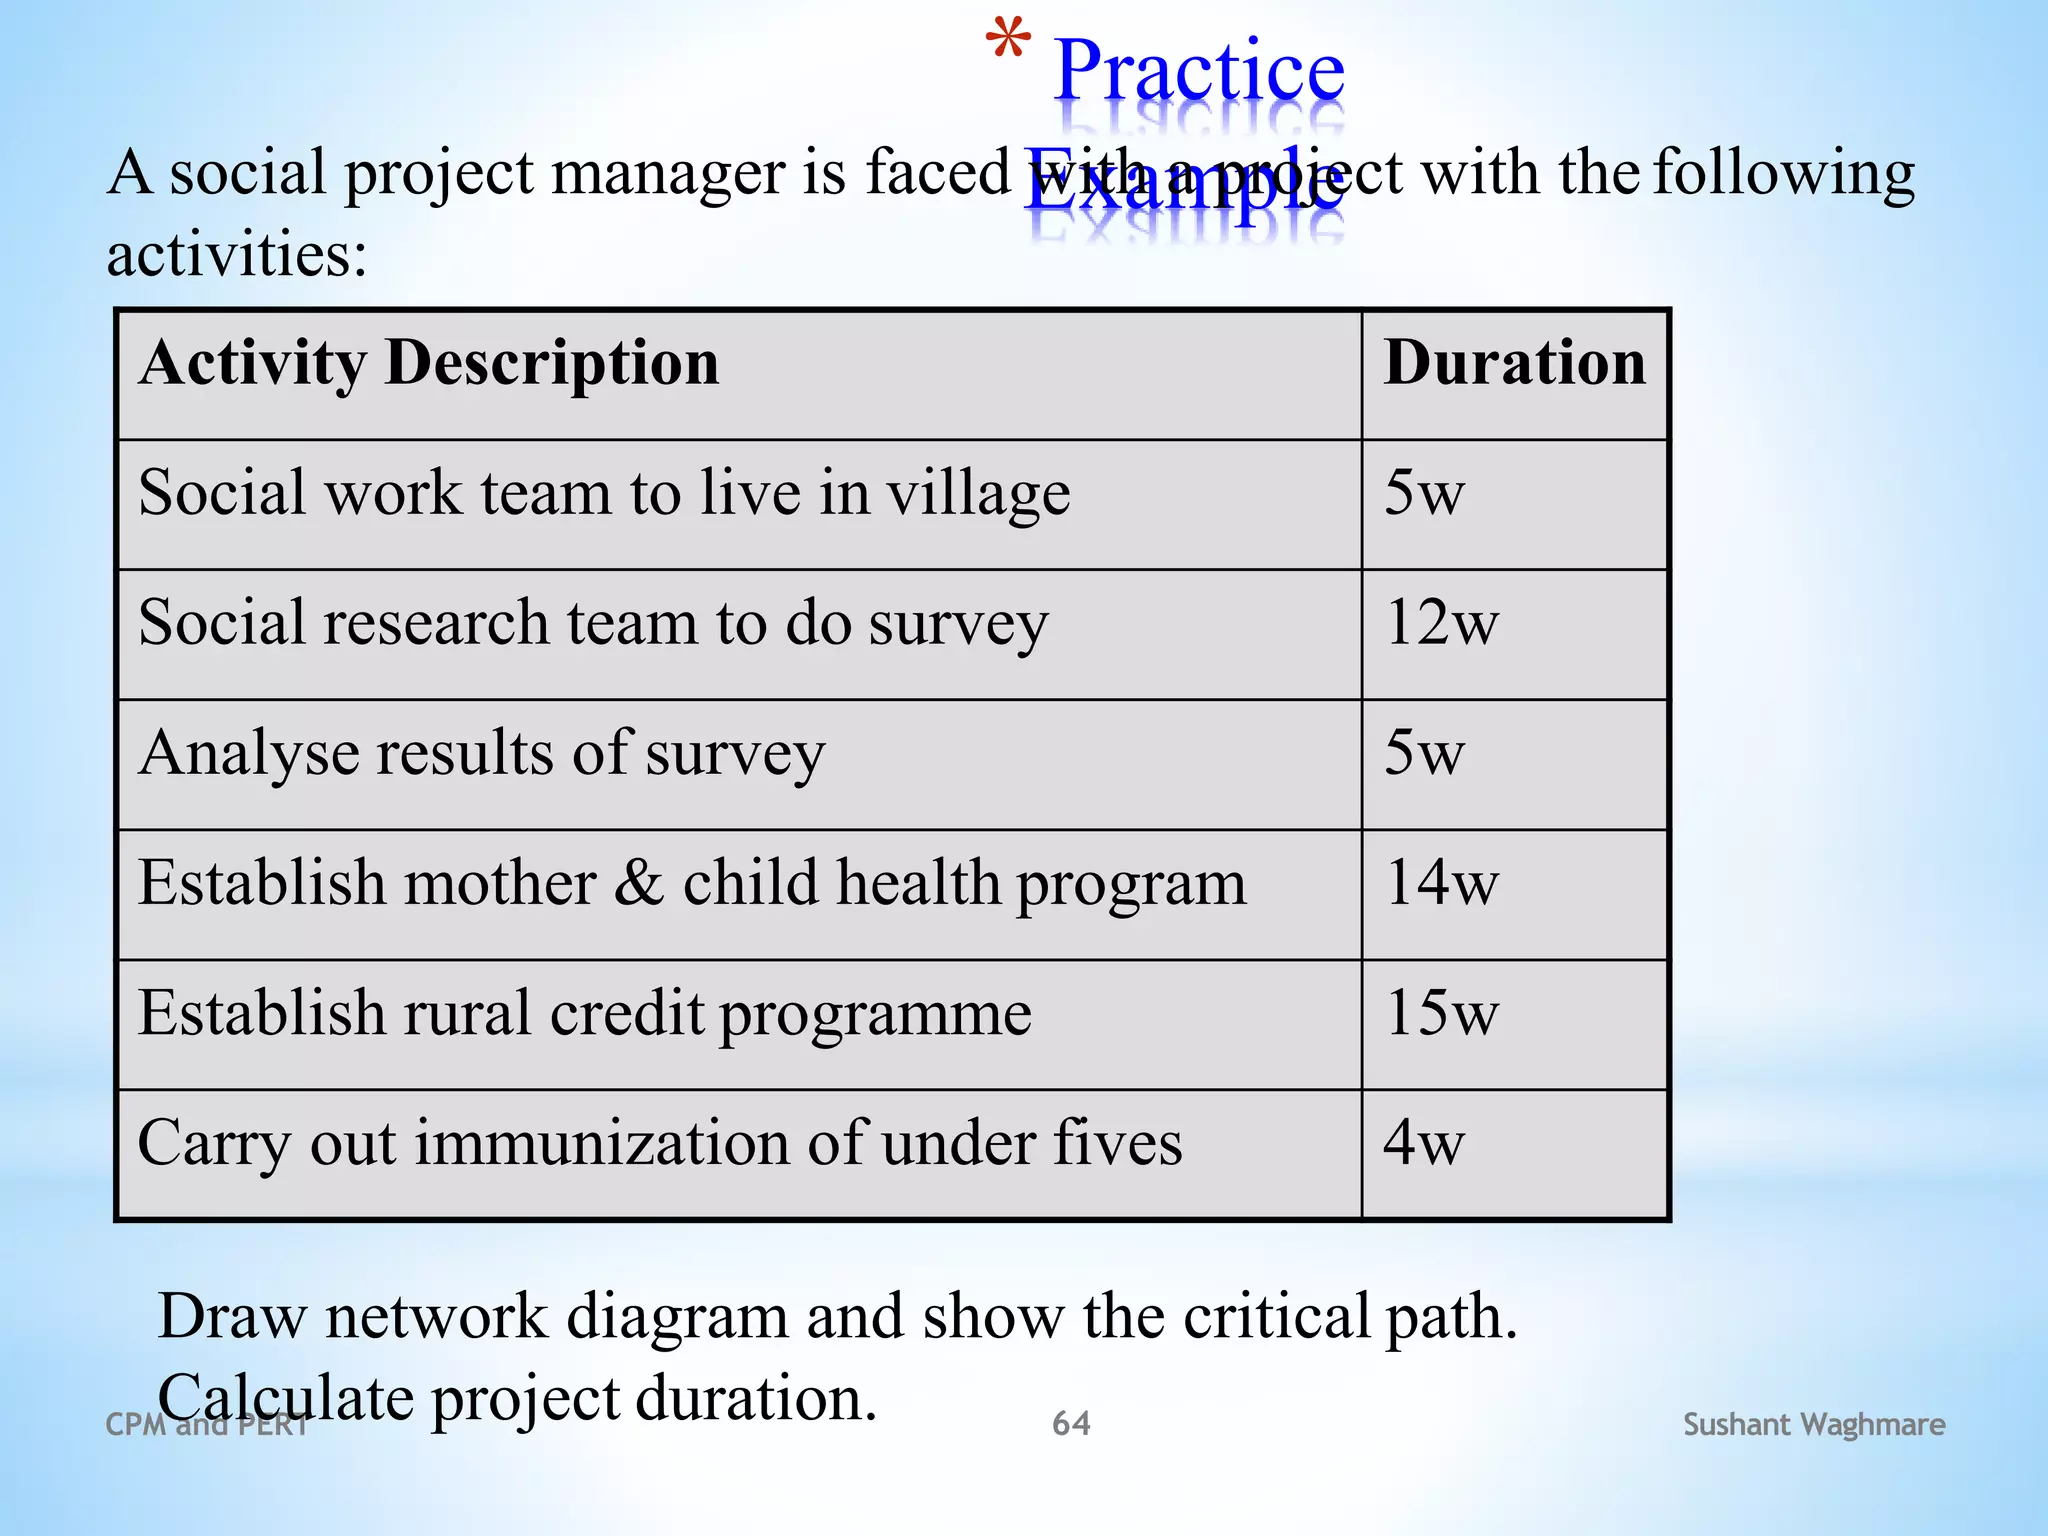
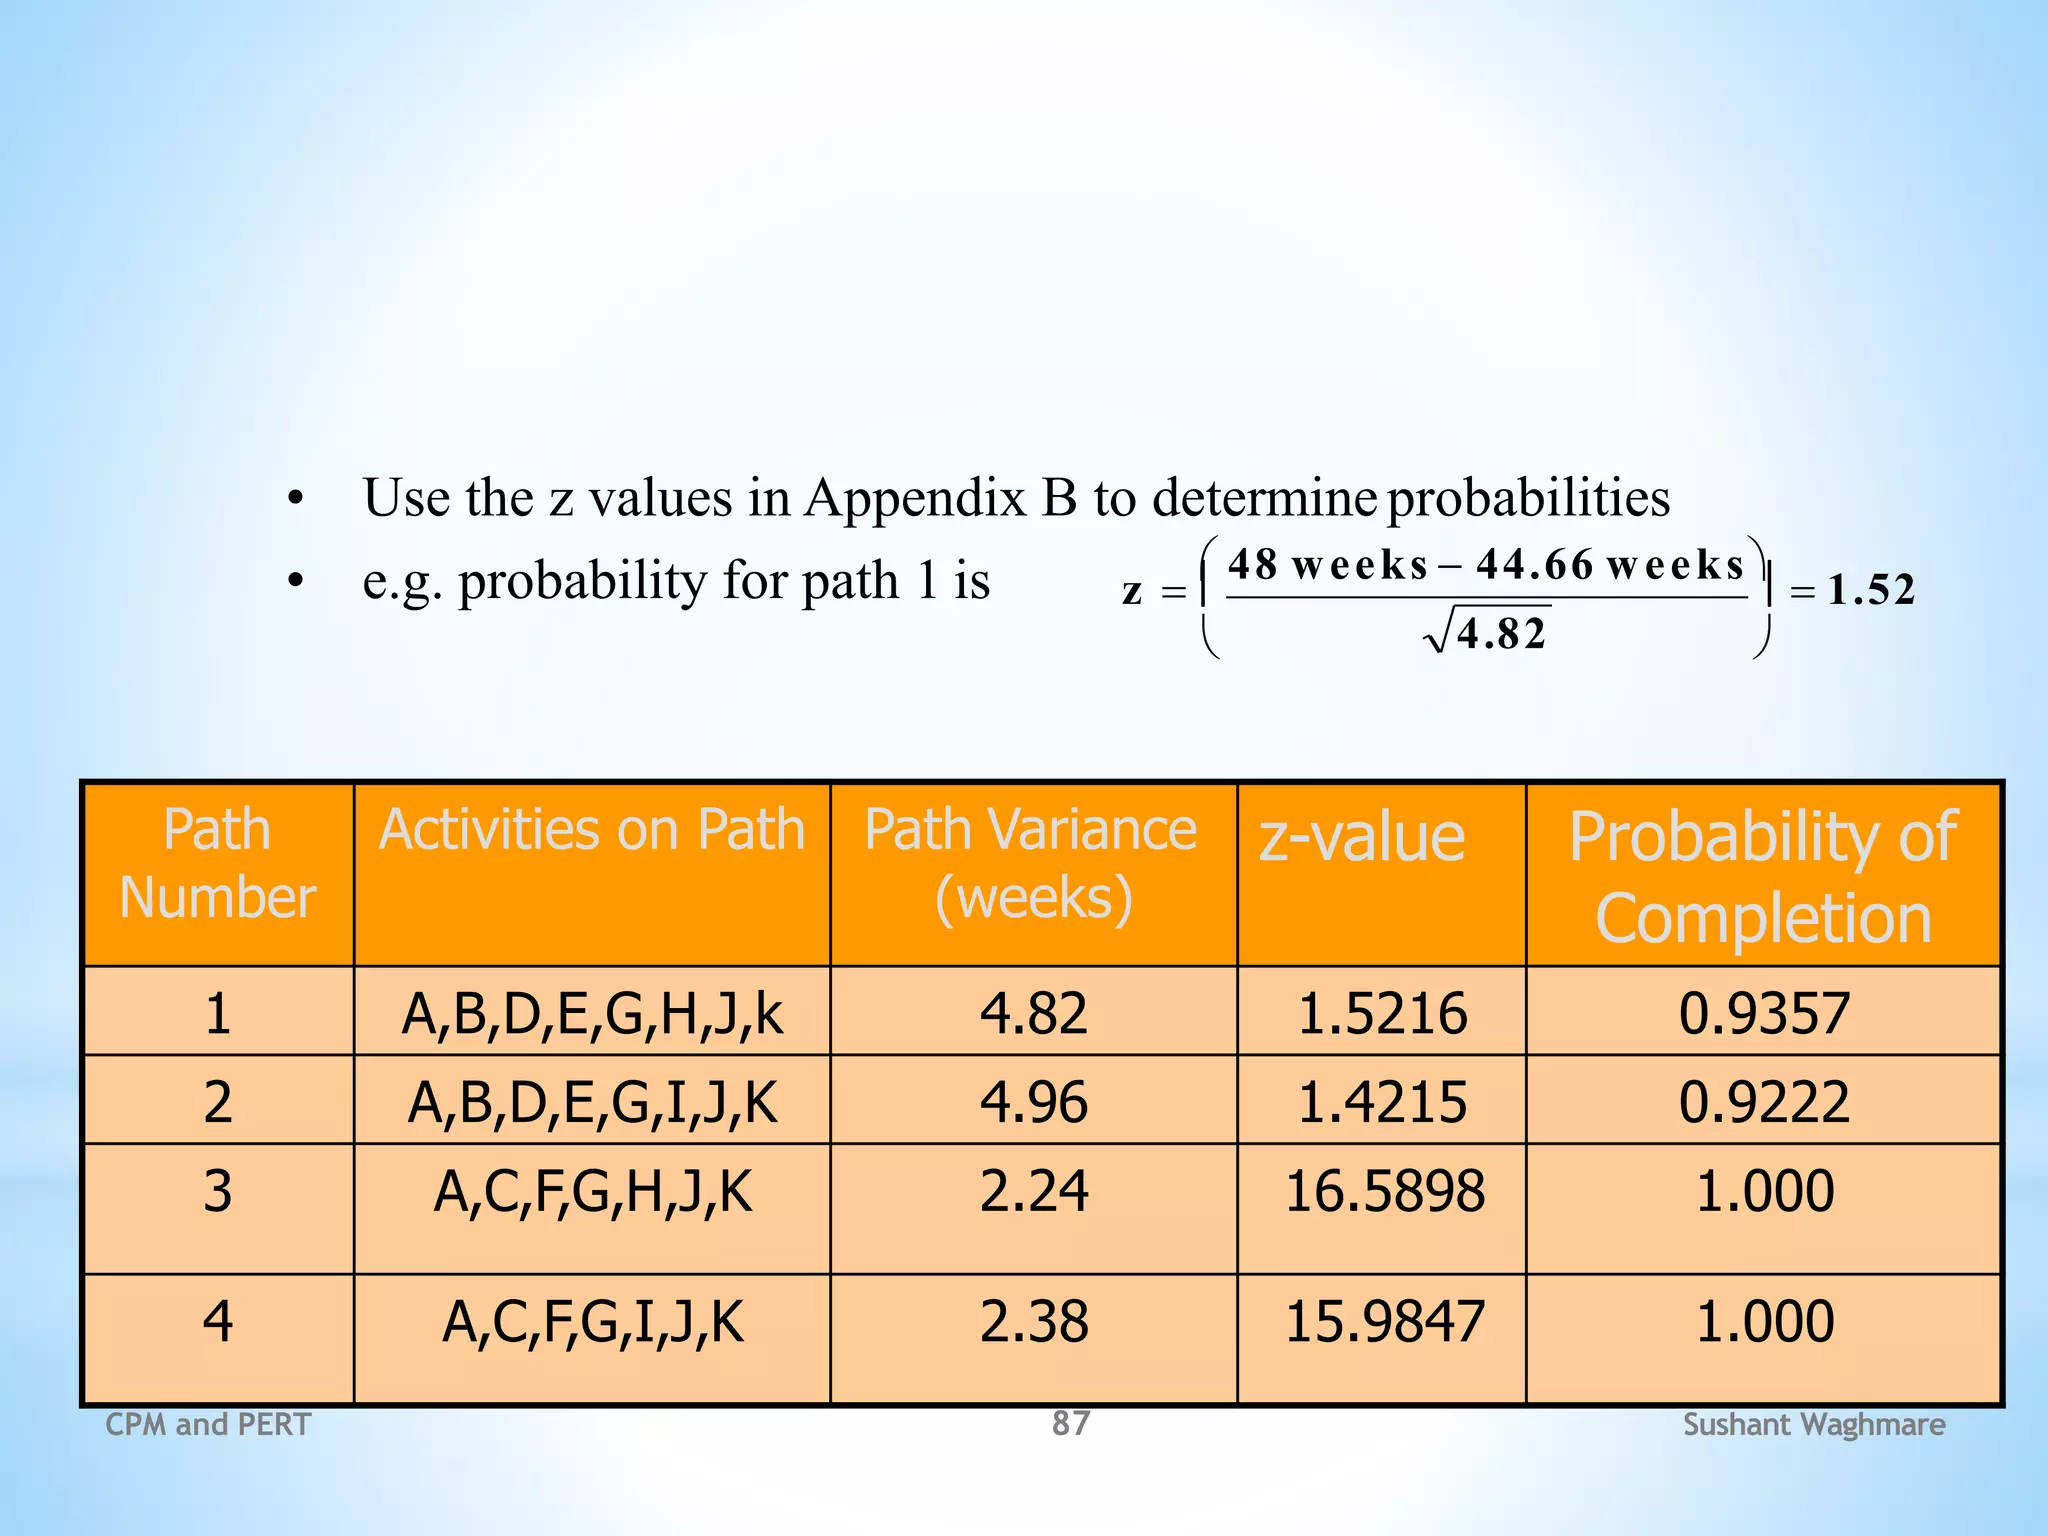
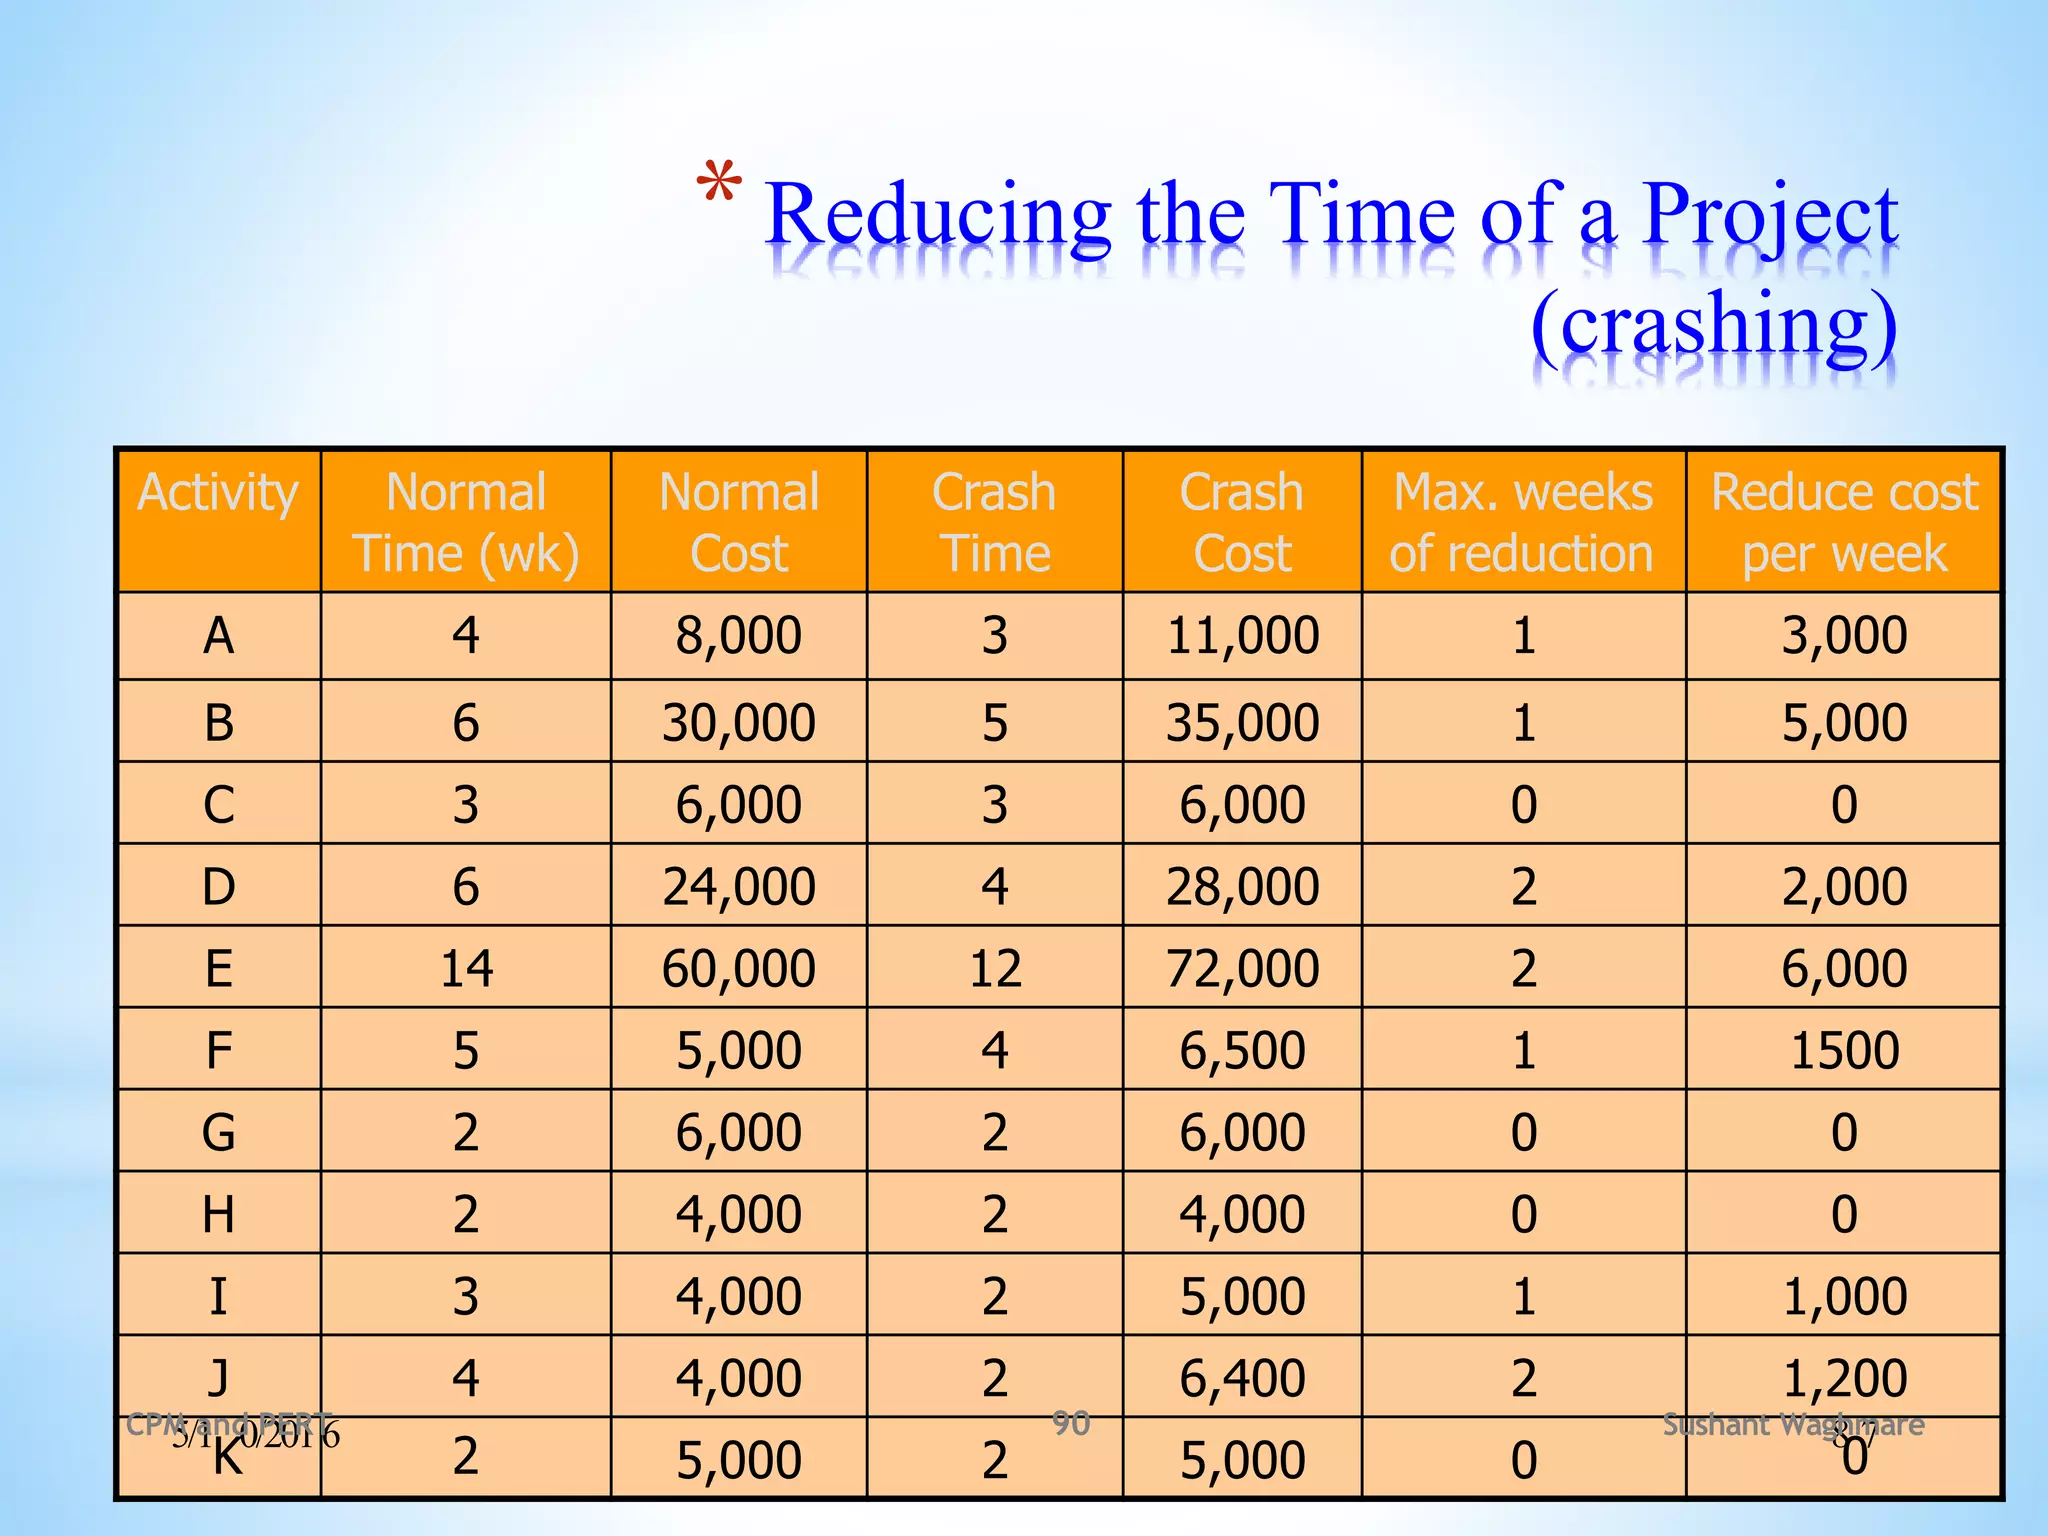
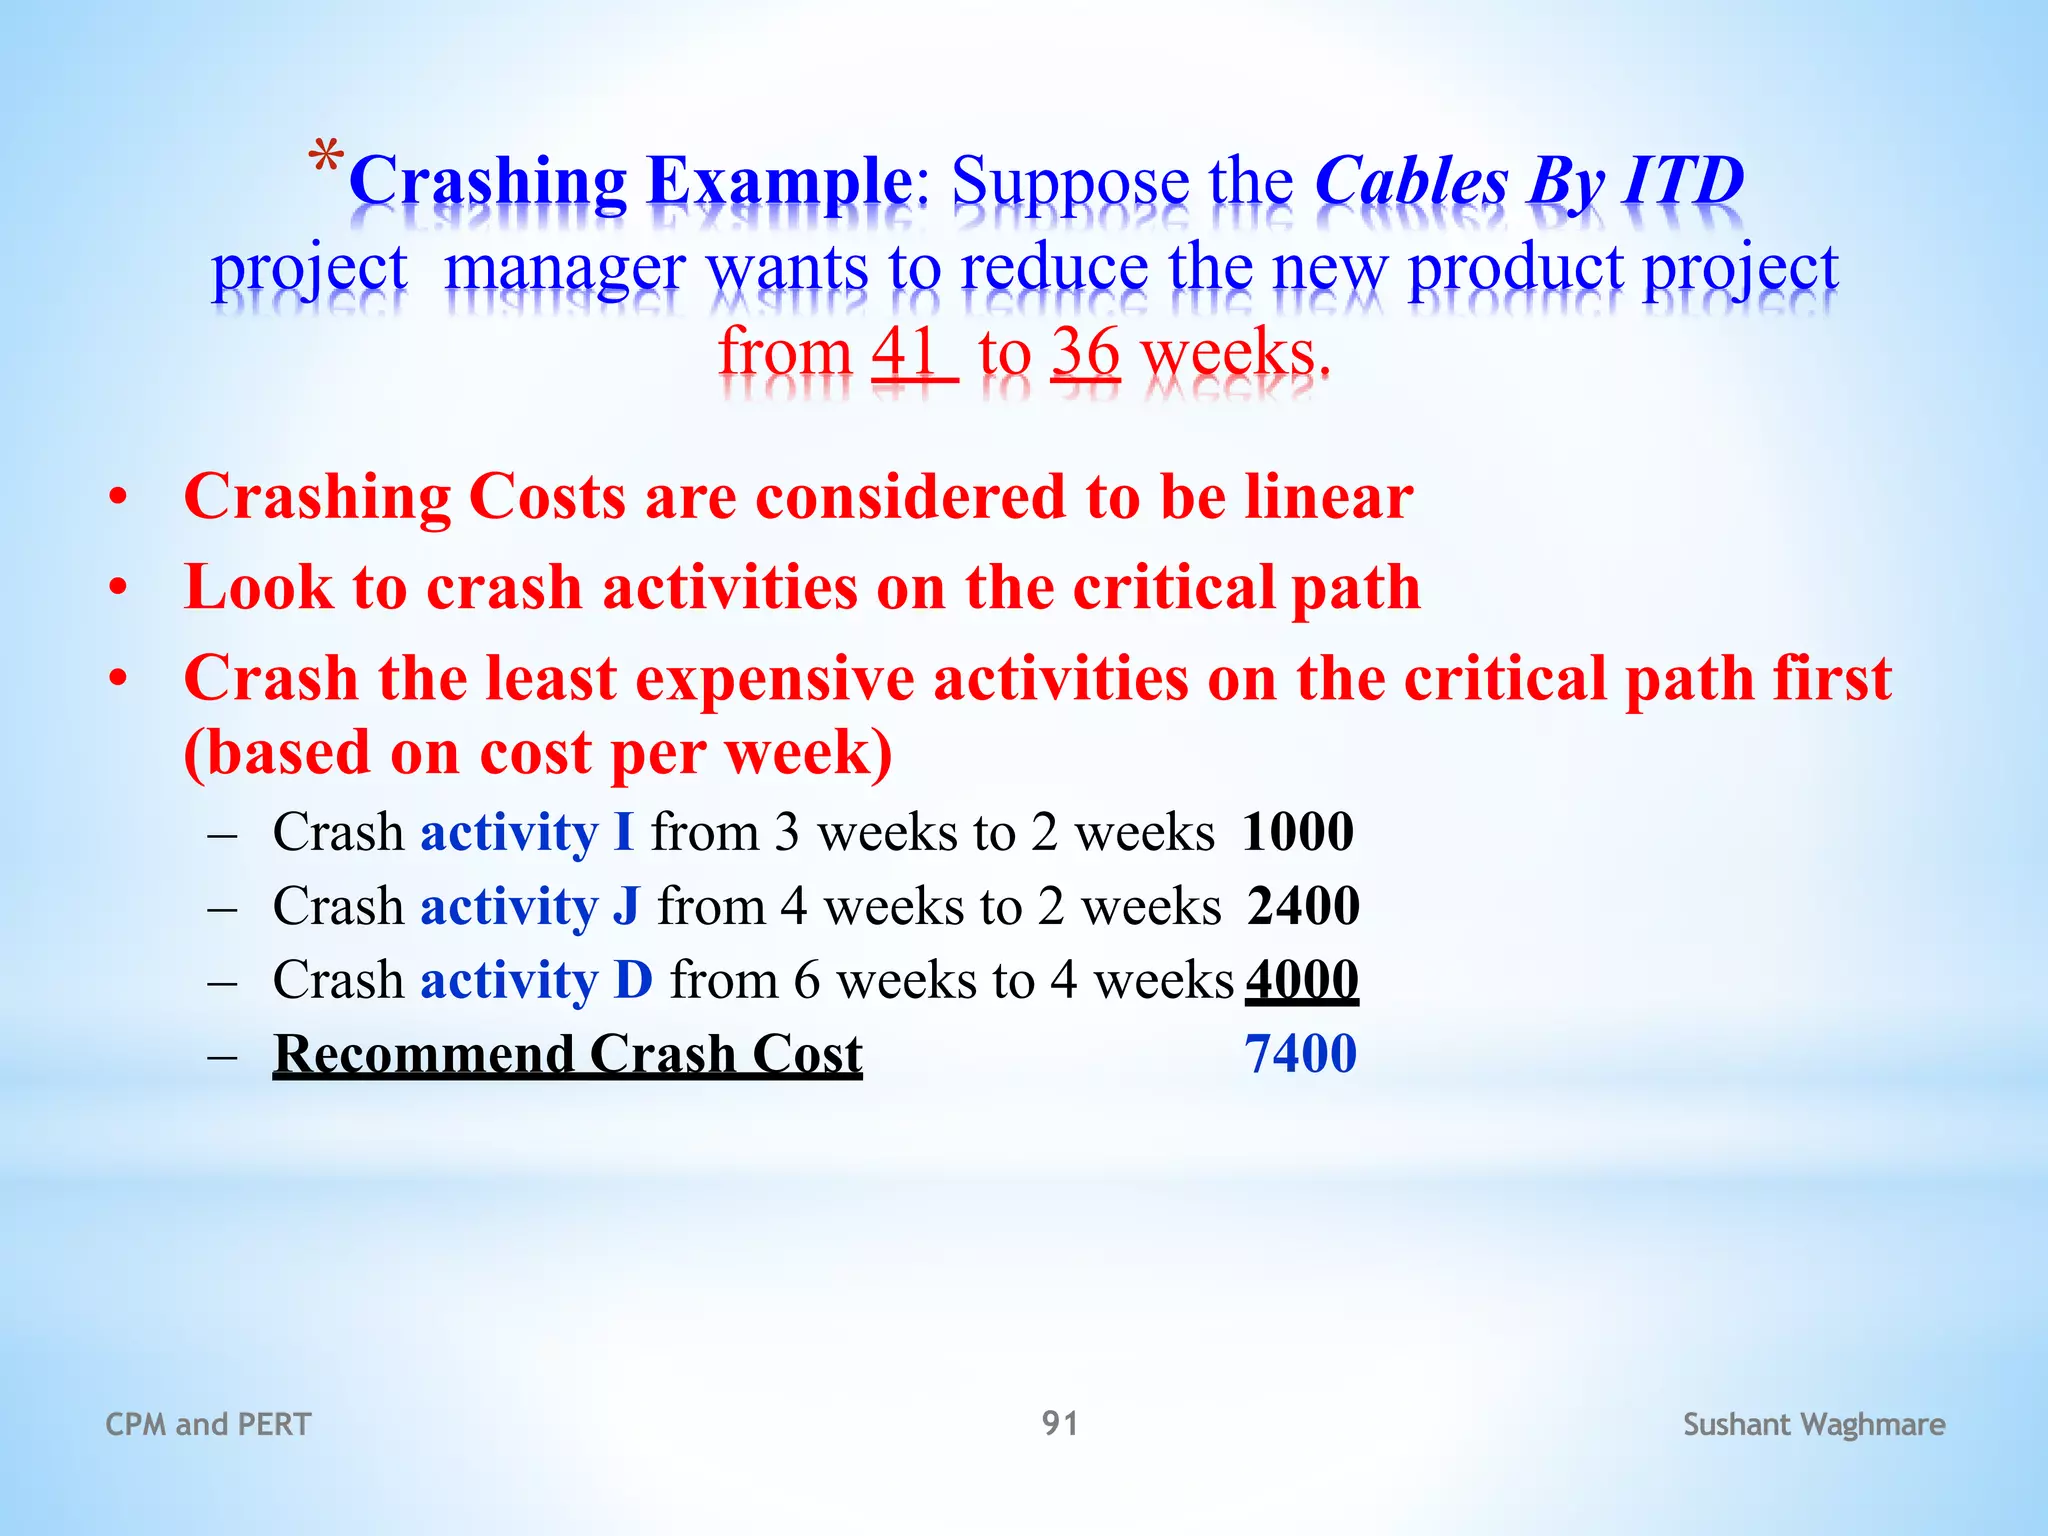
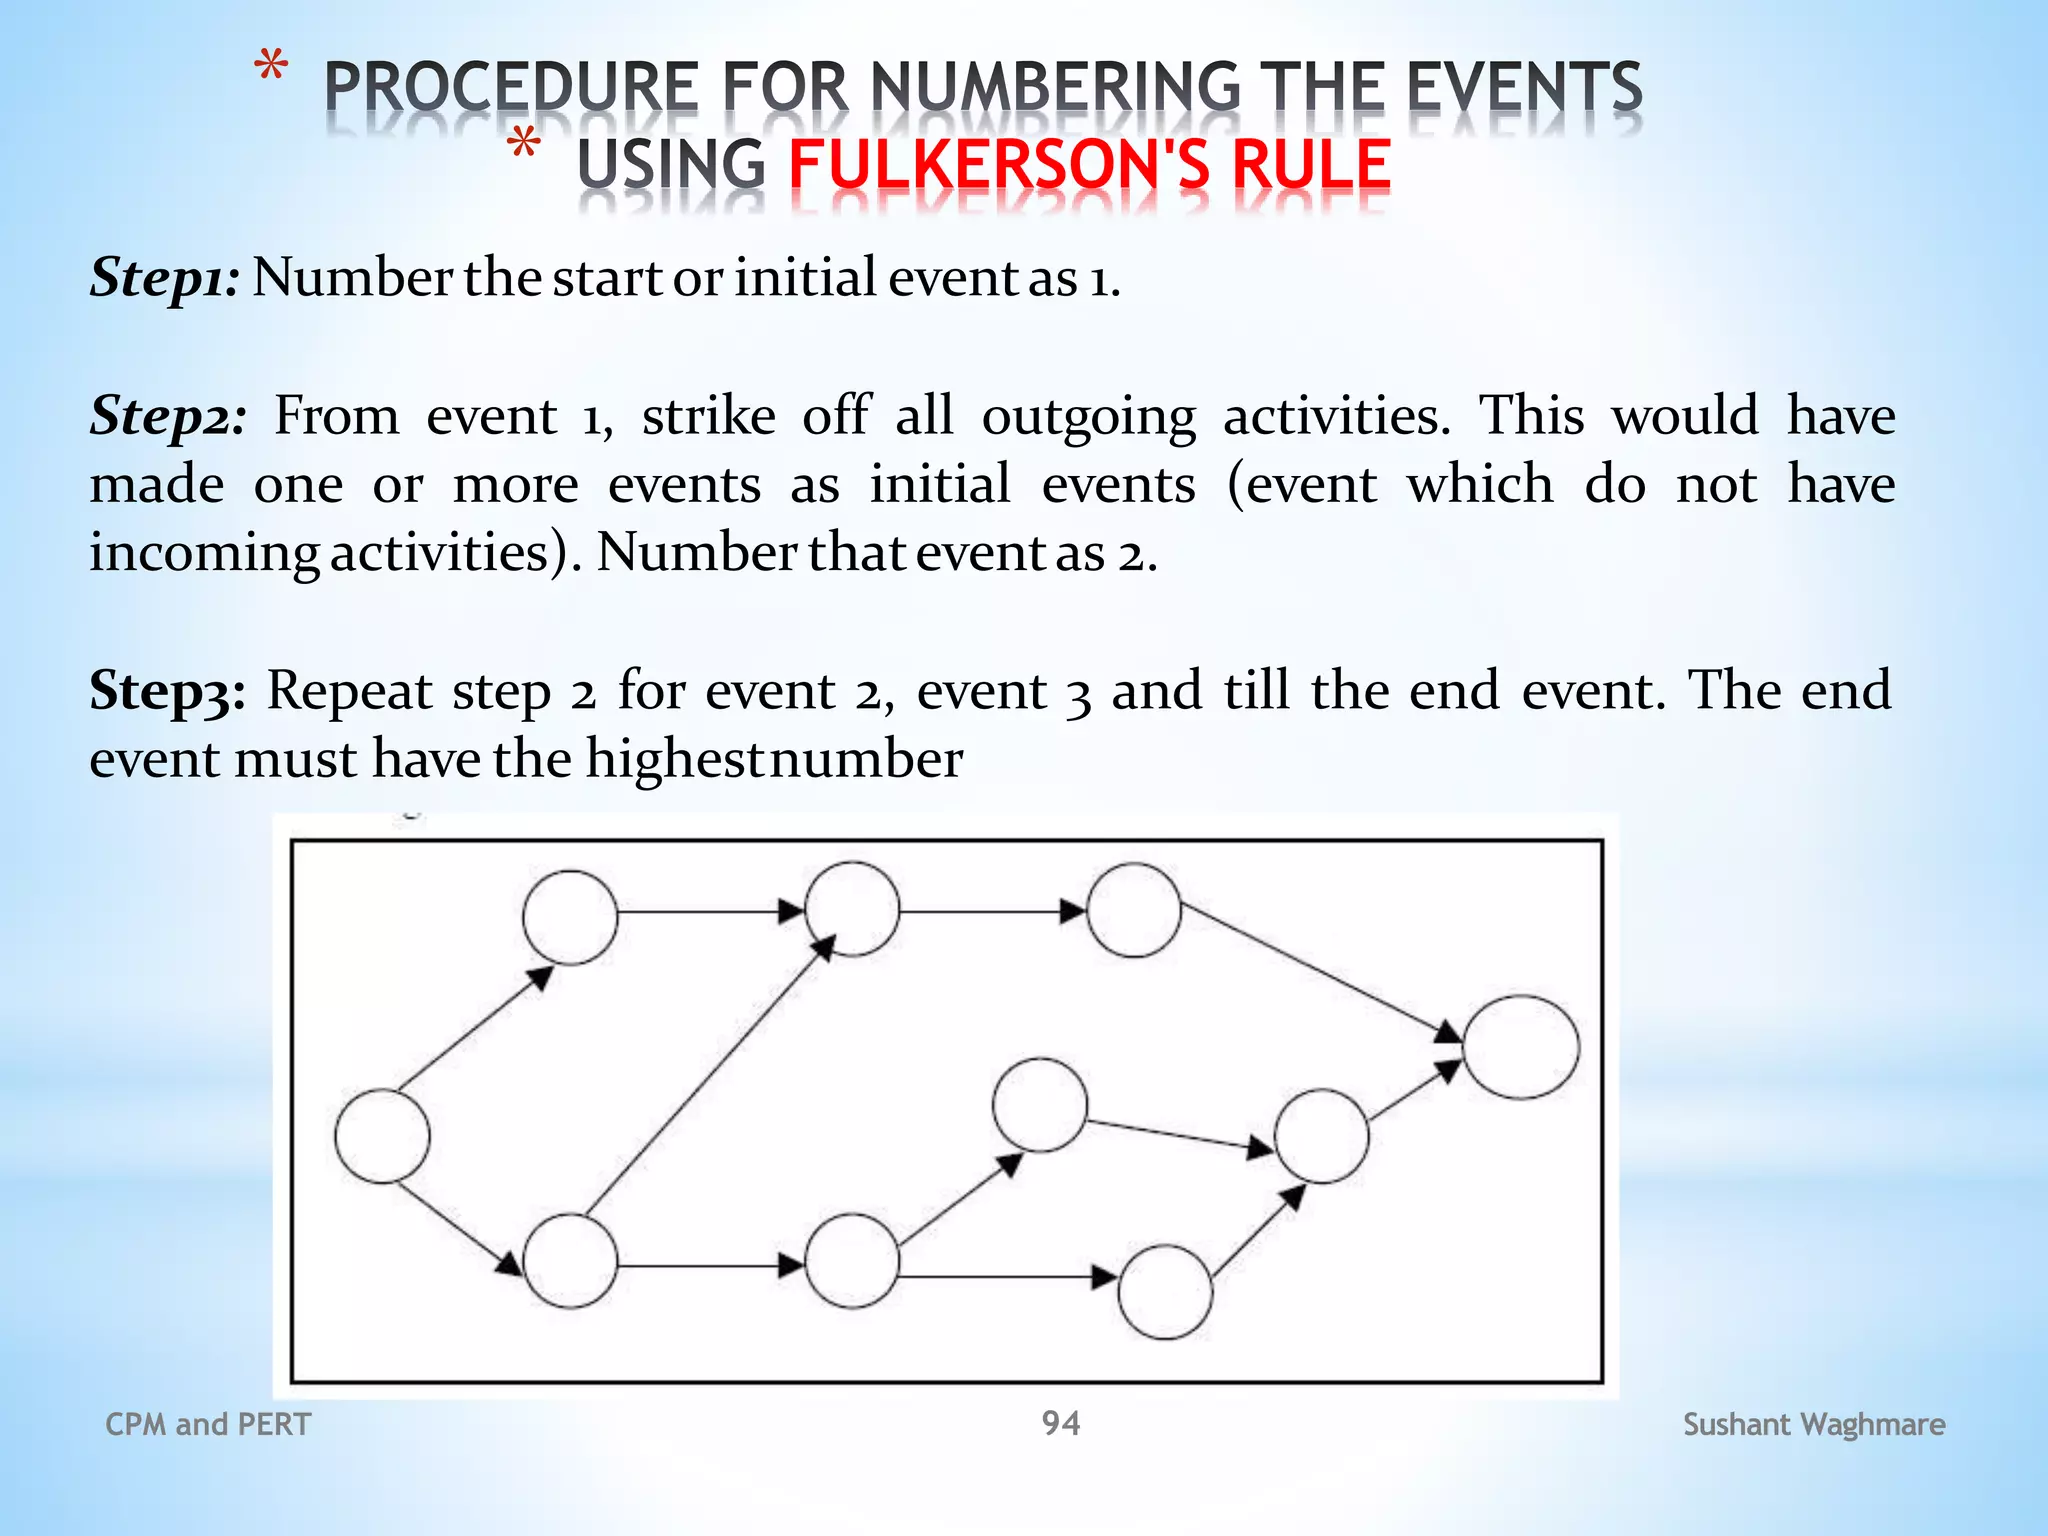
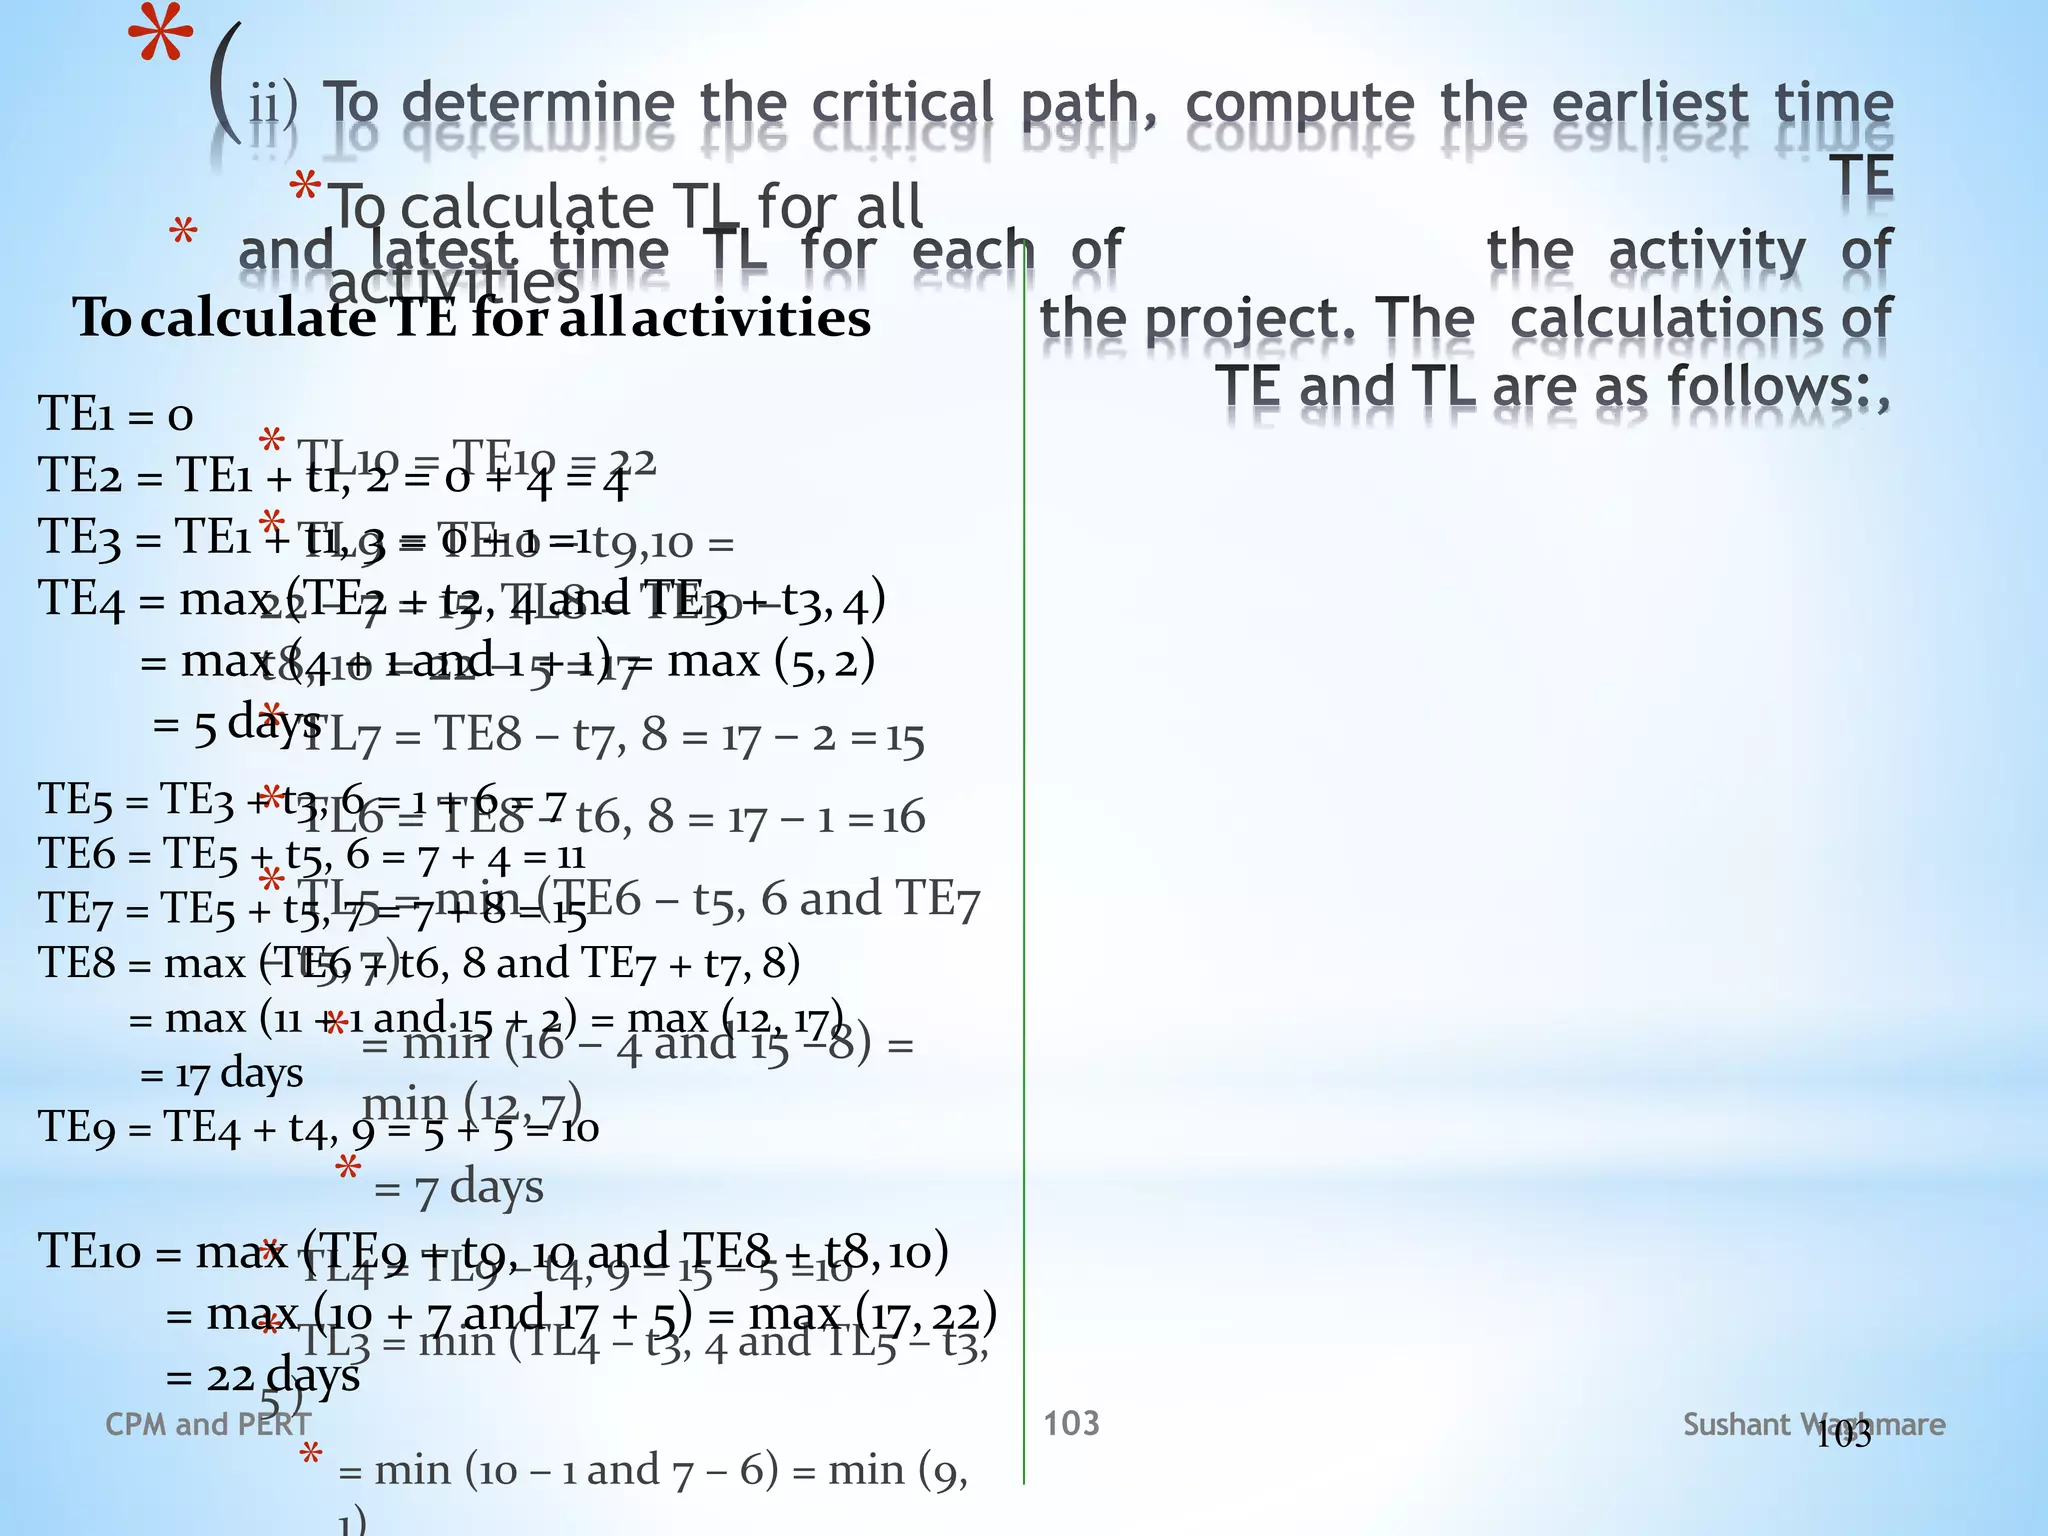
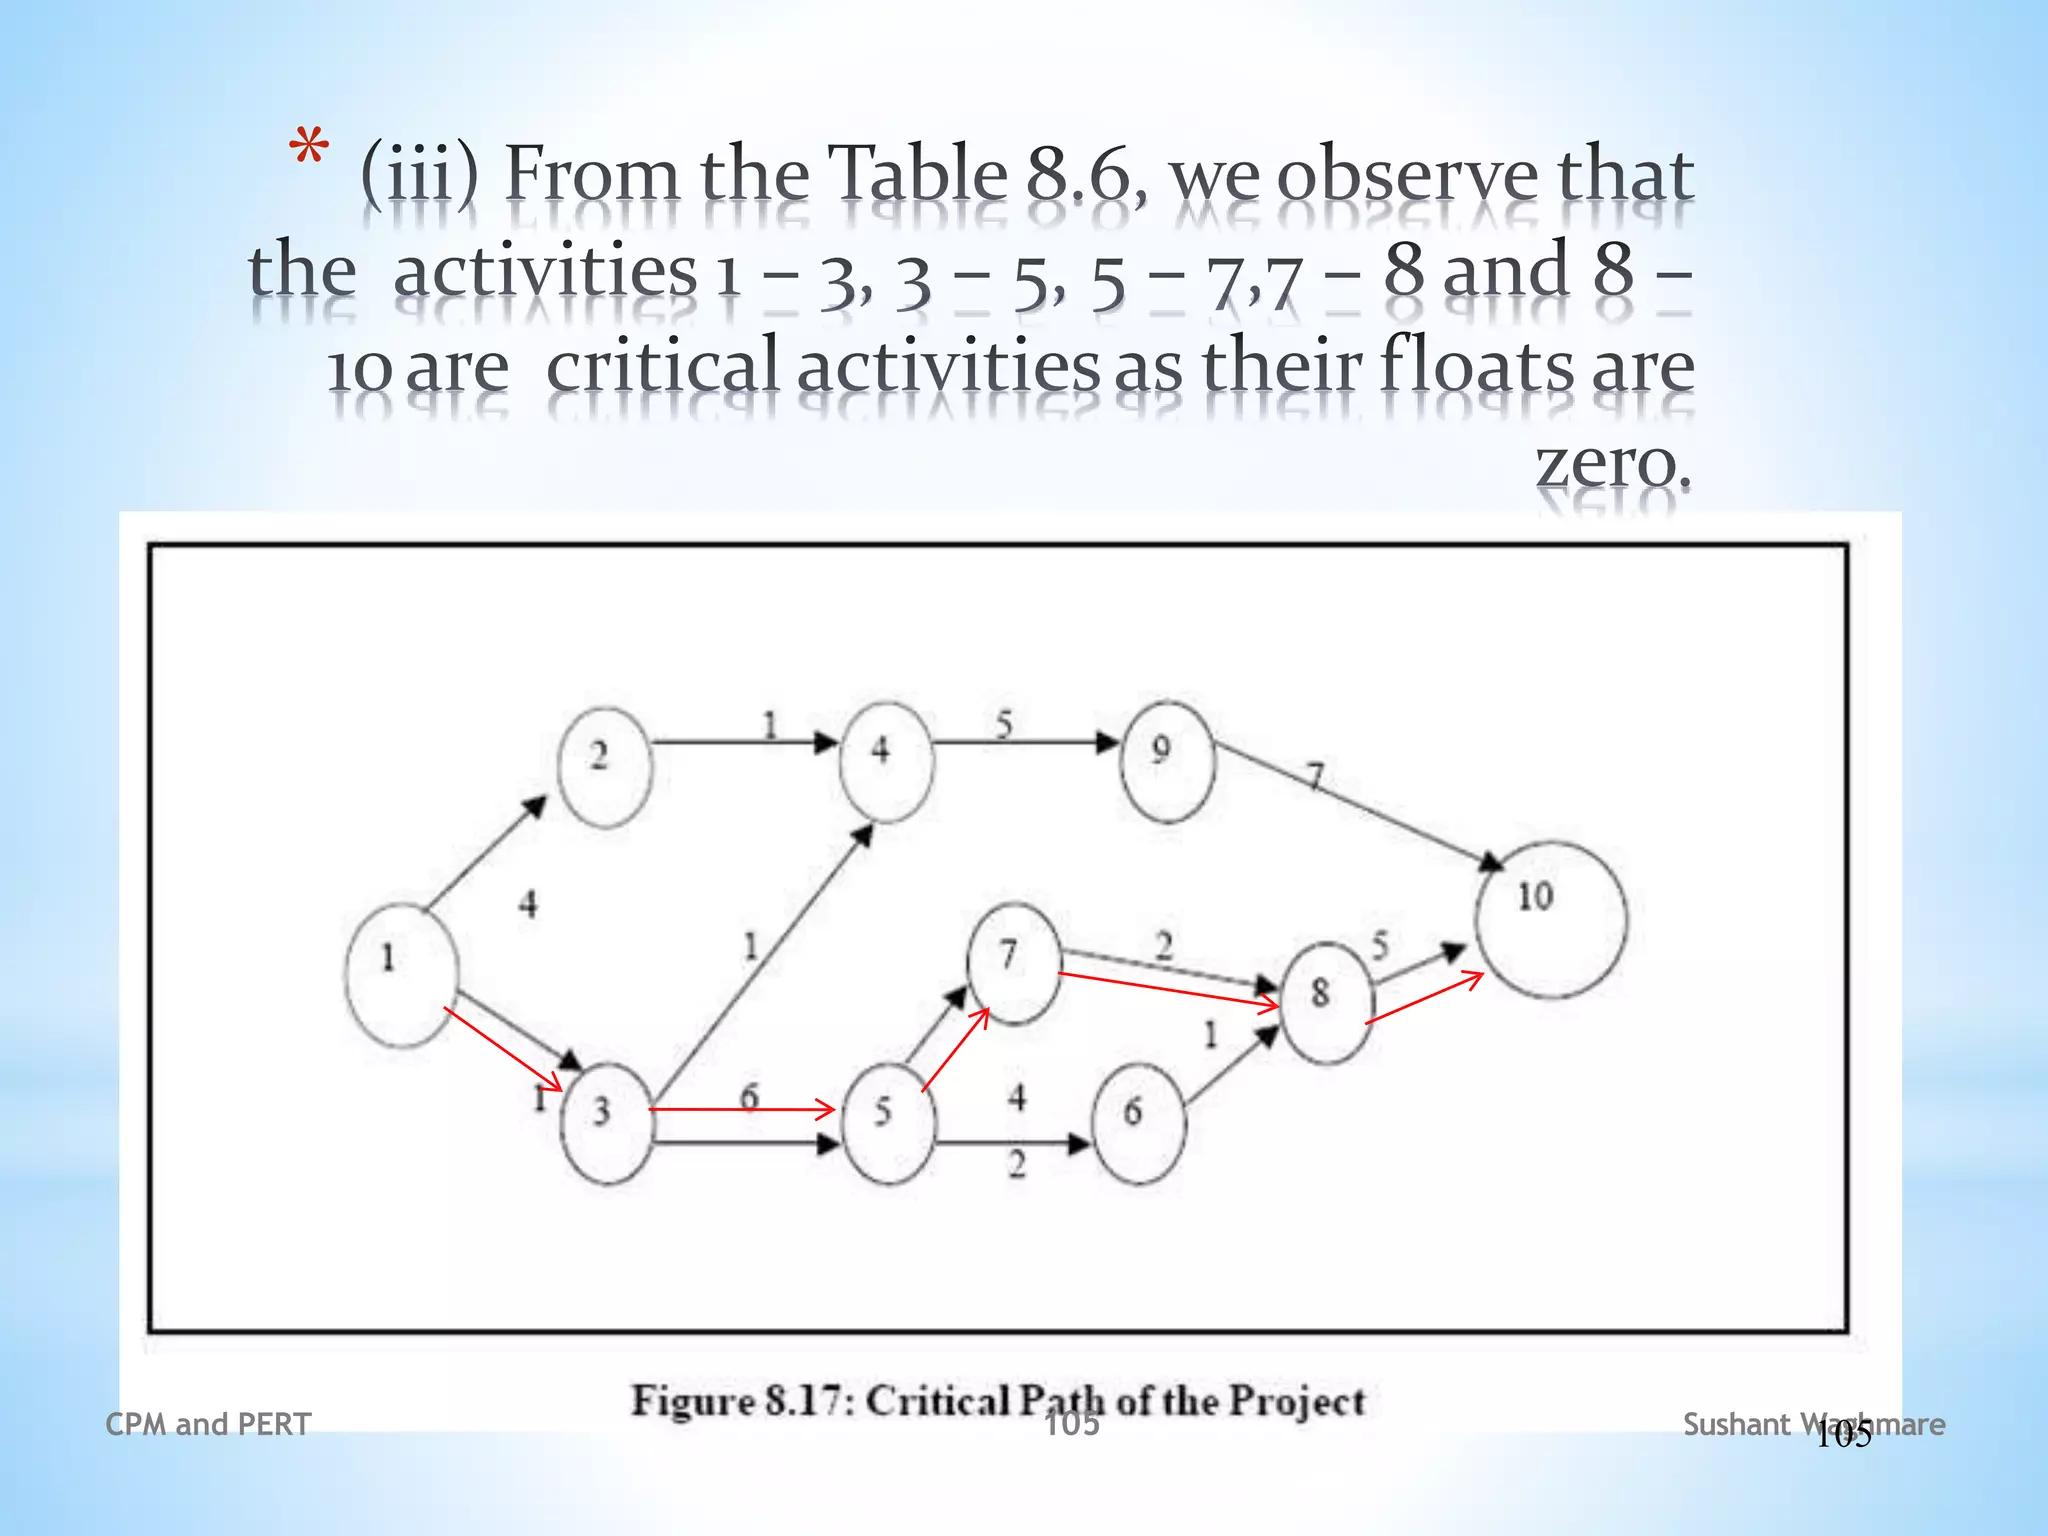
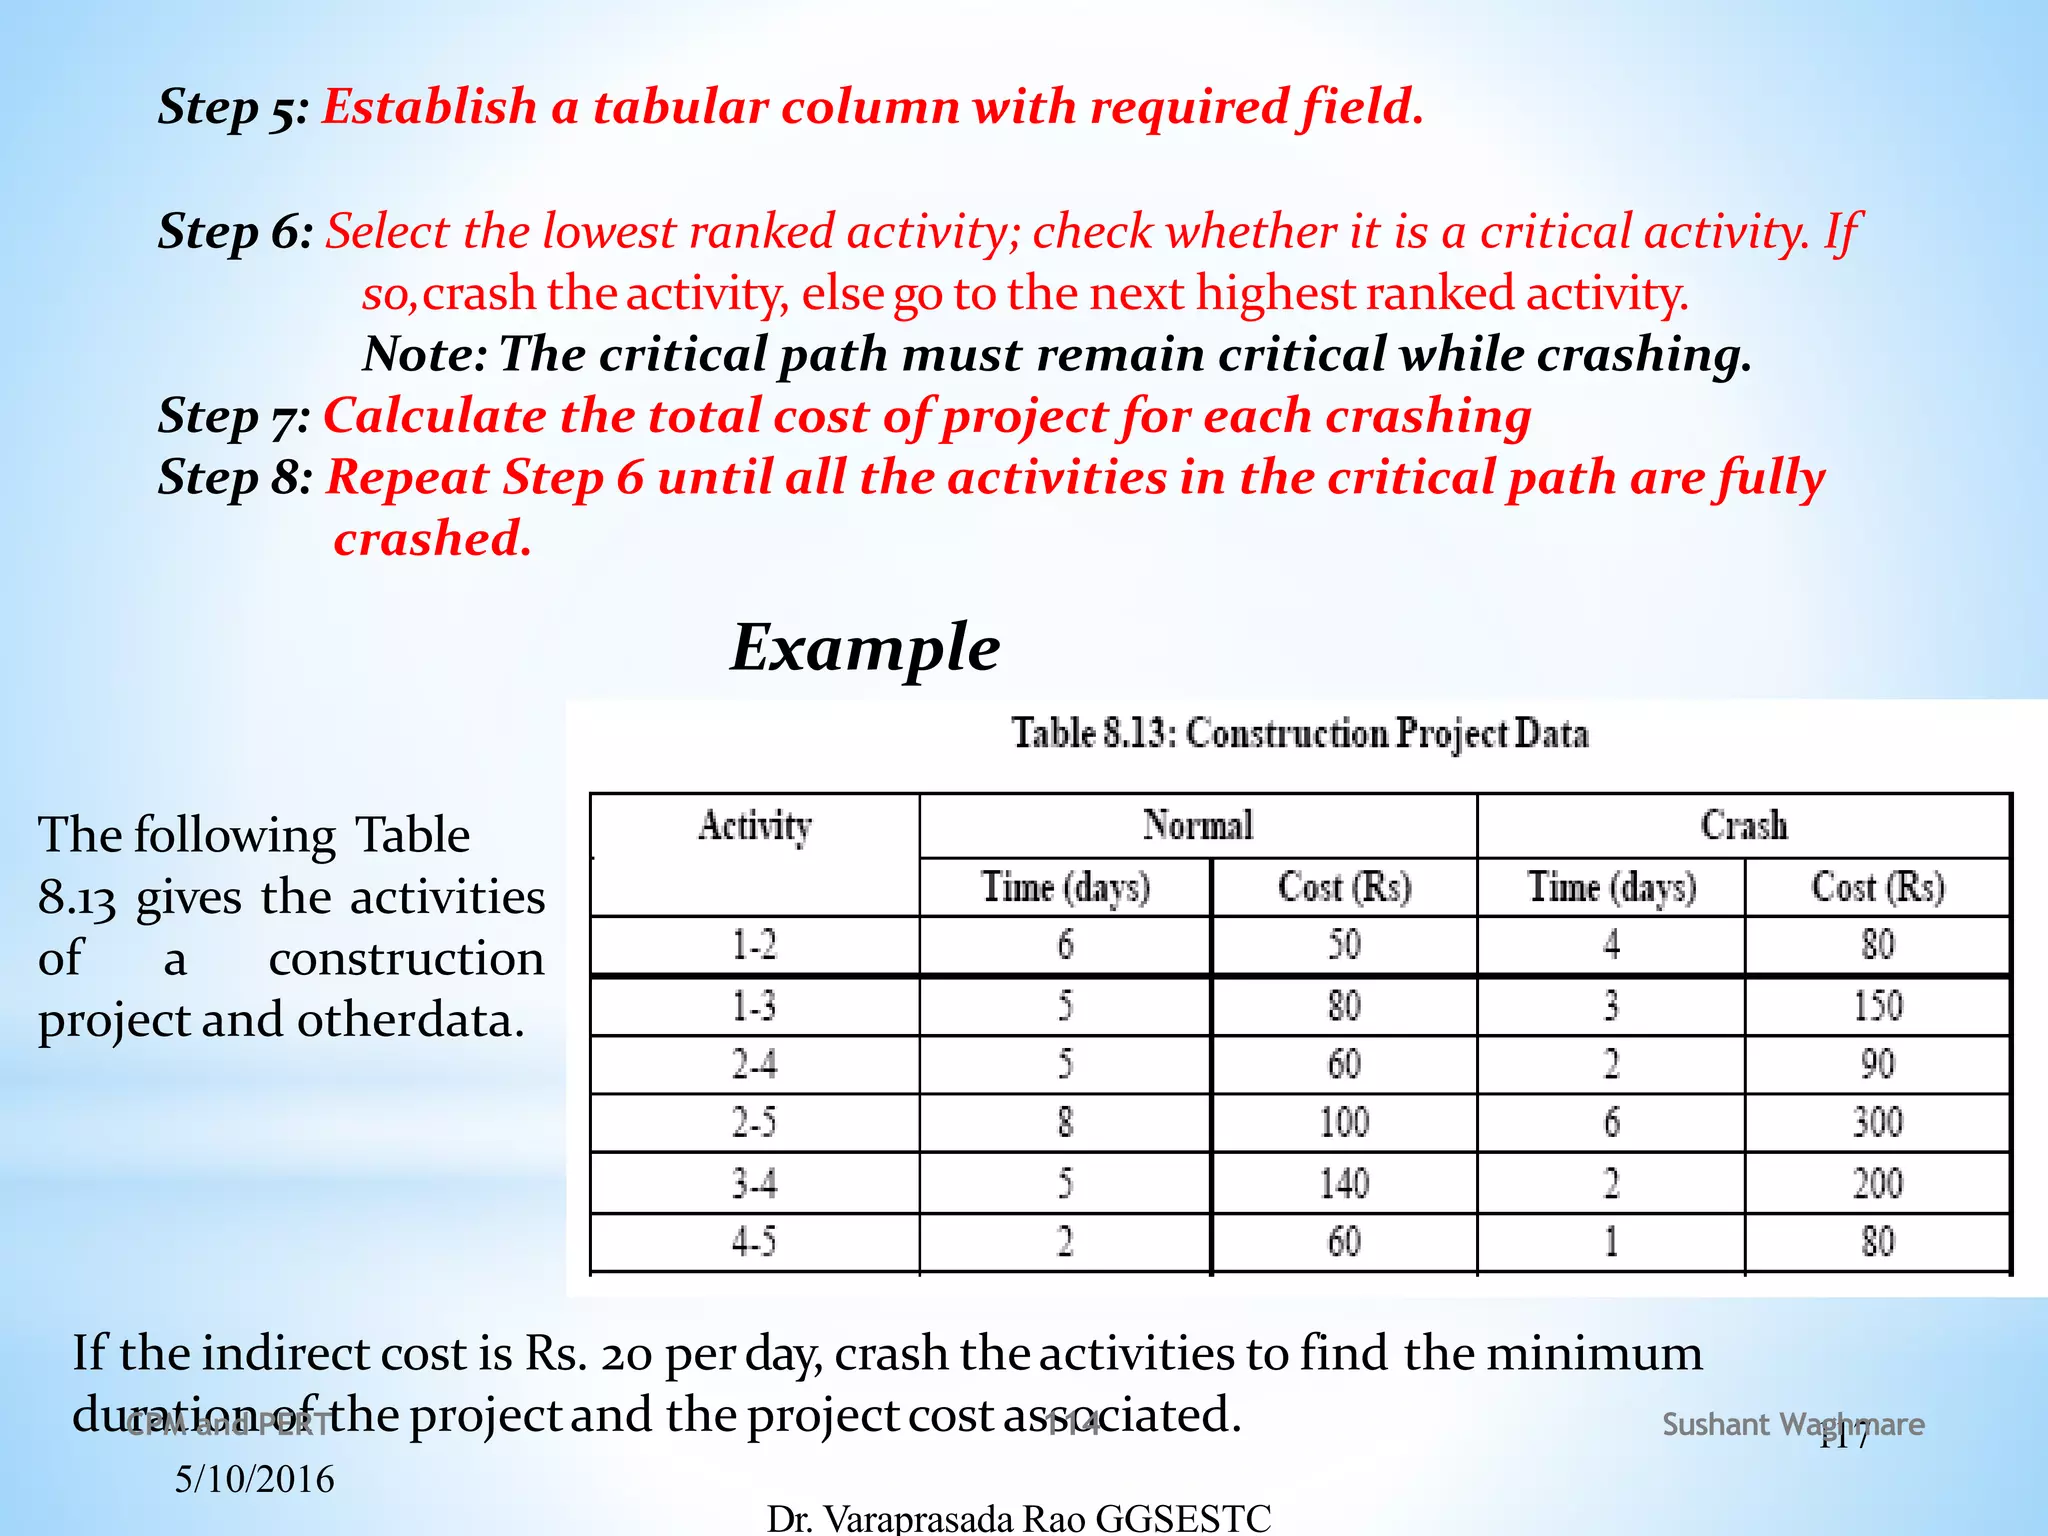
Project management techniques like CPM and PERT are used to plan and schedule projects. CPM involves creating a network diagram of all the tasks in a project with their time estimates and dependencies. The critical path is identified as the longest path through the network that determines the minimum project duration. PERT is similar but accounts for uncertainty in time estimates by using three time estimates per task - optimistic, most likely and pessimistic - to calculate the expected duration using beta distribution. Both techniques are useful for project scheduling and tracking progress against the plan.
Project planning and scheduling techniquesShivangi Saini
The document discusses various project scheduling and analysis techniques including:
- Milestone charts, task lists, Gantt charts, and network diagrams for displaying project schedules.
- Critical path analysis, critical chain analysis, PERT, and resource leveling for analyzing project schedules.
- Buffer management, crashing, fast-tracking, split-to-phases, and mainline-offline scheduling for accelerating project schedules. Each technique is briefly described along with its risks and applications.
Chapter 09 of ICT Project Management based on IOE Engineering syllabus. This chapter mainly focuses on cost and project, cost management, cost estimating and more related to cost and project. Provided by Project Management Sir of KU
GANTT charts are a type of bar chart used to illustrate project schedules. They show the start and end dates of tasks, their duration, and dependencies between tasks. To construct a GANTT chart, critical tasks are scheduled first followed by non-critical tasks within their time windows. Staff and resources are then allocated to tasks based on availability. The chart can be re-scheduled if needed due to changes in staffing or equipment availability. Project management software helps automate GANTT chart creation and resource smoothing but decisions still require human judgment.
Project Management: NETWORK ANALYSIS - CPM and PERTS.Vijaya Bhaskar
This document provides information about project management techniques including network analysis using Critical Path Method (CPM) and Program Evaluation and Review Technique (PERT). It defines what a project and network are, and describes the basic steps and concepts involved in CPM and PERT. These include drawing networks, identifying critical paths, calculating expected durations and variances of activities, and determining the probability of completing projects within given timeframes. Examples are provided to illustrate key concepts like crashing project durations and calculating associated costs. The document is intended as a teaching aid for understanding fundamental aspects of project network analysis.
This document provides an overview of project management techniques, including definitions, phases, and methods. It discusses:
1. Project management involves planning, scheduling, and controlling interrelated activities using limited resources over a defined time period.
2. Popular techniques include Critical Path Method (CPM) and Program Evaluation and Review Technique (PERT), which use network diagrams and time/resource estimates to identify critical paths and schedules.
3. Project formulation involves feasibility analysis, design, financial analysis, and cost-benefit analysis to evaluate a project idea before implementation.
The concepts and processes on how to perform project schedule management according to PMBOK Guide 6th edition. You'll find key concepts and terms, plan schedule management, define activities, sequence activities, estimate activity duration, develop schedule, and control schedule.
1) Project cost management involves estimating costs during planning, determining a budget, and controlling costs during monitoring and control.
2) Estimating costs involves developing approximations for resources needed using inputs like the scope baseline and tools like expert judgment, analogous estimates, and software. Outputs are activity cost estimates and basis of estimates documents.
3) Determining the budget aggregates estimated costs into a cost performance baseline using tools like cost aggregation, reserve analysis, and expert judgment. Outputs are the cost baseline, project funding requirements, and updates to project documents.
4) Controlling costs involves monitoring spending against the baseline using earned value management, forecasts, and variance analysis to track performance. Outputs include work performance measurements, budget forecasts, and
3. construction planning. construction project managementKabilan Kabi
This document discusses project time management for construction projects. It covers defining and sequencing activities, estimating activity durations and resources, developing a schedule, and schedule control. Key aspects include identifying specific schedule activities and their dependencies; estimating time, resources, and durations for each activity; analyzing the activity sequences and constraints to create a project schedule; and controlling changes to the schedule. The goal is to ensure timely completion of the project through effective planning, scheduling, tracking, and control of the time management processes.
Feedback from the survey undertaken by the attendees
The attendees at each table were provided with a topic related to Project Planning, Scheduling, Monitoring & Control and were asked to list their top 5 ‘good practice’ lessons learned.
Topics: Planning, Change Management, Reporting, Scope, Schedule Management, Risk Management
Change Management 1. Early stakeholder engagement 2. Configuration Control 3. Analyse impacts 4. Risk Management 5. Leadership 6. Evaluation / lessons learned 7. Cost control
1) PERT and CPM are network analysis techniques used to schedule, coordinate, and control complex projects. They analyze the tasks involved in a project and their interdependencies to estimate project duration and identify the critical path.
2) The document discusses key aspects of PERT and CPM including activity networks, time estimates, critical path identification, and slack calculations. It also provides an example of applying PERT/CPM to schedule a construction project.
3) PERT and CPM both help answer questions about project completion date, start/finish times of tasks, critical tasks, and float or slack times. The example project demonstrates how its network diagram can be used to determine a 44-week schedule with identified
COST AND TIME CONTROL OF CONSTRUCTION PROJECTS_TKAJTapesh Ajmera
This document discusses factors that inhibit effective cost and time control on construction projects and measures to mitigate them. It identifies common issues like design changes, risks and uncertainties, inaccurate project duration estimates, complex work, and non-performing subcontractors. For each issue, it provides examples of preventive, predictive, corrective, and organizational measures that can be implemented. For instance, to address inaccurate estimates, it suggests preparing schedules using experienced planners with construction knowledge rather than relying on gut feelings. The document aims to help improve project cost and schedule performance through better risk management and control practices.
CPM and PERT are project management techniques that use network diagrams to analyze the tasks, schedule, and dependencies of a project. They determine the critical path, which is the longest sequence of tasks that determines the minimum time to complete the project. PERT further accounts for uncertainty in task durations by using three time estimates to calculate the expected duration and variance for each task. This allows calculating the probability of completing the project by a given date.
The document provides information on project scheduling techniques including work breakdown structure (WBS), bar charts, networks, program evaluation and review technique (PERT), and critical path method (CPM). It discusses how these techniques are used to plan, schedule, and manage projects from initiation through completion. The techniques allow visualization of project activities and their logical relationships to identify critical paths and float.
This document discusses the significance and uses of S-curves in project management. It begins by defining an S-curve as a graph that tracks project metrics like cost, hours, or deliverables against time. It then describes the different types of S-curves including target, cost, hours, baseline, and actual curves. Finally, it outlines several ways S-curves can help interpret a project's health, such as evaluating progress, forecasting cash flow, comparing outputs to plans, and determining growth or slippage from the baseline.
This document provides information about critical path method (CPM) including:
- An introduction to CPM and examples of projects where it can be applied.
- The differences between CPM and PERT.
- Key terms and definitions used in CPM like activity times, floats, and critical path.
- An example of calculating event times, activity times, floats, and determining the critical path for a sample CPM network diagram.
The document discusses project planning and control, covering what a project is, the stages of project management, and network planning using the Critical Path Method (CPM). It describes the five stages of project management as understanding the project environment, defining the project, planning the project, technical execution, and project control. Project planning determines the cost, duration, resource needs, and helps allocate work and monitor progress. The CPM represents activities diagrammatically and identifies the critical path which determines the minimum project duration.
This document provides information on the project management techniques of PERT and CPM. It defines PERT as dealing with uncertain project activities, using three time estimates and a probabilistic model. CPM is described as handling well-defined activities with fixed durations, using a deterministic model and focusing on time-cost tradeoffs. The document also outlines key elements of each technique such as events and activities, the critical path, and float.
PERT and CPM are techniques used in project network analysis for planning, management, and control of projects. PERT uses probabilistic time estimates and is used for non-repetitive projects with uncertain timelines, while CPM uses deterministic single estimates and is used for repetitive jobs with past experience to predict times. Both techniques involve modeling the project as a network of activities and events, identifying the critical path of zero slack activities that dictates the minimum project duration.
PERT and CPM are project management tools used to schedule, organize, and coordinate tasks within a project. PERT was developed for uncertain schedules and uses three time estimates, while CPM uses known times. Both tools involve identifying tasks, estimating durations, and displaying the tasks in a network diagram to identify the critical path of interdependent activities. This helps project managers monitor progress and ensure projects are completed on time, within budget, and to quality standards.
PERT (Program Evaluation and Review Technique) is a project management tool developed by the US Navy to analyze complex projects by breaking them into tasks, estimating activity times, and identifying the critical path of tasks. It facilitates decision making by determining the earliest and latest start/finish times and calculating slack time to reduce project time and costs. PERT uses a network diagram and beta distribution to model activity times and account for uncertainty in complex, non-routine projects.
The document provides an overview of key components for an effective project charter, including objectives, scope, deliverables, timelines, budgets, resources, risks, and measures of success. An effective charter clearly defines the project goals, how it fits strategically, what work will be done, when it will be completed, who will work on it, potential challenges, and how success will be determined. The charter establishes a shared understanding and provides essential information to ensure project alignment, buy-in, and successful delivery.
This document discusses project management techniques for managing the triple constraints of scope, time, and cost on projects. It defines key terms for scope, time, and cost management and describes tools and techniques for planning, controlling, and completing each area successfully. These include work breakdown structures, Gantt charts, estimating techniques like analogous and parametric estimating, variance analysis, and change control systems. The goal is to incorporate these techniques to deliver projects on budget, on schedule, and according to defined objectives and requirements.
The ninth lesson of the course on Planning and Managing Software projects (http://emanueledellavalle.org/Teaching/PMSP-2011-12.html) that I give at Politecnico di Milano
The concepts and processes on how to perform project cost management according to PMBOK Guide 6th edition. You'll find key concepts and terms, plan cost management, estimate costs, determine budget, and control cost.
The document provides an introduction to Primavera, a project planning and scheduling software. It defines key concepts such as activities, relationships, floats, critical paths, and resources. It also describes the basic terminology used in Primavera including activity types, calendars, constraints, cost tracking, and work breakdown structures. The document aims to familiarize users with the basic features and terminology of Primavera to help plan, schedule and monitor projects.
Project Management Techniques ( CPM & PERT Techniques )
A revised PPT from other shared PPT available
Project management is a scientific way of planning, implementing, monitoring & controlling the various aspects of a project such as time, money, materials, manpower & other resources.
By,
Mr. AKARESH JOSE
Kerala Agricultural University
akareshjose@gmail.com
The document discusses key concepts in Oracle's Primavera P6 project management software. It describes the enterprise project structure (EPS) which represents the hierarchical structure of projects in the database. It also discusses organizational breakdown structures (OBS), calendars, activity types, relationships between activities, resources, constraints, work breakdown structures (WBS), and user defined fields.
This document provides an overview of network models and summarizes key concepts related to PERT and CPM techniques. Some key points:
- Network models consist of nodes and connecting lines that can be used to model a variety of problems. PERT and CPM are two widely used network techniques.
- PERT was developed for project planning under uncertainty. CPM focuses on tradeoffs between time and cost. Both use the same calculations but differ in time estimation approaches.
- Critical paths identify the minimum time needed to complete a project. Activities on the critical path must be carefully managed to avoid delays. Non-critical activities have slack time and can be delayed without impacting the project completion date.
This document provides an introduction to project management techniques PERT and CPM. It defines key concepts like activities, events, nodes, dummy activities and paths in a network diagram. It explains the stages of project management including planning, appraisal, implementation and review/control. The document outlines the steps to determine critical path in CPM and describes crashing a project to reduce duration. It compares PERT and CPM, noting PERT uses 3 time estimates and is probabilistic while CPM uses one estimate and focuses on tradeoffs between time and cost.
The document provides an overview of critical path method (CPM) and program evaluation and review technique (PERT) network analysis techniques. It defines CPM and PERT, explaining that CPM is used for projects with known activity times and deterministic models, while PERT is for uncertain activity times and probabilistic models. The key aspects of developing a network are described, including defining the project, determining activity relationships and time estimates, and identifying the critical path which determines the project duration. The differences between CPM and PERT are that PERT is for non-repetitive first projects while CPM is for repetitive projects with prior experience to estimate activity times.
The document discusses project scheduling and network analysis techniques. It defines key concepts like activities, precedence relationships, critical paths, slack, and provides examples of developing network diagrams using both activity-on-node and activity-on-arrow approaches. The document also explains how to perform forward and backward passes to calculate early and late start/finish times and determine which paths and activities are critical.
This document provides an overview of CPM (Critical Path Method) and PERT (Project Evaluation and Review Technique) techniques for project scheduling. Both methods use network diagrams to visually map out the sequence and dependencies of project activities. The key difference is that CPM uses single time estimates while PERT uses three time estimates and probability theory. The document outlines the basic steps and concepts for developing network diagrams and calculating the critical path of activities that determine the minimum project duration.
The document discusses network analysis and the critical path method (CPM). It explains that CPM can be used to determine the minimum time required to complete a project if activity durations are known. CPM was developed in the 1950s by researchers at DuPont and Sperry Rand. It also discusses the Program Evaluation and Review Technique (PERT) which can estimate project completion probabilities when durations are uncertain. Both CPM and PERT helped reduce the Polaris missile development time. The document provides examples of CPM and PERT applications and rules for constructing a project network diagram.
This document discusses network planning techniques for project management. It introduces Critical Path Method (CPM) and Program Evaluation and Review Technique (PERT). CPM and PERT involve identifying project activities, determining the sequence and dependencies between activities, estimating activity times, and identifying the critical path of activities with zero slack time. PERT differs from CPM in that it uses three time estimates per activity - optimistic, most likely, and pessimistic - to determine the expected time using a formula. The document provides examples and guidelines for constructing network diagrams to model project schedules and dependencies between activities.
This document discusses project management techniques CPM and PERT. It begins by defining a project and project management. It then covers network planning methods including CPM and PERT. The key steps in both are described as defining the project, diagramming the network, estimating times, and monitoring progress. Time estimates in CPM use fixed durations while PERT uses optimistic, most likely, and pessimistic estimates. The document provides examples and differences between the two techniques.
This document discusses project management techniques CPM and PERT. It begins by introducing network planning methods for managing projects, which involve describing the project, diagramming the network, estimating completion times, and monitoring progress. It then explains how to create network diagrams using the activity-on-arc and activity-on-node approaches. Next, it covers estimating activity times and identifying critical paths using forward and backward passes. The document concludes by defining CPM and PERT, outlining their steps, and noting their differences and limitations.
PM 2 is directing a team of research scientists running trials on a new analgesic drug. Their responsibility is to design experiments, follow scientific and legal procedures, and have results analyzed independently.
PM 3 is being sent to New Delhi by an international aid agency to organize introducing multimedia resources at a teachers' college. Their role is complex, ensuring appropriate resources are purchased and developed within the college, and encouraging acceptance by lecturers and students.
PM 1 is in charge of constructing a retail development with 26 units and a supermarket. Their main responsibilities are coordinating contractors to complete the project on specification, within budget and on time.
The document discusses various network scheduling techniques used for project management including Gantt charts, PERT, CPM, and precedence diagramming. It focuses on describing the Program Evaluation and Review Technique (PERT) which is a management tool used to analyze time and resource requirements of projects. PERT involves identifying all tasks, determining their sequence and interdependencies, and estimating time durations to identify the critical path and assess project deadline risks. Key aspects of PERT include event-based networks, three-point estimates for activity durations, and computation of slack times.
The document discusses three examples of project managers and their responsibilities on different projects:
1) Construction of a retail development with 26 units and a supermarket. Responsible for coordinating contractors to ensure on-time and on-budget completion.
2) Directing trials of a new analgesic drug. Responsible for designing experiments and ensuring proper scientific and legal procedures are followed.
3) Introducing multimedia resources at a teacher training college in New Delhi. Responsible for purchasing and developing resources as well as encouraging acceptance by lecturers and students.
This document provides an overview of critical path method (CPM) and program evaluation and review technique (PERT) project management tools. It discusses how CPM and PERT are used to plan network diagrams, estimate activity times, and identify critical paths. Key steps include describing the project, diagramming activities and relationships, calculating earliest and latest start/finish times, and monitoring progress. PERT additionally considers optimistic, most likely, and pessimistic time estimates to determine expected durations. Both tools help schedule projects and identify activities that could impact completion dates.
This document discusses time scheduling and network analysis techniques used in civil engineering projects. It introduces critical path method (CPM) and program evaluation and review technique (PERT) for scheduling project activities and calculating completion times. CPM uses deterministic time estimates for each activity, while PERT allows for probabilistic activity times. The document outlines the key steps for constructing a network diagram, including representing activities as arrows and events as nodes. It also discusses rules for drawing network diagrams and different types of charts used in scheduling like Gantt, bar and milestone charts.
This document discusses time management techniques for project management. It begins by explaining that accurately scheduling a project is important for predicting time and costs. It then discusses various project planning phases such as defining objectives, work breakdown structures, precedence relationships between activities, and modeling these relationships in a network diagram. The document also covers critical path method (CPM) and program evaluation and review technique (PERT) analyses, which are used to estimate activity times and determine the critical path and project duration.
project management-cpm and pert methods for managersNaganna Chetty
A project is a one shot, time limited, goal directed, major undertaking, requiring the commitment of varied skills & resources.
A project:
Has a unique purpose.
Is temporary.
Is developed using progressive elaboration.
Requires resources, often from various areas.
Should have a primary customer or sponsor.
The project sponsor usually provides the direction and funding for the project.
Involves uncertainty.
Project managers work with project sponsors, project teams, and other people involved in projects to meet project goals.
Program: “A group of related projects managed in a coordinated way to obtain benefits and control not available from managing them individually.”
Program managers oversee programs and often act as bosses for project managers.
Project management is “the application of knowledge, skills, tools and techniques to project activities to meet project requirements.”
The document discusses project scheduling techniques. It describes the key elements of project scheduling including Gantt charts, PERT, and CPM. These techniques are used to plan project activities, allocate resources, track progress, and identify critical paths. The document also provides examples of network diagrams and guidelines for constructing them. Project scheduling helps project managers communicate work requirements and ensure projects are completed on time and within budget.
Critical Path Method, or CPM, is a project modeling technique that helps project managers plan, schedule, and execute their projects effectively. It pinpoints the crucial tasks — the ones that, if delayed, would push back the project's entire timeline.
Introduction
CPM/PERT or Network Analysis as the technique is sometimes called, developed along two parallel streams, one industrial and the other military.
CPM (Critical Path Method) was the discovery of M.R.Walker of E.I.Du Pont de Nemours & Co. and J.E.Kelly of Remington Rand, circa 1957. The computation was designed for the UNIVAC-I computer. The first test was made in 1958, when CPM was applied to the construction of a new chemical plant. In March 1959, the method was applied to maintenance shut-down at the Du Pont works in Louisville, Kentucky. Unproductive time was reduced from 125 to 93 hours.
PERT (Project Evaluation and Review Technique) was devised in 1958 for the POLARIS missile program by the Program Evaluation Branch of the Special Projects office of the U.S.Navy, helped by the Lockheed Missile Systems division and the Consultant firm of Booz-Allen & Hamilton. The calculations were so arranged so that they could be carried out on the IBM Naval Ordinance Research Computer (NORC) at Dahlgren, Virginia.
KuberTENes Birthday Bash Guadalajara - K8sGPT first impressionsVictor Morales
K8sGPT is a tool that analyzes and diagnoses Kubernetes clusters. This presentation was used to share the requirements and dependencies to deploy K8sGPT in a local environment.
Introduction- e - waste – definition - sources of e-waste– hazardous substances in e-waste - effects of e-waste on environment and human health- need for e-waste management– e-waste handling rules - waste minimization techniques for managing e-waste – recycling of e-waste - disposal treatment methods of e- waste – mechanism of extraction of precious metal from leaching solution-global Scenario of E-waste – E-waste in India- case studies.
ACEP Magazine edition 4th launched on 05.06.2024Rahul
This document provides information about the third edition of the magazine "Sthapatya" published by the Association of Civil Engineers (Practicing) Aurangabad. It includes messages from current and past presidents of ACEP, memories and photos from past ACEP events, information on life time achievement awards given by ACEP, and a technical article on concrete maintenance, repairs and strengthening. The document highlights activities of ACEP and provides a technical educational article for members.
A review on techniques and modelling methodologies used for checking electrom...nooriasukmaningtyas
The proper function of the integrated circuit (IC) in an inhibiting electromagnetic environment has always been a serious concern throughout the decades of revolution in the world of electronics, from disjunct devices to today’s integrated circuit technology, where billions of transistors are combined on a single chip. The automotive industry and smart vehicles in particular, are confronting design issues such as being prone to electromagnetic interference (EMI). Electronic control devices calculate incorrect outputs because of EMI and sensors give misleading values which can prove fatal in case of automotives. In this paper, the authors have non exhaustively tried to review research work concerned with the investigation of EMI in ICs and prediction of this EMI using various modelling methodologies and measurement setups.
Electric vehicle and photovoltaic advanced roles in enhancing the financial p...IJECEIAES
Climate change's impact on the planet forced the United Nations and governments to promote green energies and electric transportation. The deployments of photovoltaic (PV) and electric vehicle (EV) systems gained stronger momentum due to their numerous advantages over fossil fuel types. The advantages go beyond sustainability to reach financial support and stability. The work in this paper introduces the hybrid system between PV and EV to support industrial and commercial plants. This paper covers the theoretical framework of the proposed hybrid system including the required equation to complete the cost analysis when PV and EV are present. In addition, the proposed design diagram which sets the priorities and requirements of the system is presented. The proposed approach allows setup to advance their power stability, especially during power outages. The presented information supports researchers and plant owners to complete the necessary analysis while promoting the deployment of clean energy. The result of a case study that represents a dairy milk farmer supports the theoretical works and highlights its advanced benefits to existing plants. The short return on investment of the proposed approach supports the paper's novelty approach for the sustainable electrical system. In addition, the proposed system allows for an isolated power setup without the need for a transmission line which enhances the safety of the electrical network
A SYSTEMATIC RISK ASSESSMENT APPROACH FOR SECURING THE SMART IRRIGATION SYSTEMSIJNSA Journal
The smart irrigation system represents an innovative approach to optimize water usage in agricultural and landscaping practices. The integration of cutting-edge technologies, including sensors, actuators, and data analysis, empowers this system to provide accurate monitoring and control of irrigation processes by leveraging real-time environmental conditions. The main objective of a smart irrigation system is to optimize water efficiency, minimize expenses, and foster the adoption of sustainable water management methods. This paper conducts a systematic risk assessment by exploring the key components/assets and their functionalities in the smart irrigation system. The crucial role of sensors in gathering data on soil moisture, weather patterns, and plant well-being is emphasized in this system. These sensors enable intelligent decision-making in irrigation scheduling and water distribution, leading to enhanced water efficiency and sustainable water management practices. Actuators enable automated control of irrigation devices, ensuring precise and targeted water delivery to plants. Additionally, the paper addresses the potential threat and vulnerabilities associated with smart irrigation systems. It discusses limitations of the system, such as power constraints and computational capabilities, and calculates the potential security risks. The paper suggests possible risk treatment methods for effective secure system operation. In conclusion, the paper emphasizes the significant benefits of implementing smart irrigation systems, including improved water conservation, increased crop yield, and reduced environmental impact. Additionally, based on the security analysis conducted, the paper recommends the implementation of countermeasures and security approaches to address vulnerabilities and ensure the integrity and reliability of the system. By incorporating these measures, smart irrigation technology can revolutionize water management practices in agriculture, promoting sustainability, resource efficiency, and safeguarding against potential security threats.
International Conference on NLP, Artificial Intelligence, Machine Learning an...gerogepatton
International Conference on NLP, Artificial Intelligence, Machine Learning and Applications (NLAIM 2024) offers a premier global platform for exchanging insights and findings in the theory, methodology, and applications of NLP, Artificial Intelligence, Machine Learning, and their applications. The conference seeks substantial contributions across all key domains of NLP, Artificial Intelligence, Machine Learning, and their practical applications, aiming to foster both theoretical advancements and real-world implementations. With a focus on facilitating collaboration between researchers and practitioners from academia and industry, the conference serves as a nexus for sharing the latest developments in the field.
CHINA’S GEO-ECONOMIC OUTREACH IN CENTRAL ASIAN COUNTRIES AND FUTURE PROSPECTjpsjournal1
The rivalry between prominent international actors for dominance over Central Asia's hydrocarbon
reserves and the ancient silk trade route, along with China's diplomatic endeavours in the area, has been
referred to as the "New Great Game." This research centres on the power struggle, considering
geopolitical, geostrategic, and geoeconomic variables. Topics including trade, political hegemony, oil
politics, and conventional and nontraditional security are all explored and explained by the researcher.
Using Mackinder's Heartland, Spykman Rimland, and Hegemonic Stability theories, examines China's role
in Central Asia. This study adheres to the empirical epistemological method and has taken care of
objectivity. This study analyze primary and secondary research documents critically to elaborate role of
china’s geo economic outreach in central Asian countries and its future prospect. China is thriving in trade,
pipeline politics, and winning states, according to this study, thanks to important instruments like the
Shanghai Cooperation Organisation and the Belt and Road Economic Initiative. According to this study,
China is seeing significant success in commerce, pipeline politics, and gaining influence on other
governments. This success may be attributed to the effective utilisation of key tools such as the Shanghai
Cooperation Organisation and the Belt and Road Economic Initiative.
Literature Review Basics and Understanding Reference Management.pptxDr Ramhari Poudyal
Three-day training on academic research focuses on analytical tools at United Technical College, supported by the University Grant Commission, Nepal. 24-26 May 2024
Harnessing WebAssembly for Real-time Stateless Streaming PipelinesChristina Lin
Traditionally, dealing with real-time data pipelines has involved significant overhead, even for straightforward tasks like data transformation or masking. However, in this talk, we’ll venture into the dynamic realm of WebAssembly (WASM) and discover how it can revolutionize the creation of stateless streaming pipelines within a Kafka (Redpanda) broker. These pipelines are adept at managing low-latency, high-data-volume scenarios.
2. A project is an endeavour involving a connected sequence of
activities and a range of resources, which is designed to achieve a
specific outcome and which operates within a time frame, cost and
quality constraints and which is often used to introduce change.
Characteristic of a project
A unique, one-time operational activity or effort
Requires the completion of a large number of
interrelated activities
Established to achieve specific objective
Resources, such as time and/or money, are limited
Typically has its own management structure
Need leadership
Sushant Waghmare
CPM and PERT 2
*Project
3. Sushant Waghmare
CPM and PERT 3
*Examples
– constructing houses, factories, shopping malls,
athletic stadiums or arenas
– developing military weapons systems, aircrafts,
new ships
– launching satellite systems
– constructing oil pipelines
– developing and implementing new computer
systems
– planning concert, football games, or basketball
tournaments
– introducing new products into market
4. • The application of a collection of tools and techniques to direct
the use of diverse resources towards the accomplishment of a
unique, complex, one time task within time, cost and quality
constraints.
• Its origins lie in World War II, when the military
authorities used the techniques of operational research to
plan the optimum use of resources.
• One of these techniques was the use of networks to represent a
system of related activities
Sushant Waghmare
CPM and PERT 4
*Project Management
5. Sushant Waghmare
CPM and PERT 5
*Project Management Process
• Project planning - Project scheduling - Projectcontrol
• Project team
– made up of individuals from various areas and departments withina
company
• Matrix organization
– a team structure with members from functional areas, depending on skills
required
• Project Manager
– most important member of project team
• Scope statement
– a document that provides an understanding, justification, and expectedresult
of a project
• Statement of work
– written description of objectives of a project
• Organizational Breakdown Structure
– a chart that shows which organizational units are responsible for workitems
• Responsibility Assignment Matrix
– shows who is responsible for work in a project
6. Sushant Waghmare
CPM and PERT 6
*Work breakdown structure
• A method of breaking down a project into individual elements (
components, subcomponents, activities and tasks) in a
hierarchical structure which can be scheduled and cost
• It defines tasks that can be completed independently of other
tasks, facilitating resource allocation, assignment of
responsibilities and measurement and control of the project
• It is foundation of project planning
• It is developed before identification of dependencies and
estimation of activity durations
• It can be used to identity the tasks in the CPM and PERT
7. Work Breakdown Structure for Computer Order
Processing System Project
Sushant Waghmare
CPM and PERT 7
8. Sushant Waghmare
CPM and PERT 8
*Project Planning
• Resource Availability and/or Limits
– Due date, late penalties, early completion incentives
– Budget
• Activity Information
– Identify all required activities
– Estimate the resources required (time) to complete each
activity
– Immediate predecessor(s) to each activity needed to create
interrelationships
9. Sushant Waghmare
CPM and PERT 9
*Project Scheduling and Control Techniques
• Gantt Chart
• Critical Path Method (CPM)
• Program Evaluation and Review Technique (PERT)
10. Graph or bar chart with a bar for each project activity that shows
passage of time
Provides visual display of project schedule
Sushant Waghmare
CPM and PERT 10
*Gantt Chart
11. Sushant Waghmare
CPM and PERT 11
History of CPM/PERT
• Critical Path Method (CPM)
– E I Du Pont de Nemours & Co. (1957) for construction of new
chemical plant and maintenance shut-down
– Deterministic task times
– Activity-on-node network construction
– Repetitive nature of jobs
• Project Evaluation and Review Technique (PERT)
– U S Navy (1958) for the POLARIS missile program
– Multiple task time estimates (probabilistic nature)
– Activity-on-arrow network construction
– Non-repetitive jobs (R & D work)
12. • Event
– Signals the beginning or ending of an activity
– Designates a point in time
– Represented by a circle (node)
• Network
– Shows the sequential relationships among activities using nodes
and arrows
Activity-on-node (AON)
nodes represent activities, and arrows show precedence
relationships
Activity-on-arrow (AOA)
arrows represent activities and nodes are events for points in
time Sushant Waghmare
CPM and PERT 12
*Project Network
16. Sushant Waghmare
CPM and PERT 16
*
PERT / CPM networks contain two majorcomponents
i. Activities, and
ii. Events
Activity: An activity represents an action and consumption of
resources (time, money, energy) required to complete a portion of a
project. Activity is represented byan arrow, (Figure 8.1).
Event: An event (or node) will always occur at the beginning
and end of an activity. The event has no resources and is
represented by a circle. The ith event and jth event are the
tail event and head event respectively, (Figure8.2).
17. Merge and BurstEvents
Oneor moreactivitiescan start and end simultaneouslyatan
event (Figure 8.3 a, b).
Preceding and Succeeding Activities
Activities performed before given events are known as
preceding activities (Figure 8.4), and activities performed after
a given event are known assucceeding activities.
Activities A and B precedeactivities C and D
respectively.
Sushant Waghmare
CPM and PERT 17
18. Dummy Activity
An imaginary activity which does not consume any resource and
time is called a dummy activity. Dummy activities are simply
used to represent a connection between events in order to
maintain a logic in the network. It is represented by a dotted line
in a network, see Figure8.5.
Sushant Waghmare
CPM and PERT 18
19. Sushant Waghmare
CPM and PERT 19
a. Twoactivities starting from a tailevent
must not have a same end event. To ensure
this, it is absolutely necessary to introduce a
dummy activity, as shown in Figure8.6.
b.Looping error should not be formed in a
network, as it represents performance of
activities repeatedly in a cyclic manner, as
shown below in Figure8.7.
c.In a network, there should be only one
startevent and one ending event as shown
below, in Figure 8.8.
d.The direction of arrows should
flow from left to right avoiding
mixing of direction as shown in
Figure 8.9.
20. RULES IN CONSTRUCTING A NETWORK
1. No single activity can be represented more than once in a network. The length of
an arrow has no significance.
2. The event numbered 1 is the start event and an event with highest number is the
end event. Before an activity can be undertaken, all activities preceding it must be
completed. That is, the activities must follow a logical sequence (or –
interrelationship) between activities.
3. In assigning numbers to events, there should not be any duplication of event
numbers in a network.
4. Dummy activities must be used only if it is necessary to reduce the complexity of
a network.
5. A network should have only one start event and one endevent.
Sushant Waghmare
CPM and PERT 20
26. Dr. V
araprasada Rao GGSESTC 24
*AOA Project Network for
House
2 0
1
1 2 4 6 7
3
5
Lay
foundation
3
Design house
and obtain
financing
1
Order and
receive
materials
Dummy
Finish
work
1
Select
carpet
Select
paint
Build
house
3
1
AON Project Network for House
Start 1
3
Design house and
obtain financing
3
1
Order and receive
materials
5
1
Select paint
6
1
Select carpet
Lay foundations
2
2
Build house
4
3 Finish work
7
1
5/10/2016 Sushant Waghmare
CPM and PERT 26
27. *Situations in network diagram
A
B
A must finish before either B or C can start
C
A
B
C both A and B must finish before C canstart
D
C
B
A
both A and C must finish before either of B
or D can start
A
C
B
D
Dummy
A must finish before B can start
both A and C must finish before D canstart
Sushant Waghmare
CPM and PERT
28. Sushant Waghmare
CPM and PERT 28
*Concurrent Activities
2 3
Lay foundation
Order material
(a) Incorrect precedence
relationship
(b) Correct precedence
relationship
3
4
2
Dummy
Lay
foundation
Order material
1
2 0
29. Sushant Waghmare
CPM and PERT 29
*Network example
Illustration of network analysis of a minor redesign of a product and
its associated packaging.
The key question is: How long will it take to complete this project ?
30. *
occur near to each other in time".
Sushant Waghmare
CPM and PERT 30
31. Dr. V
araprasada Rao GGSESTC 29
CPM and PERT
*Questions to prepare activity
network
• Is this a Start Activity?
• Is this a Finish Activity?
• What Activity Precedes this?
• What Activity Follows this?
• What Activity is Concurrent with this?
Sushant Waghmare
31
32. Sushant Waghmare
CPM and PERT
*CPM
calculation
30
• Path
– A connected sequence of activities leading from
the starting event to the ending event
• Critical Path
– The longest path (time); determines the project
duration
• Critical Activities
– All of the activities that make up the critical path
32
33. *Forward
Pass
LS = minimum LS of immediate predecessors
• Earliest Start Time (ES)
– earliest time an activity can start
– ES = maximum EF of immediate predecessors
• Earliest finish time (EF)
– earliest time an activity can finish
– earliest start time plus activity time
EF= ES + t
Backward Pass
Latest Start Time (LS)
Latest time an activity can start without delaying critical path
time
LS= LF - t
Latest finish time (LF)
latest time an activity can be completed without delaying
critical path time
5/10/2016 Dr. Varaprasada Rao GGSESTC 31
Sushant Waghmare
CPM and PERT 33
34. Sushant Waghmare
CPM and PERT 34
*CPM
analysis
• Draw the CPM network
• Analyze the paths through the network
• Determine the float for each activity
– Compute the activity’s float
float = LS - ES = LF - EF
– Float is the maximum amount of time that this activity can be
delay in its completion before it becomes a critical activity,
i.e., delays completion of the project
• Find the critical path is that the sequence of activities and events
where there is no “slack” i.e.. Zero slack
– Longest path through a network
• Find the project duration is minimum project completion time
35. Sushant Waghmare
CPM and PERT 35
*CPM
Example:
a, 6
• CPM Network
f, 15
b, 8
c, 5
e, 9
d, 13
g, 17 h, 9
i, 6
j, 12
36. Sushant Waghmare
CPM and PERT 36
*CPM
Example
• ES and EF Times
a, 6
f, 15
b, 8
c, 5
e, 9
d, 13
g, 17 h, 9
i, 6
j, 12
0 6
0 8
0 5
37. Sushant Waghmare
CPM and PERT 37
*CPM
Example
• ES and EF Times
a, 6
f, 15
b, 8
c, 5
e, 9
d, 13
g, 17 h, 9
i, 6
j, 12
0 6
0 8
0 5
5 14
8 21
6 23
6 21
38. Sushant Waghmare
CPM and PERT 38
*CPM
Example
• ES and EF Times
a, 6
f, 15
b, 8
c, 5
d, 13
g, 17 h, 9
i, 6
j, 12
0 6
0 8
8 21 21 33
6 23
21 30
23 29
6 21
e, 9
0 5
Project’s EF = 33
5 14
39. aprasada Rao
CPM and PERT 39
*CPM
Example
• LS and LF Times
a, 6
f, 15
b, 8
c, 5
e, 9
d, 13
g, 17
h, 9
i, 6
j, 12
0 6
Dr.Var GGSESTC
0 8
0 5
5 14
21 33
21 33
23 29
27 33
8 21
6 23
21 30
24 33
6 21
Sushant Waghmare
40. aprasada Rao
CPM and PERT 40
*CPM
Example
• LS and LF Times
a, 6
f, 15
b, 8
c, 5
e, 9
d, 13
g, 17
h, 9
i, 6
j, 12
0 6
4 10
Dr.Var GGSESTC
0 8
0 8
0 5
7 12 5 14
12 21
21 33
21 33
23 29
27 33
8 21
8 21
6 23
10 27
21 30
24 33
6 21
9 24
Sushant Waghmare
42. Sushant Waghmare
CPM and PERT 42
*CPM
Example
• Critical Path
a, 6
f, 15
b, 8
d, 13
g, 17 h, 9
i, 6
j, 12
c, 5
e, 9
43. Dr. Varaprasada Rao GGSESTC 41
*PE
RT
• PERT is based on the assumption that an activity’s duration
follows a probability distribution instead of being a single value
• Three time estimates are required to compute the parameters of
an activity’s duration distribution:
– pessimistic time (tp ) - the time the activity would take if
things did not go well
– most likely time (tm ) - the consensus best estimate of the
activity’s duration
– optimistic time (to ) - the time the activity would take if things
did go well
e
Mean (expected time): t =
t + 4 t + t
p m o
6
Variance: Vt = 2 =
tp -to
6
2
5/10/2016 Sushant Waghmare
CPM and PERT 43
44. Sushant Waghmare
CPM and PERT 44
*PERT
analysis
• Draw the network.
• Analyze the paths through the network and find the criticalpath.
• The length of the critical path is the mean of the project duration
probability distribution which is assumed to be normal
• The standard deviation of the project duration probability
distribution is computed by adding the variances of the critical
activities (all of the activities that make up the critical path)and
taking the square root of that sum
• Probability computations can now be made using the normal
distribution table.
45. Sushant Waghmare
CPM and PERT 45
*Probability
computation
Z =
Determine probability that project is completed within specified time
x -
where = tp = project meantime
= project standard mean time
x = (proposed ) specified time
46. Sushant Waghmare
CPM and PERT 46
*Normal Distribution of Project
Time
Time
= tp x
Z
Probability
47. Sushant Waghmare
CPM and PERT 47
*PERT
Example
Immed. Optimistic Most Likely Pessimistic
Activity Predec. Time (Hr.) Time (Hr.) Time (Hr.)
A -- 4 6 8
B -- 1 4.5 5
C A 3 3 3
D A 4 5 6
E A 0.5 1 1.5
F B,C 3 4 5
G B,C 1 1.5 5
H E,F 5 6 7
I E,F 2 5 8
J D,H 2.5 2.75 4.5
K G,I 3 5 7
49. Sushant Waghmare
CPM and PERT 49
*PERT
Example
Activity Expected Time Variance
A 6 4/9
B 4 4/9
C 3 0
D 5 1/9
E 1 1/36
F 4 1/9
G 2 4/9
H 6 1/9
I 5 1
J 3 1/9
K 5 4/9
50. Sushant Waghmare
CPM and PERT 50
*PERT
Example
Activity ES EF LS LF Slack
A 0 6 0 6 0 *critical
B 0 4 5 9 5
C 6 9 6 9 0 *
D 6 11 15 20 9
E 6 7 12 13 6
F 9 13 9 13 0 *
G 9 11 16 18 7
H 13 19 14 20 1
I 13 18 13 18 0 *
J 19 22 20 23 1
K 18 23 18 23 0 *
51. PERT Example
Vpath = VA + VC + VF + VI + VK
= 4/9 + 0 + 1/9 + 1 + 4/9
= 2
Sushant Waghmare
CPM and PERT 51
path = 1.414
z = (24 - 23)/ (24-23)/1.414 = .71
From the Standard Normal Distribution table:
P(z < .71) = .5 + .2612 = .7612
54. Sushant Waghmare
CPM and PERT 54
*Cost consideration in
project
• Project managers may have the option or requirement to crash the
project, or accelerate the completion of the project.
• This is accomplished by reducing the length of the critical path(s).
• The length of the critical path is reduced by reducing the duration
of the activities on the critical path.
• If each activity requires the expenditure of an amount of money to
reduce its duration by one unit of time, then the project manager
selects the least cost critical activity, reduces it by one time unit,
and traces that change through the remainder of the network.
• As a result of a reduction in an activity’s time, a new criticalpath
may be created.
• When there is more than one critical path, each of the critical
paths must be reduced.
• If the length of the project needs to be reduced further, the
process is repeated.
55. Sushant Waghmare
CPM and PERT 55
*Project
Crashing
• Crashing
– reducing project time by expending additional resources
• Crash time
– an amount of time an activity is reduced
• Crash cost
– cost of reducing activity time
• Goal
– reduce project duration at minimum cost
56. Dr. Varaprasada Rao GGSESTC
*Activity
crashing
Activity time
53
Crashing activity
Crash
time
Crash
cost
NormalActivity
Normal
time
Normal
cost
Slope = crash cost per unit time
5/10/2016 Sushant Waghmare
CPM and PERT 56
57. Dr. Varaprasada Rao GGSESTC 54
*Time-Cost
Relationship
Crashing costs increase as project duration decreases
Indirect costs increase as project duration increases
Reduce project length as long as crashing costs are less than
indirect costs
Time-Cost Tradeoff
time
Direct cost
Total project cost
Indirect
cost
Min total cost =
optimal project
time
5/10/2016 Sushant Waghmare
CPM and PERT 57
61. 58
*Benefits of
CPM/PERT
• Useful at many stages of project management
• Mathematically simple
• Give critical path and slack time
• Provide project documentation
• Useful in monitoring costs
CPM/PERT can answer the following important
questions:
•How long will the entire project take to be completed? What are the
risks involved?
•Which are the critical activities or tasks in the project whichcould
delay the entire project if they were not completed on time?
•Is the project on schedule, behind schedule or ahead of schedule?
•If the project has to be finished earlier than planned, what is thebest
way 5
t/
o1
0
/
d2
0
o1
6
this at the leastcD
or
.Vsatr?aprasadaRao GGSESTC Sushant Waghmare
CPM and PERT 61
62. Sushant Waghmare
CPM and PERT 62
* Limitations to
CPM/PERT
• Clearly defined, independent and stable activities
• Specified precedence relationships
• Over emphasis on critical paths
• Deterministic CPM model
• Activity time estimates are subjective and depend on judgment
• PERT assumes a beta distribution for these time estimates, but
the actual distribution may be different
• PERT consistently underestimates the expected project
completion time due to alternate paths becoming critical
To overcome the limitation, Monte Carlo simulations can be
performed on the network to eliminate the optimistic bias
64. Sushant Waghmare
CPM and PERT 64
*Practice
Example
A social project manager is faced with a project with thefollowing
activities:
Activity Description Duration
Social work team to live in village 5w
Social research team to do survey 12w
Analyse results of survey 5w
Establish mother & child health program 14w
Establish rural credit programme 15w
Carry out immunization of under fives 4w
Draw network diagram and show the critical path.
Calculate project duration.
65. Sushant Waghmare
CPM and PERT 65
*Practice
problem
Activity Description Duration
1-2 Social work team to live in village 5w
1-3 Social research team to do survey 12w
3-4 Analyse results of survey 5w
2-4 Establish mother & child health program 14w
3-5 Establish rural credit programme 15w
4-5 Carry out immunization of under fives 4w
3
1
2
4
5
68. Dr. Varaprasada Rao GGSESTC
*Step 1-Define the Project: Cables By ITD is bringing a new
product on line to be manufactured in their current facility in
existing space. The owners have identified 11 activities and their
precedence relationships. Develop an AON for the project.
Activity Description
Immediate Duration
Predecessor (weeks)
A Developproduct specifications None 4
B Designmanufacturing process A 6
C Source&purchasematerials A 3
D Source&purchasetooling&equipment B 6
E Receive&installtooling&equipment D 14
F Receivematerials C 5
G Pilotproduction run E&F 2
H Evaluateproduct design G 2
I Evaluateprocess performance G 3
J Writedocumentationreport H&I 4
K5/10/201T6ransitiontomanufacturing J 65 2
Sushant Waghmare
CPM and PERT 68
69. *Step 2- Diagram the Network
for
*Cables By ITD
Sushant Waghmare
CPM and PERT 69
70. * Step 3 (a)- Add Deterministic
Time Estimates and Connected
Paths
Sushant Waghmare
CPM and PERT 70
71. Sushant Waghmare
CPM and PERT 71
* Step 3 (a) (Con’t):
Calculate the Project
Completion Times
• The longest path (ABDEGIJK) limits the
project’s duration (project cannot finish in less
time than its longest path)
• ABDEGIJK is the project’s critical path
Paths Path duration
ABDEGHJK 40
ABDEGIJK 41
ACFGHJK 22
ACFGIJK 23
77. Dr. Varaprasada Rao GGSESTC
* Revisiting Cables By ITD
Using Probabilistic Time
Estimates
Activity Description
O
p
tim
isti
c time
Mostlikely
time
P
essim
isti
c time
A Developproductspecifications 2 4 6
B Designmanufacturingprocess 3 7 10
C Source&purchasematerials 2 3 5
D Source&purchasetooling&equipment 4 7 9
E Receive&installtooling&equipment 12 16 20
F Receivematerials 2 5 8
G Pilotproductionrun 2 2 2
H Evaluateproductdesign 2 3 4
I Evaluateprocessperformance 2 3 5
J Writedocumentationreport 2 4 6
2 2
K 5
/
1
0
T/
2
r0
a1
n6
sitiontomanufacturing 742
Sushant Waghmare
CPM and PERT 77
78. *Using Beta Probability
Distribution to Calculate
Expected Time Durations
• A typical beta distribution is shown below, note that ithas
definite end points
• The expected time for finishing each activity is a weighted
average
6
optimistic 4most likelypessimistic
Ex
5/p
10/.
20t
16
ime Dr. V
araprasada Rao GGSESTC 75
Sushant Waghmare
CPM and PERT 78
79. Dr. Varaprasada Rao GGSESTC
*Calculating Expected Task
Times
Activity
Optimistic
time
Most likely
time
Pessimistic
time
Expected
time
A
B
C
D
E
F
G
H
I
5/10
J 16
/20
K
2
3
2
4
12
2
2
2
2
2
2
4
7
3
7
16
5
2
3
3
4
2
6
10
5
9
20
8
2
4
5
6
2
4
6.83
3.17
6.83
16
5
2
3
3.17
4
2 76
Expected time
optimistic 4most likely pessimistic
6
Sushant Waghmare
CPM and PERT 79
80. * Network Diagram with
Expected Activity
Times
Sushant Waghmare
CPM and PERT 80
81. Sushant Waghmare
CPM and PERT 81
* Estimated
Path Durations
through the
Network
• ABDEGIJK is the expected critical path &
the project has an expected duration of 44.83
weeks
Activities on paths Expected duration
ABDEGHJK 44.66
ABDEGIJK 44.83
ACFGHJK 23.17
ACFGIJK 23.34
83. Sushant Waghmare
CPM and PERT 83
* Estimating the
Probability of
Completion Dates
• Using probabilistic time estimates offers the advantage of predictingthe
probability of project completion dates
• We have already calculated the expected time for each activity by making
three time estimates
• Now we need to calculate the variance for each activity
• The variance of the beta probability distributionis:
– where p=pessimistic activity time estimate
o=optimistic activity time estimate
6
σ 2
p o
2
84. Dr.Varapra sada Rao GGSESTC
*Project Activity
Variance
Activity Optimistic Most Likely Pessimistic Variance
A 2 4 6 0.44
B 3 7 10 1.36
C 2 3 5 0.25
D 4 7 9 0.69
E 12 16 20 1.78
F 2 5 8 1.00
G 2 2 2 0.00
H 2 3 4 0.11
I 2 3 5 0.25
J 2 4 6 0.44
2016
K 2 2 2 0.0
81
0
5/10/ Sushant Waghmare
CPM and PERT 84
85. Sushant Waghmare
CPM and PERT 85
* Variances of
Each Path
through the
Network
Path
Number
Activities on
Path
Path Variance
(weeks)
1 A,B,D,E,G,H,J,k 4.82
2 A,B,D,E,G,I,J,K 4.96
3 A,C,F,G,H,J,K 2.24
4 A,C,F,G,I,J,K 2.38
86. Sushant Waghmare
CPM and PERT 86
* Calculating the Probability of
Completing the Project in Less Than a
Specified Time
• When you know:
– The expected completion time
– Its variance
• You can calculate the probability of completing the project in“X”
weeks with the following formula:
2
σP
path standard time
z
specifiedtime path expectedtime DT EFP
Where DT = the specified completiondate
EFPath = the expected completion time of thepath
σPath
2
variance of path
87. Sushant Waghmare
CPM and PERT 87
* Example: Calculating the
probability of finishing the
project in 48 weeks
• Use the z values in Appendix B to determineprobabilities
• e.g. probability for path 1 is
Path
Number
Activities on Path Path Variance
(weeks)
z-value Probability of
Completion
1 A,B,D,E,G,H,J,k 4.82 1.5216 0.9357
2 A,B,D,E,G,I,J,K 4.96 1.4215 0.9222
3 A,C,F,G,H,J,K 2.24 16.5898 1.000
4 A,C,F,G,I,J,K 2.38 15.9847 1.000
4.82
1.52
48 weeks 44.66 weeks
z
88. Sushant Waghmare
CPM and PERT 88
* Reducing Project
Completion
Time
• Project completion times may need to be
shortened because:
– Different deadlines
– Penalty clauses
– Need to put resources on a new project
– Promised completion dates
• Reduced project completion time is
“crashing”
89. Sushant Waghmare
CPM and PERT 89
*Reducing Project Completion
Time
–
• Crashing a project needs to balance
– Shorten a project duration
– Cost to shorten the project duration
• Crashing a project requires you to know
– Crash time of each activity
– Crash cost of each activity
Crash cost/duration = (crash cost-normal cost)/(normal time – crash time)
90. Dr.Va raprasada Rao GGSESTC
*Reducing the Time of a Project
(crashing)
Activity Normal
Time (wk)
Normal
Cost
Crash
Time
Crash
Cost
Max. weeks
of reduction
Reduce cost
per week
A 4 8,000 3 11,000 1 3,000
B 6 30,000 5 35,000 1 5,000
C 3 6,000 3 6,000 0 0
D 6 24,000 4 28,000 2 2,000
E 14 60,000 12 72,000 2 6,000
F 5 5,000 4 6,500 1 1500
G 2 6,000 2 6,000 0 0
H 2 4,000 2 4,000 0 0
I 3 4,000 2 5,000 1 1,000
J 4 4,000 2 6,400 2 1,200
5/1
K
0/2016
2 5,000 2 5,000 0
8
0
7
Sushant Waghmare
CPM and PERT 90
91. Sushant Waghmare
CPM and PERT 91
*Crashing Example: Suppose the Cables By ITD
project manager wants to reduce the new product project
from 41 to 36 weeks.
• Crashing Costs are considered to be linear
• Look to crash activities on the critical path
• Crash the least expensive activities on the critical path first
(based on cost per week)
– Crash activity I from 3 weeks to 2 weeks 1000
– Crash activity J from 4 weeks to 2 weeks 2400
– Crash activity D from 6 weeks to 4 weeks 4000
– Recommend Crash Cost 7400
92. Sushant Waghmare
CPM and PERT 92
*
PERT
CPM
PERT stands for Project Evaluation and Review
Technique developed during 1950’s. The technique was
developed and used in conjunction with the planning and
designing of the Polaris missileproject.
CPM stands for Critical Path Method which was
developed by DuPont Company and applied first to the
construction projects in the chemicalindustry.
Though both PERT and CPM techniques have similarity in terms of
concepts, the basic difference is; CPM has single time estimate and PERT
has three time estimates for activities and uses probability theory to find
the chance of reaching the scheduledtime.
93. Sushant Waghmare
CPM and PERT 93
*
Planning:
Planning involves setting the objectives of the project. Identifying
various activities to be performed and determining the requirement of
resources such as men, materials, machines,etc.
The cost and time for all the activities are estimated, and a network diagram is
developed showing sequential interrelationships (predecessor and successor)
between various activities during theplanning stage.
Scheduling:
Based on the time estimates, the start and finish times for each
activity are worked out by applying forward and backward pass
techniques, critical path is identified, along with the slack and float for
the non-critical paths.
Controlling:
Controlling refers to analyzing and evaluating the actual
progress against the plan. Reallocation of resources, crashing and
reviewof projectswith periodical reportsarecarried out.
94. Sushant Waghmare
CPM and PERT 94
*
* FULKERSON'S RULE
Step1: Numberthe startor initial eventas 1.
Step2: From event 1, strike off all outgoing activities. This would have
made one or more events as initial events (event which do not have
incoming activities). Numberthateventas 2.
Step3: Repeat step 2 for event 2, event 3 and till the end event. The end
event must have the highestnumber
95. Sushant Waghmare
CPM and PERT 95
*
Thecritical path forany network is the longestpath through theentire
network.
Since all activities must be completed to complete the entire project, the
length of the critical path is also the shortest time allowable for
completion of theproject.
Thus if the project is to be completed in that shortest time, all activities
on thecritical path must bestarted as soonas possible.
These activitiesare called critical activities.
If the project has to be completed ahead of the schedule, then the time
required forat leastoneof thecritical activity must be reduced.
Further, any delay in completing the critical activities will increase the
projectduration.
96. The activity, which does not lie on the critical path, is called non-critical
activity.
These non-critical activities may have someslack time.
The slack is the amount of time by which the start of an activity may be
delayedwithoutaffecting theoverall completion timeof theproject.
Butacritical activity has noslack.
To reduce the overall project time, it would require more resources (at
extracost) toreduce the time taken by thecritical activities tocomplete.
Sushant Waghmare
CPM and PERT 96
97. Sushant Waghmare
CPM and PERT 97
*
Before the critical path in a network is determined, it is necessary to
find the earliest and latest time of each event to know the earliest
expected time (TE) at which the activities originating from the event
can be started and to know the latest allowable time (TL) at which
activitiesterminating at theeventcan becompleted.
Forward Pass Computations (to calculate Earliest, Time TE)
Step 1: Begin from thestarteventand move towards theend event.
Step 2: PutTE = 0 forthestartevent.
Step 3: Go to the next event (i.e node 2) if there is an incoming activity for
event 2, add calculate TE of previousevent (i.eevent 1) and activitytime.
Note: If there are more than one incoming activities, calculate TE for all incoming
activitiesand take the maximum value. Thisvalue is theTE forevent 2.
Step 4: Repeat the same procedure from step 3 till theend event.
98. Backward Pass Computations (tocalculate LatestTimeTL)
Sushant Waghmare
CPM and PERT 98
*
Step 1: Begin from end event and move towards the start
event. Assume that thedirectionof arrows is reversed.
Step 2: Latest Time TL for the last event is the earliest
time. TE of the lastevent.
Step 3: Go to the next event, if there is an incoming activity, subtract
the value of TL of previous event from the activity duration time. The
arrived value is TL for that event. If there are more than one incoming
activities, take the minimum TEvalue.
Step 4: Repeat the same procedurefrom step 2 till the
startevent.
99. *
As discussed earlier, the non – critical activities have some slack
or float. The float of an activity is the amount of time available by
which it is possible to delay its completion time without
extending theoverall projectcompletiontime.
tij = duration of activity
TE = earliest expectedtime
TL = latest allowabletime
ESij = earliest start time of the activity
EFij = earliest finish time of theactivity
LSij = latest start time of the activity
LFij = latest finish time of theactivity
Total Float TFij: The total floatof an activity is thedifference between
the lateststart timeand theearlieststart timeof thatactivity.
TFij = LS ij – ESij ....................(1)
or
TFij = (TL – TE)– tij …………..(ii)
5/10/2016 102
Dr. Varaprasada Rao GGSESTC Sushant Waghmare
CPM and PERT 99
100. Free Float FFij: The time by which the completion of an activity can
be delayed from its earliest finish time without affecting the
earlieststarttimeof thesucceedingactivity iscalled free float.
Sushant Waghmare
CPM and PERT
*
*
*FFij = Total float – Head event
*Independent FlsolaatckIFij:The amount of time by which
the start of an activity can be delayed without
affecting the earliest start time of any immediately
following activities, assuming that the preceding
activity has finished at its latest finish time.
*IF ij = (Ej – Li) – tij
100
....................(4) Where tail event slack = Li –Ei
IFij = Free float – Tail eventslack
The negativevalueof independentfloat isconsidered to be zero.
100
101. Critical Path:
After determining the earliest and the latest scheduled times for various
activities, the minimum time required to complete the project is
calculated. In a network, among various paths, the longest path which
determines the total time duration of the project is called the critical path.
The following conditions must be satisfied in locating the critical path of a
network.
Anactivity is said to becritical only if both theconditionsaresatisfied.
1. TL – TE = 0
2. TLj – tij – TEj = 0
Example :
A projectschedule has the following characteristicsas shown in Table
i. Construct PERT network.
ii. Compute TE and TLfor
eachactivity.
iii. Find the critical path.
Sushant Waghmare
CPM and PERT 101
101
106. PROJECT EVALUATION REVIEW TECHNIQUE,(PERT)
In the critical path method, the time estimates are assumed to be
known with certainty. In certain projects like research and
development, new product introductions, it is difficult to estimate
the time of variousactivities.
Hence PERT is used in such projects with a probabilistic method using three time
estimates foran activity, rather than a singleestimate, as shown in Figure 8.22.
Optimistic time tO:
It is the shortest time taken to complete the
activity. It means that if everything goes well then
there is more chance of completing the activity
within thistime.
Most likely timetm:
It is the normal time taken to complete an activity,
if the activity were frequently repeated under the
sameconditions.
Pessimistic time tp:
It is the longest time that an activity would take to
5/10/2016
worst time estimate that an
if unexpected problems are
109
complete. It is the
activity would take
faced.
Dr. Varaprasada Rao GGSESTC
Sushant Waghmare
CPM and PERT 106
107. Sushant Waghmare
CPM and PERT
*
*
Theaverage or mean (ta) valueof
theactivityduration isgiven by,
Thevarianceof theactivitytime
is calculated using theformula,
Probability for ProjectDuration
The probability of completing the project
within the scheduled time (Ts) or contracted
time may be obtained by using the standard
normal deviate where Te is the expected time
of project completion.
Probability of completing theproject
within the scheduled timeis,
107
107
108. An R & D project has a list of tasks to be performed whose timeestimatesare
given in the Table 8.11, asfollows.
Sushant Waghmare
CPM and PERT
*
a. Draw the projectnetwork.
b. Find the criticalpath.
c. Find the probability that the project is completed in 19 days. If the
probability is less than 20%, find the probability of completing it in 24
days.
108
108
109. Sushant Waghmare
CPM and PERT
*
The variance of activity time is
calculated using the formula (6).
Similarly, variances of all theactivities
arecalculated.
109
109
110. Sushant Waghmare
CPM and PERT
*
calculate the time earliest
(TE) and time Latest (TL)
for all theactivities.
From the network diagram Figure 8.24, the critical path
is identified as
1-4, 4-6, 6-7, with a projectdurationof 22 days.
110
110
111. Sushant Waghmare
CPM and PERT
*
Tofind Z0 ,
we know, P (Z <Z Network Model 0) = 0.5 – z (1.3416) (from normal tables, z (1.3416) = 0.4099)
= 0.5 – 0.4099
= 0.0901
= 9.01% Thus, the probabilityof completing the R & D project in 19 days is 9.01%.
Since the probability of completing the project in 19 days is less than 20% As in question, we
find the probability of completing it in 24 days.
111
111
112. Sushant Waghmare
CPM and PERT
*
The two importantcomponentsof anyactivityare thecostand time.
Cost is directly proportional to timeand viceversa.
For example, in constructing a shopping complex, the expected time of completion can be
calculated using the time estimates of various activities. But if the construction has to be finished
earlier, it requires additional cost to complete the project. We need to arrive at a time/cost trade-
off between total costof project and total time required tocomplete it.
Normal time:
Normal time is the time required to complete
the activity at normal conditions andcost.
Crash time:
Crash time is the shortest possible activity
time; crashing more than the normal time
will increase the directcost.
Cost Slope
Cost slope is the increase in cost per unit of
time saved by crashing. A linear cost curve
is shown in Figure8.27.
112
112
113. Sushant Waghmare
CPM and PERT
*
An activity takes 4 days to complete at a normal cost of Rs. 500.00. If it is
possible to complete the activity in 2 days with an additional cost of Rs.
700.00, what is the incremental costof theactivity?
Incremental Cost or CostSlope
It means, if oneday is reduced we have tospend Rs. 100/- extra
perday.
Project Crashing
Procedure for crashing
Step1: Draw the network diagram and mark the Normal time and Crash time.
Step2: Calculate TE and TL for all theactivities.
Step3: Find the critical path and other paths.
Step 4: Find the slope for all activities and rank them in ascending order.
113
113
114. Step 5: Establish a tabular column with required field.
Step 6: Select the lowest ranked activity; check whether it is a critical activity. If
so,crash theactivity, elsego to the next highestranked activity.
Note: The critical path must remain critical while crashing.
Step 7: Calculate the total cost of project for each crashing
Step 8: Repeat Step 6 until all the activities in the critical path are fully
crashed.
Example
The following Table
8.13 gives the activities
of a construction
project and otherdata.
117
If the indirect cost is Rs. 20 perday, crash theactivities to find the minimum
duration of the projectand the projectcostassociated.
5/10/2016
Dr. Varaprasada Rao GGSESTC
Sushant Waghmare
CPM and PERT 114
115. From thedata provided in the table, draw the networkdiagram (Figure 8.28)
and find the criticalpath.
*
From the diagram, we observe that the
critical path is 1-2-5 with project duration of
14 days
Thecost slope forall activities and theirrank
iscalculated as shown in Table 8.14
5/10/2016 Dr. Varaprasada Rao GGSESTC 118
Sushant Waghmare
CPM and PERT 115
116. Theavailable pathsof the network are listed down in Table 8.15
indicating the sequence of crashing (see Figure8.29).
The sequence of crashing
and the total cost involved
is given in Table 8.16Initial
direct cost = sum of all
normal costsgiven
= Rs. 490.00
Sushant Waghmare
CPM and PERT 116
116
117. It is not possible to crash more than 10 days, as all
the activities in the critical path are fully crashed.
Hence the minimum project duration is 10 days
with the total cost of Rs.970.00.
Sushant Waghmare
CPM and PERT 117
Activity
Crashed
Project
Duration
Critical Path Direct Cost in (Rs.) Indirect
Cost in
(Rs.)
Total
Cost in
(Rs.)
- 14 1-2-5 490 14 x 20 =
280
770
1 – 2(2)
2 – 5(2)
2 – 4(1)
3 – 4(2)
10 1 – 2 – 5
1 – 3 – 4 – 5
1 – 2 – 4 – 5
490 + (2 x 15) + (2 x
100) + (1 x 10) + (2x
20) = 770
10 x 20 =
200
970
117
121. a. Draw the project networkdiagram.
b. Calculate the lengthand variance of thecritical path.
c. What is the probabilitythat the jobson thecritical path can be
completed in 41 days?
Sushant Waghmare
CPM and PERT 121
121