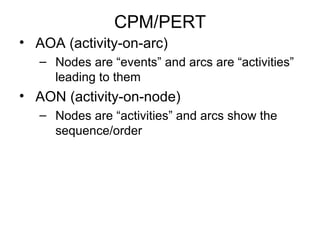
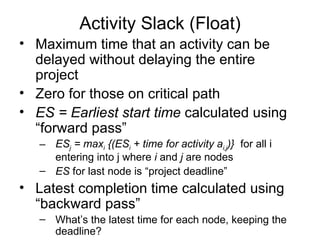
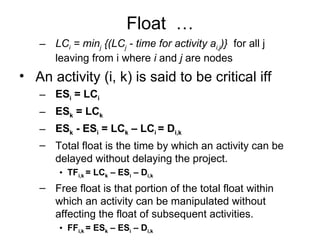
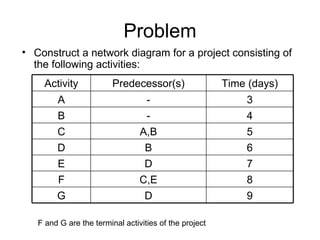
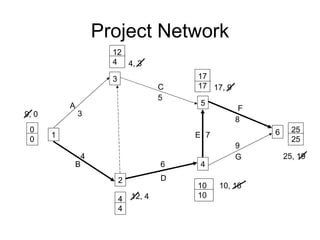
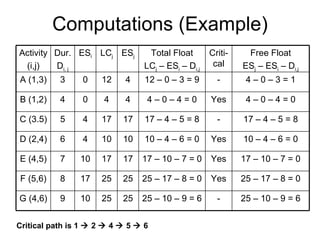
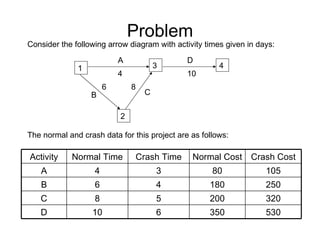
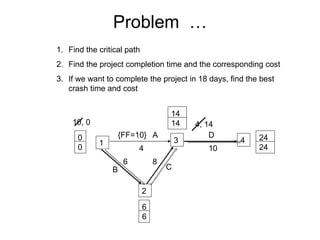
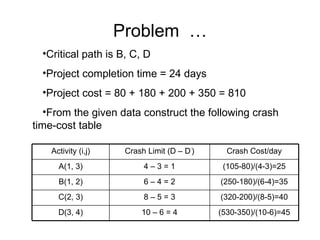
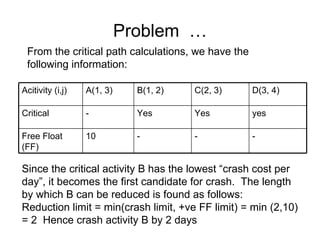
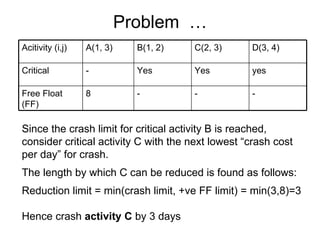
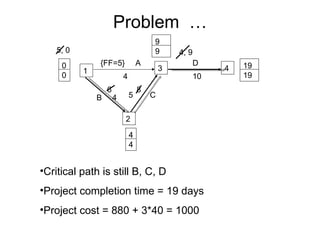
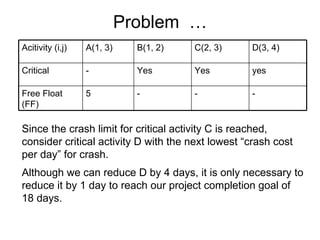
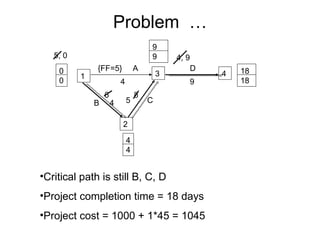
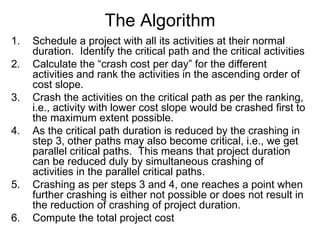
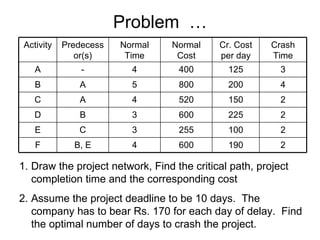
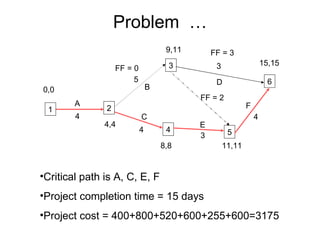
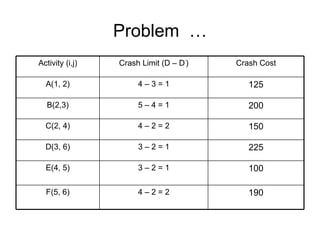
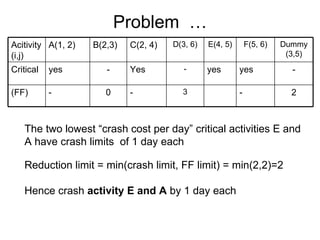
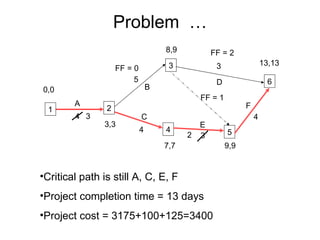
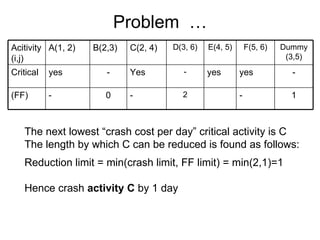
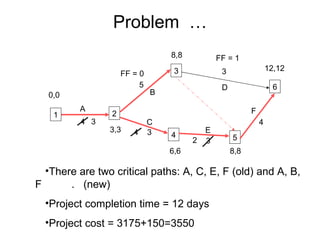
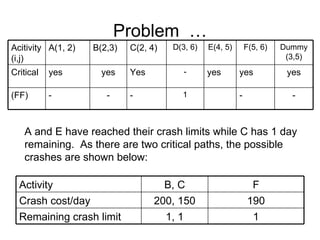
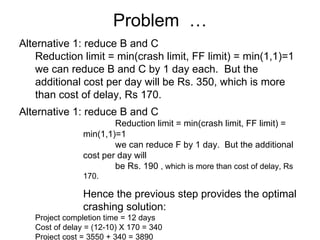
Graph A graph G consists of two finite sets (sets having finitely many elements), a set V of points, called vertices, and a set E of connecting lines, called edges, such that each edge connects two vertices, called the endpoints of the edge,  we write G = (V, E)
Digraph & Network A  diagraph  (or directed graph) is a graph in which each edge (i,j) has a direction from its initial point i to its terminal point j. A graph containing closed circuits are called networks. A graph without closed circuits are called trees.
Project Scheduling A project is a collection of inter-related activities with each activity consuming time and resources Critical Path Method (CPM) Deterministic  Program Evaluation and Review Technique (PERT) Probabilistic
Project Network Three types of information are needed to describe a project Activity information Precedence relationships Time information The (estimated) project duration equals the length of the longest path through the project network.  This longest path is called the critical path.
CPM/PERT Activity An activity is a task, or item of work to be done, that consumes time, effort, money or other resources. It is between two events, called the “preceding” and “succeeding” ones. Event An event represents the start (beg) or completion (end) of some activity and as such it consumes no time.  Also, known as a node, it is not complete until all the activities flowing into it are completed. Predecessor activity  An activity which must be completed before one or more other activities start.
CPM/PERT Successor activity An activity which started immediately after one or more of other activities are completed Dummy activity An activity which does not consume any resource or time. Critical activity  An activity is critical, if the delay in its start will further delay the project completion time.. A non-critical activity allows some scheduling slack, so that the start time of the activity may be advanced or delayed within limits without affecting the completion date of the entire project
CPM/PERT AOA (activity-on-arc) Nodes are “events” and arcs are “activities” leading to them AON (activity-on-node) Nodes are “activities” and arcs show the sequence/order
Activity Slack (Float) Maximum time that an activity can be delayed without delaying the entire project  Zero for those on critical path ES = Earliest start time  calculated using “forward pass” ES j  = max i  {(ES i  + time for activity a i,j )}   for all i entering into j where  i  and  j  are nodes  ES  for last node is “project deadline” Latest completion time calculated using “backward pass” What’s the latest time for each node, keeping the deadline?
Float  … LC i  = min j  {(LC j  - time for activity a i,j )}   for all j leaving from i where  i  and  j  are nodes  An activity (i, k) is said to be critical iff ES i  = LC i ES k  = LC k ES k  - ES i  = LC k  – LC i  = D i,k Total float is the time by which an activity can be delayed without delaying the project. TF i,k  = LC k  – ES i  – D i,k Free float is that portion of the total float within which an activity can be manipulated without affecting the float of subsequent activities. FF i,k  = ES k  – ES i  – D i,k
Problem Construct a network diagram for a project consisting of the following activities: F and G are the terminal activities of the project Activity Predecessor(s) Time (days) A - 3 B - 4 C A,B 5 D B 6 E D 7 F C,E 8 G D 9
Problem … Perform the following computations Start and completion time for each event Critical and non-critical activities Total float and free float times for activities Find the critical path Find the project completion time
Project Network 10 10 1 2 3 4 5 6 A C E B D F G 3 5 7 4 6 8 9 0 0 4 4 17 17 25 25 12 4 4, 3 9, 0 12, 4 17, 9 10, 16 25, 19
Computations (Example) Critical path is 1    2    4    5    6 Activity (i,j) Dur. D i, j ES i LC j ES j Total Float LC j  – ES i  – D i,j Criti-cal Free Float ES j  – ES i  – D i,j A (1,3) 3 0 12 4 12 – 0 – 3 = 9 - 4 – 0 – 3 = 1 B (1,2) 4 0 4 4 4 – 0 – 4 = 0 Yes 4 – 0 – 4 = 0 C (3.5) 5 4 17 17 17 – 4 – 5 = 8 - 17 – 4 – 5 = 8 D (2,4) 6 4 10 10 10 – 4 – 6 = 0 Yes 10 – 4 – 6 = 0 E (4,5) 7 10 17 17 17 – 10 – 7 = 0 Yes 17 – 10 – 7 = 0 F (5,6) 8 17 25 25 25 – 17 – 8 = 0 Yes 25 – 17 – 8 = 0 G (4,6) 9 10 25 25 25 – 10 – 9 = 6 - 25 – 10 – 9 = 6
Project Cost Optimization Delay in project completion costs money Speeding up the project also costs money So, what is the perfect balance? Crashing an activity refers to taking special costly measures to reduce the duration of an activity below its normal value. These special measures might include using overtime, hiring additional temporary help, using special time saving materials, obtaining special equipment etc. The “normal” time for an activity can be reduced by using increased resources.  The limit beyond which an activity time cannot be shortened is known as the “crash limit.”
Project Cost Optimization contd… Crashing the project refers to crashing a number of activities in order to reduce the duration of the project below its normal value. The CPM method of time-cost trade-offs is concerned with determining how much (if any) to crash each of the activities in order to reduce the anticipated project completion time.
Project Cost Optimization contd… The total project cost comprises direct and indirect costs. Direct costs are associated with the individual activities such as man-power loading, equipment utilized, materials consumed etc. in each activity. Indirect costs are those expenditures which cannot be allocated to individual activities of the project These may include administration or supervision costs, loss of revenue, fixed overheads, and so on. While indirect costs go up with the increase in project duration, direct costs go high as the time for individual activity is reduced.
Problem Consider the following arrow diagram with activity times given in days: The normal and crash data for this project are as follows: 1 2 3 4 A B C D 4 6 8 10 Activity Normal Time Crash Time Normal Cost Crash Cost A 4 3 80 105 B 6 4 180 250 C 8 5 200 320 D 10 6 350 530
Problem  … Find the critical path Find the project completion time and the corresponding cost If we want to complete the project in 18 days, find the best crash time and cost 1 2 3 4 A B C D 4 6 8 10 6 6 0 0 10, 0 4, 14 24 24 14 14 {FF=10}
Problem  … Critical path is B, C, D Project completion time = 24 days Project cost = 80 + 180 + 200 + 350 = 810 From the given data construct the following crash time-cost table Activity (i,j) Crash Limit (D – D ’ ) Crash Cost/day A(1, 3) 4 – 3 = 1 (105-80)/(4-3)=25 B(1, 2) 6 – 4 = 2 (250-180)/(6-4)=35 C(2, 3) 8 – 5 = 3 (320-200)/(8-5)=40 D(3, 4) 10 – 6 = 4 (530-350)/(10-6)=45
Problem  … From the critical path calculations, we have the following information: Since the critical activity B has the lowest “crash cost per day”, it becomes the first candidate for crash.  The length by which B can be reduced is found as follows: Reduction limit = min(crash limit, +ve FF limit) = min (2,10) = 2  Hence crash activity B by 2 days Acitivity (i,j) A(1, 3) B(1, 2) C(2, 3) D(3, 4) Critical - Yes Yes yes Free Float (FF) 10 - - -
Problem  … Critical path is still B, C, D Project completion time = 22 days Project cost = 810 + 2*35 = 880 1 2 3 4 A B C D 4 6 8 10 4 4 0 0 8, 0 4, 12 22 22 12 12 {FF=8} 4
Problem  … Since the crash limit for critical activity B is reached, consider critical activity C with the next lowest “crash cost per day” for crash.  The length by which C can be reduced is found as follows: Reduction limit = min(crash limit, +ve FF limit) = min(3,8)=3  Hence crash  activity C  by 3 days Acitivity (i,j) A(1, 3) B(1, 2) C(2, 3) D(3, 4) Critical - Yes Yes yes Free Float (FF) 8 - - -
Problem  … Critical path is still B, C, D Project completion time = 19 days Project cost = 880 + 3*40 = 1000 1 2 3 4 A B C D 4 6 8 10 4 4 0 0 5, 0 4, 9 19 19 9 9 {FF=5} 4 5
Problem  … Since the crash limit for critical activity C is reached, consider critical activity D with the next lowest “crash cost per day” for crash.  Although we can reduce D by 4 days, it is only necessary to reduce it by 1 day to reach our project completion goal of 18 days. Acitivity (i,j) A(1, 3) B(1, 2) C(2, 3) D(3, 4) Critical - Yes Yes yes Free Float (FF) 5 - - -
Problem  … Critical path is still B, C, D Project completion time = 18 days Project cost = 1000 + 1*45 = 1045 1 2 3 4 A B C D 4 6 8 9 4 4 0 0 5, 0 4, 9 18 18 9 9 {FF=5} 4 5
The Algorithm Schedule a project with all its activities at their normal duration.  Identify the critical path and the critical activities Calculate the “crash cost per day” for the different activities and rank the activities in the ascending order of cost slope. Crash the activities on the critical path as per the ranking, i.e., activity with lower cost slope would be crashed first to the maximum extent possible. As the critical path duration is reduced by the crashing in step 3, other paths may also become critical, i.e., we get parallel critical paths.  This means that project duration can be reduced duly by simultaneous crashing of activities in the parallel critical paths. Crashing as per steps 3 and 4, one reaches a point when further crashing is either not possible or does not result in the reduction of crashing of project duration. Compute the total project cost
Problem  … Draw the project network, Find the critical path, project completion time and the corresponding cost Assume the project deadline to be 10 days.  The company has to bear Rs. 170 for each day of delay.  Find the optimal number of days to crash the project. Activity Predecessor(s) Normal Time Normal Cost Cr. Cost per day Crash Time A - 4 400 125 3 B A 5 800 200 4 C A 4 520 150 2 D B 3 600 225 2 E C 3 255 100 2 F B, E 4 600 190 2
Problem  … 1 2 3 5 4 6 A B C E D F 4 5 4 3 3 4 0,0 4,4 8,8 11,11 9,11 15,15 FF = 3 FF = 2 FF = 0 Critical path is A, C, E, F Project completion time = 15 days Project cost = 400+800+520+600+255+600=3175
Problem  … Activity (i,j) Crash Limit (D – D ’ ) Crash Cost A(1, 2) 4 – 3 = 1 125 B(2,3) 5 – 4 = 1 200 C(2, 4) 4 – 2 = 2 150 D(3, 6) 3 – 2 = 1 225 E(4, 5) 3 – 2 = 1 100 F(5, 6) 4 – 2 = 2 190
Problem  … The two lowest “crash cost per day” critical activities E and A have crash limits  of 1 day each Reduction limit = min(crash limit, FF limit) = min(2,2)=2  Hence crash  activity E and A  by 1 day each Acitivity (i,j) A(1, 2) B(2,3) C(2, 4) D(3, 6) E(4, 5) F(5, 6) Dummy (3,5) Critical yes - Yes - yes yes - (FF) - 0 - 3 - 2
Problem  … Critical path is still A, C, E, F Project completion time = 13 days Project cost = 3175+100+125=3400 1 2 3 5 4 6 A B C E D F 4 5 4 3 3 4 0,0 3,3 8,9 13,13 FF = 2 FF = 1 FF = 0 3 2 7,7 9,9
Problem  … The next lowest “crash cost per day” critical activity is C The length by which C can be reduced is found as follows: Reduction limit = min(crash limit, FF limit) = min(2,1)=1  Hence crash  activity C  by 1 day Acitivity (i,j) A(1, 2) B(2,3) C(2, 4) D(3, 6) E(4, 5) F(5, 6) Dummy (3,5) Critical yes - Yes - yes yes - (FF) - 0 - 2 - 1
Problem  … There are two critical paths: A, C, E, F (old) and A, B, F  .  (new) Project completion time = 12 days Project cost = 3175+150=3550 1 2 3 5 4 6 A B C E D F 4 5 3 3 3 4 0,0 3,3 8,8 12,12 FF = 1 FF = 0 3 2 6,6 8,8 4
Problem  … A and E have reached their crash limits while C has 1 day remaining.  As there are two critical paths, the possible crashes are shown below: Acitivity (i,j) A(1, 2) B(2,3) C(2, 4) D(3, 6) E(4, 5) F(5, 6) Dummy (3,5) Critical yes yes Yes - yes yes yes (FF) - - - 1 - - Activity B, C F Crash cost/day 200, 150 190 Remaining crash limit 1, 1 1
Problem  … Alternative 1: reduce B and C Reduction limit = min(crash limit, FF limit) = min(1,1)=1  we can reduce B and C by 1 day each.  But the additional cost per day will be Rs. 350, which is more than cost of delay, Rs 170. Alternative 1: reduce B and C Reduction limit = min(crash limit, FF limit) = min(1,1)=1  we can reduce F by 1 day.  But the additional cost per day will  be Rs. 190  , which is more than cost of delay, Rs 170. Hence the previous step provides the optimal crashing solution: Project completion time = 12 days Cost of delay = (12-10) X 170 = 340 Project cost = 3550 + 340 = 3890

Critical Path Method

  • 1.
    Graph A graphG consists of two finite sets (sets having finitely many elements), a set V of points, called vertices, and a set E of connecting lines, called edges, such that each edge connects two vertices, called the endpoints of the edge, we write G = (V, E)
  • 2.
    Digraph & NetworkA diagraph (or directed graph) is a graph in which each edge (i,j) has a direction from its initial point i to its terminal point j. A graph containing closed circuits are called networks. A graph without closed circuits are called trees.
  • 3.
    Project Scheduling Aproject is a collection of inter-related activities with each activity consuming time and resources Critical Path Method (CPM) Deterministic Program Evaluation and Review Technique (PERT) Probabilistic
  • 4.
    Project Network Threetypes of information are needed to describe a project Activity information Precedence relationships Time information The (estimated) project duration equals the length of the longest path through the project network. This longest path is called the critical path.
  • 5.
    CPM/PERT Activity Anactivity is a task, or item of work to be done, that consumes time, effort, money or other resources. It is between two events, called the “preceding” and “succeeding” ones. Event An event represents the start (beg) or completion (end) of some activity and as such it consumes no time. Also, known as a node, it is not complete until all the activities flowing into it are completed. Predecessor activity An activity which must be completed before one or more other activities start.
  • 6.
    CPM/PERT Successor activityAn activity which started immediately after one or more of other activities are completed Dummy activity An activity which does not consume any resource or time. Critical activity An activity is critical, if the delay in its start will further delay the project completion time.. A non-critical activity allows some scheduling slack, so that the start time of the activity may be advanced or delayed within limits without affecting the completion date of the entire project
  • 7.
    CPM/PERT AOA (activity-on-arc)Nodes are “events” and arcs are “activities” leading to them AON (activity-on-node) Nodes are “activities” and arcs show the sequence/order
  • 8.
    Activity Slack (Float)Maximum time that an activity can be delayed without delaying the entire project Zero for those on critical path ES = Earliest start time calculated using “forward pass” ES j = max i {(ES i + time for activity a i,j )} for all i entering into j where i and j are nodes ES for last node is “project deadline” Latest completion time calculated using “backward pass” What’s the latest time for each node, keeping the deadline?
  • 9.
    Float …LC i = min j {(LC j - time for activity a i,j )} for all j leaving from i where i and j are nodes An activity (i, k) is said to be critical iff ES i = LC i ES k = LC k ES k - ES i = LC k – LC i = D i,k Total float is the time by which an activity can be delayed without delaying the project. TF i,k = LC k – ES i – D i,k Free float is that portion of the total float within which an activity can be manipulated without affecting the float of subsequent activities. FF i,k = ES k – ES i – D i,k
  • 10.
    Problem Construct anetwork diagram for a project consisting of the following activities: F and G are the terminal activities of the project Activity Predecessor(s) Time (days) A - 3 B - 4 C A,B 5 D B 6 E D 7 F C,E 8 G D 9
  • 11.
    Problem … Performthe following computations Start and completion time for each event Critical and non-critical activities Total float and free float times for activities Find the critical path Find the project completion time
  • 12.
    Project Network 1010 1 2 3 4 5 6 A C E B D F G 3 5 7 4 6 8 9 0 0 4 4 17 17 25 25 12 4 4, 3 9, 0 12, 4 17, 9 10, 16 25, 19
  • 13.
    Computations (Example) Criticalpath is 1  2  4  5  6 Activity (i,j) Dur. D i, j ES i LC j ES j Total Float LC j – ES i – D i,j Criti-cal Free Float ES j – ES i – D i,j A (1,3) 3 0 12 4 12 – 0 – 3 = 9 - 4 – 0 – 3 = 1 B (1,2) 4 0 4 4 4 – 0 – 4 = 0 Yes 4 – 0 – 4 = 0 C (3.5) 5 4 17 17 17 – 4 – 5 = 8 - 17 – 4 – 5 = 8 D (2,4) 6 4 10 10 10 – 4 – 6 = 0 Yes 10 – 4 – 6 = 0 E (4,5) 7 10 17 17 17 – 10 – 7 = 0 Yes 17 – 10 – 7 = 0 F (5,6) 8 17 25 25 25 – 17 – 8 = 0 Yes 25 – 17 – 8 = 0 G (4,6) 9 10 25 25 25 – 10 – 9 = 6 - 25 – 10 – 9 = 6
  • 14.
    Project Cost OptimizationDelay in project completion costs money Speeding up the project also costs money So, what is the perfect balance? Crashing an activity refers to taking special costly measures to reduce the duration of an activity below its normal value. These special measures might include using overtime, hiring additional temporary help, using special time saving materials, obtaining special equipment etc. The “normal” time for an activity can be reduced by using increased resources. The limit beyond which an activity time cannot be shortened is known as the “crash limit.”
  • 15.
    Project Cost Optimizationcontd… Crashing the project refers to crashing a number of activities in order to reduce the duration of the project below its normal value. The CPM method of time-cost trade-offs is concerned with determining how much (if any) to crash each of the activities in order to reduce the anticipated project completion time.
  • 16.
    Project Cost Optimizationcontd… The total project cost comprises direct and indirect costs. Direct costs are associated with the individual activities such as man-power loading, equipment utilized, materials consumed etc. in each activity. Indirect costs are those expenditures which cannot be allocated to individual activities of the project These may include administration or supervision costs, loss of revenue, fixed overheads, and so on. While indirect costs go up with the increase in project duration, direct costs go high as the time for individual activity is reduced.
  • 17.
    Problem Consider thefollowing arrow diagram with activity times given in days: The normal and crash data for this project are as follows: 1 2 3 4 A B C D 4 6 8 10 Activity Normal Time Crash Time Normal Cost Crash Cost A 4 3 80 105 B 6 4 180 250 C 8 5 200 320 D 10 6 350 530
  • 18.
    Problem …Find the critical path Find the project completion time and the corresponding cost If we want to complete the project in 18 days, find the best crash time and cost 1 2 3 4 A B C D 4 6 8 10 6 6 0 0 10, 0 4, 14 24 24 14 14 {FF=10}
  • 19.
    Problem …Critical path is B, C, D Project completion time = 24 days Project cost = 80 + 180 + 200 + 350 = 810 From the given data construct the following crash time-cost table Activity (i,j) Crash Limit (D – D ’ ) Crash Cost/day A(1, 3) 4 – 3 = 1 (105-80)/(4-3)=25 B(1, 2) 6 – 4 = 2 (250-180)/(6-4)=35 C(2, 3) 8 – 5 = 3 (320-200)/(8-5)=40 D(3, 4) 10 – 6 = 4 (530-350)/(10-6)=45
  • 20.
    Problem …From the critical path calculations, we have the following information: Since the critical activity B has the lowest “crash cost per day”, it becomes the first candidate for crash. The length by which B can be reduced is found as follows: Reduction limit = min(crash limit, +ve FF limit) = min (2,10) = 2 Hence crash activity B by 2 days Acitivity (i,j) A(1, 3) B(1, 2) C(2, 3) D(3, 4) Critical - Yes Yes yes Free Float (FF) 10 - - -
  • 21.
    Problem …Critical path is still B, C, D Project completion time = 22 days Project cost = 810 + 2*35 = 880 1 2 3 4 A B C D 4 6 8 10 4 4 0 0 8, 0 4, 12 22 22 12 12 {FF=8} 4
  • 22.
    Problem …Since the crash limit for critical activity B is reached, consider critical activity C with the next lowest “crash cost per day” for crash. The length by which C can be reduced is found as follows: Reduction limit = min(crash limit, +ve FF limit) = min(3,8)=3 Hence crash activity C by 3 days Acitivity (i,j) A(1, 3) B(1, 2) C(2, 3) D(3, 4) Critical - Yes Yes yes Free Float (FF) 8 - - -
  • 23.
    Problem …Critical path is still B, C, D Project completion time = 19 days Project cost = 880 + 3*40 = 1000 1 2 3 4 A B C D 4 6 8 10 4 4 0 0 5, 0 4, 9 19 19 9 9 {FF=5} 4 5
  • 24.
    Problem …Since the crash limit for critical activity C is reached, consider critical activity D with the next lowest “crash cost per day” for crash. Although we can reduce D by 4 days, it is only necessary to reduce it by 1 day to reach our project completion goal of 18 days. Acitivity (i,j) A(1, 3) B(1, 2) C(2, 3) D(3, 4) Critical - Yes Yes yes Free Float (FF) 5 - - -
  • 25.
    Problem …Critical path is still B, C, D Project completion time = 18 days Project cost = 1000 + 1*45 = 1045 1 2 3 4 A B C D 4 6 8 9 4 4 0 0 5, 0 4, 9 18 18 9 9 {FF=5} 4 5
  • 26.
    The Algorithm Schedulea project with all its activities at their normal duration. Identify the critical path and the critical activities Calculate the “crash cost per day” for the different activities and rank the activities in the ascending order of cost slope. Crash the activities on the critical path as per the ranking, i.e., activity with lower cost slope would be crashed first to the maximum extent possible. As the critical path duration is reduced by the crashing in step 3, other paths may also become critical, i.e., we get parallel critical paths. This means that project duration can be reduced duly by simultaneous crashing of activities in the parallel critical paths. Crashing as per steps 3 and 4, one reaches a point when further crashing is either not possible or does not result in the reduction of crashing of project duration. Compute the total project cost
  • 27.
    Problem …Draw the project network, Find the critical path, project completion time and the corresponding cost Assume the project deadline to be 10 days. The company has to bear Rs. 170 for each day of delay. Find the optimal number of days to crash the project. Activity Predecessor(s) Normal Time Normal Cost Cr. Cost per day Crash Time A - 4 400 125 3 B A 5 800 200 4 C A 4 520 150 2 D B 3 600 225 2 E C 3 255 100 2 F B, E 4 600 190 2
  • 28.
    Problem …1 2 3 5 4 6 A B C E D F 4 5 4 3 3 4 0,0 4,4 8,8 11,11 9,11 15,15 FF = 3 FF = 2 FF = 0 Critical path is A, C, E, F Project completion time = 15 days Project cost = 400+800+520+600+255+600=3175
  • 29.
    Problem …Activity (i,j) Crash Limit (D – D ’ ) Crash Cost A(1, 2) 4 – 3 = 1 125 B(2,3) 5 – 4 = 1 200 C(2, 4) 4 – 2 = 2 150 D(3, 6) 3 – 2 = 1 225 E(4, 5) 3 – 2 = 1 100 F(5, 6) 4 – 2 = 2 190
  • 30.
    Problem …The two lowest “crash cost per day” critical activities E and A have crash limits of 1 day each Reduction limit = min(crash limit, FF limit) = min(2,2)=2 Hence crash activity E and A by 1 day each Acitivity (i,j) A(1, 2) B(2,3) C(2, 4) D(3, 6) E(4, 5) F(5, 6) Dummy (3,5) Critical yes - Yes - yes yes - (FF) - 0 - 3 - 2
  • 31.
    Problem …Critical path is still A, C, E, F Project completion time = 13 days Project cost = 3175+100+125=3400 1 2 3 5 4 6 A B C E D F 4 5 4 3 3 4 0,0 3,3 8,9 13,13 FF = 2 FF = 1 FF = 0 3 2 7,7 9,9
  • 32.
    Problem …The next lowest “crash cost per day” critical activity is C The length by which C can be reduced is found as follows: Reduction limit = min(crash limit, FF limit) = min(2,1)=1 Hence crash activity C by 1 day Acitivity (i,j) A(1, 2) B(2,3) C(2, 4) D(3, 6) E(4, 5) F(5, 6) Dummy (3,5) Critical yes - Yes - yes yes - (FF) - 0 - 2 - 1
  • 33.
    Problem …There are two critical paths: A, C, E, F (old) and A, B, F . (new) Project completion time = 12 days Project cost = 3175+150=3550 1 2 3 5 4 6 A B C E D F 4 5 3 3 3 4 0,0 3,3 8,8 12,12 FF = 1 FF = 0 3 2 6,6 8,8 4
  • 34.
    Problem …A and E have reached their crash limits while C has 1 day remaining. As there are two critical paths, the possible crashes are shown below: Acitivity (i,j) A(1, 2) B(2,3) C(2, 4) D(3, 6) E(4, 5) F(5, 6) Dummy (3,5) Critical yes yes Yes - yes yes yes (FF) - - - 1 - - Activity B, C F Crash cost/day 200, 150 190 Remaining crash limit 1, 1 1
  • 35.
    Problem …Alternative 1: reduce B and C Reduction limit = min(crash limit, FF limit) = min(1,1)=1 we can reduce B and C by 1 day each. But the additional cost per day will be Rs. 350, which is more than cost of delay, Rs 170. Alternative 1: reduce B and C Reduction limit = min(crash limit, FF limit) = min(1,1)=1 we can reduce F by 1 day. But the additional cost per day will be Rs. 190 , which is more than cost of delay, Rs 170. Hence the previous step provides the optimal crashing solution: Project completion time = 12 days Cost of delay = (12-10) X 170 = 340 Project cost = 3550 + 340 = 3890