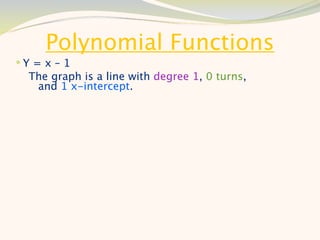
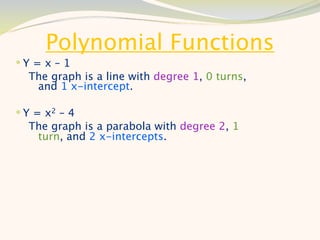
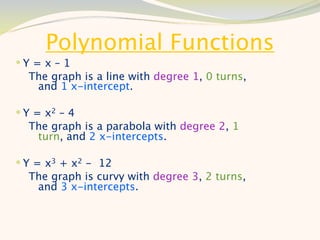
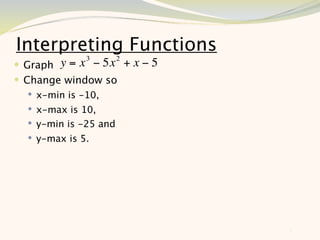
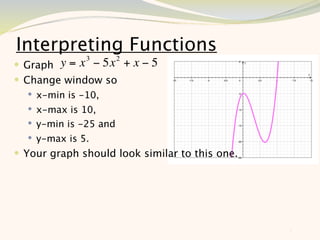
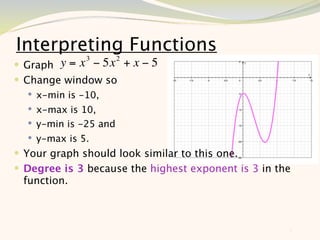
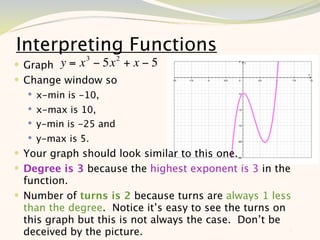
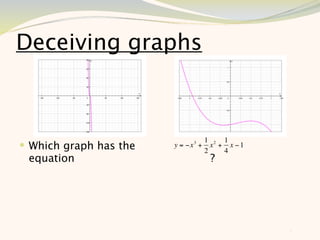
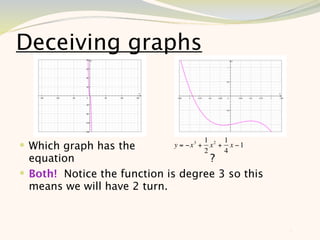
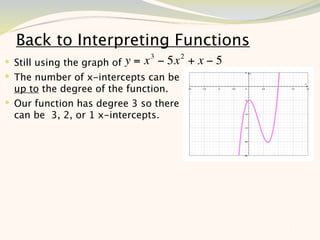
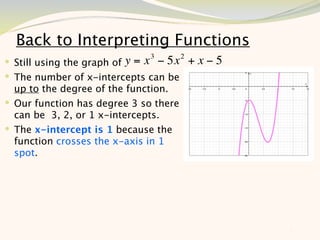
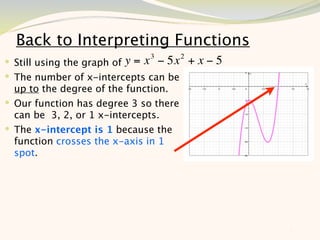
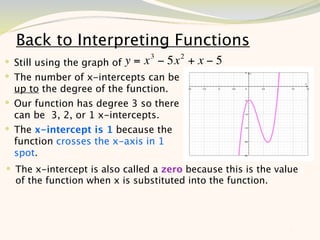
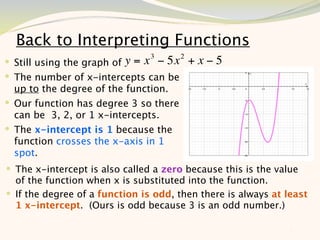
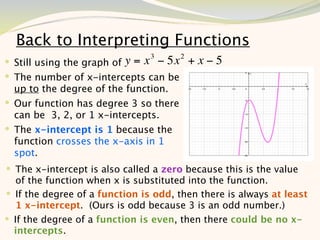
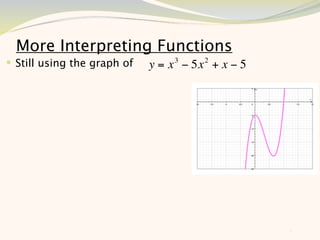
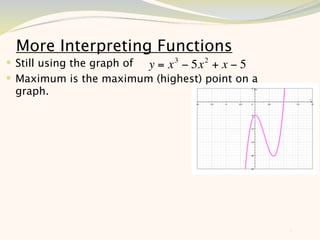
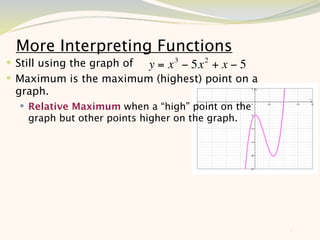
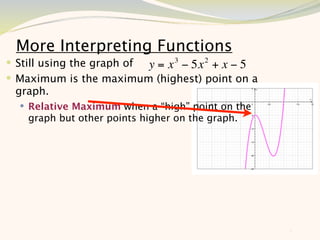
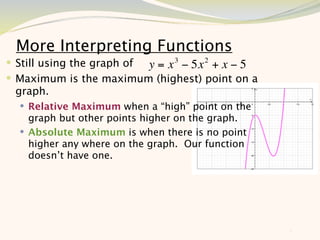
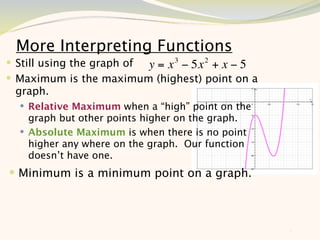
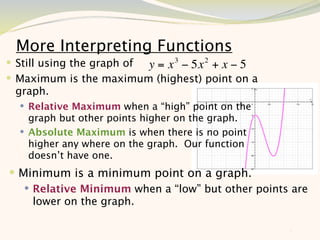
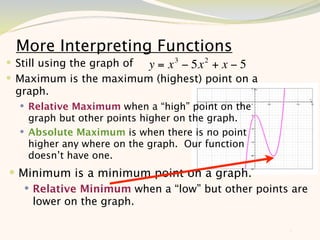
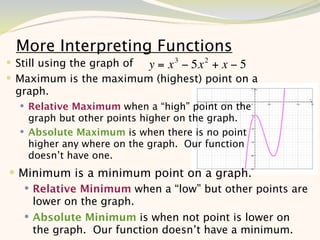
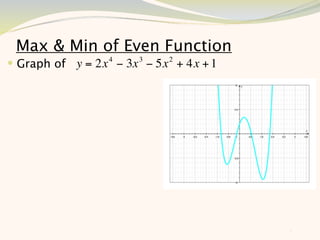
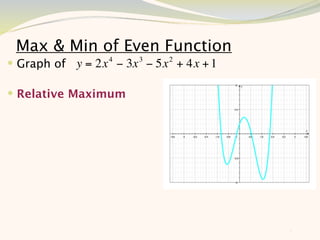
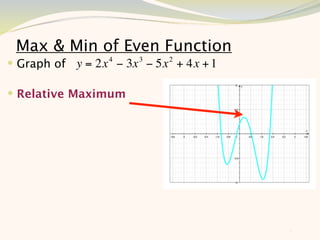
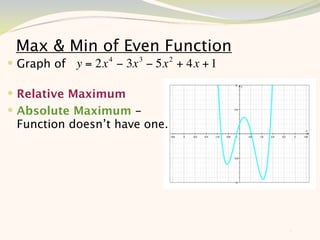
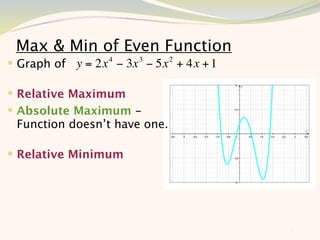
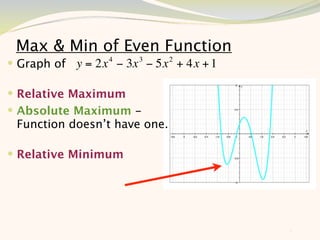
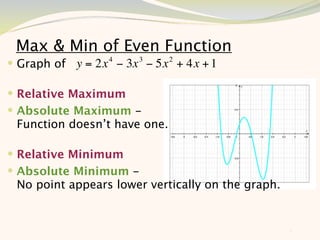
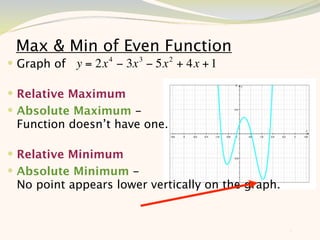
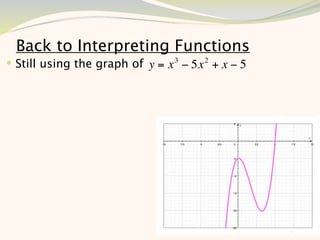
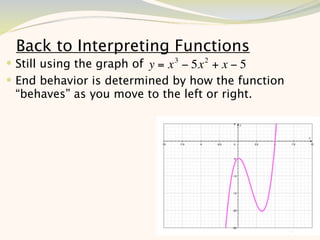
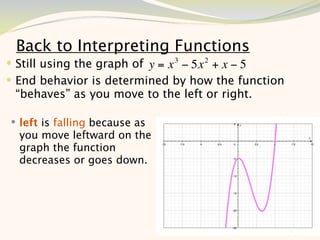
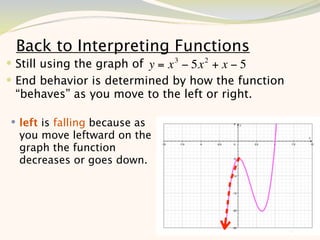
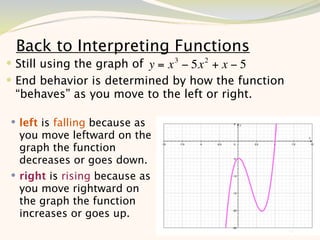
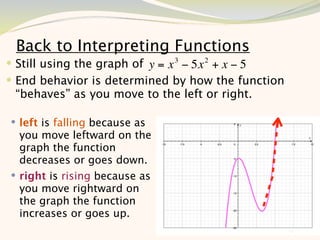
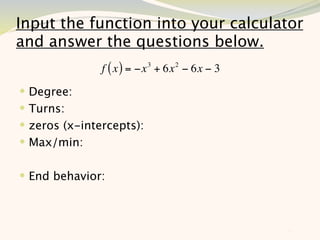
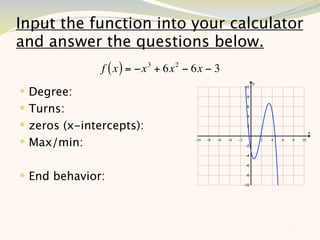
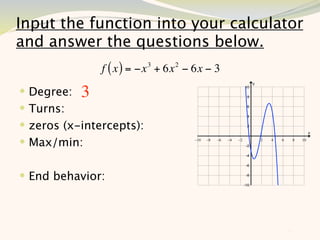
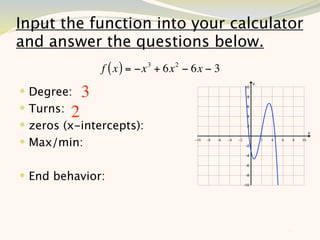
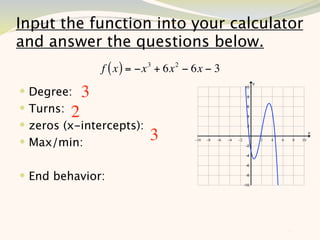
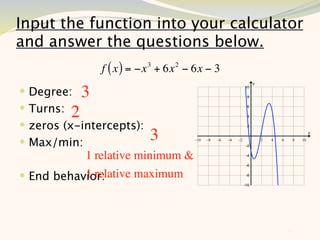
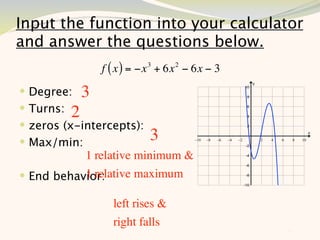
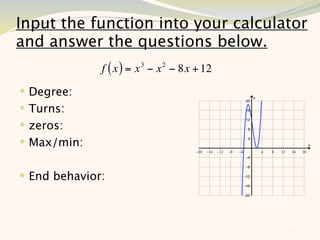
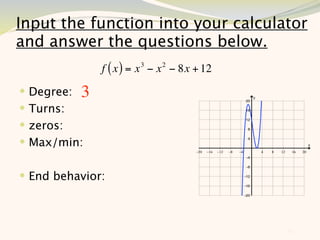
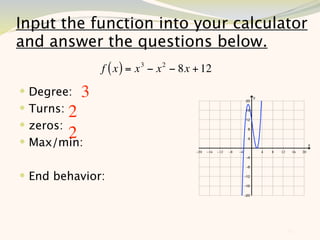
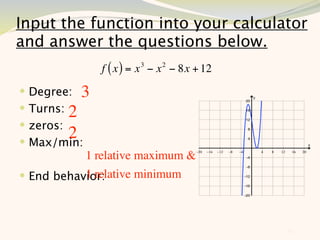
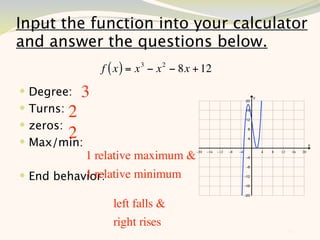
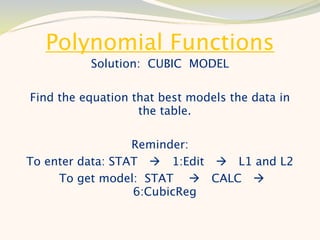
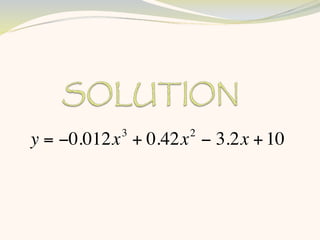
Polynomial Functions
Using a graphing calculator , graph each equation
 below separately.
Polynomial Functions
Using a graphing calculator , graph each equation
  below separately.
1. Note and Similarities and Differences
Polynomial Functions
Using a graphing calculator , graph each equation
  below separately.
1. Note and Similarities and Differences
2. Compare the number of x-intercepts, number
  of turns, and the degree of the polynomial.
  Y=x-1
   Y = x2 - 4
   Y = x3 + x2 - 12
Polynomial Functions
Y = x – 1
  The graph is a line with degree 1, 0 turns,
   and 1 x-intercept.
Polynomial Functions
Y = x – 1
  The graph is a line with degree 1, 0 turns,
   and 1 x-intercept.

 Y = x2 – 4
  The graph is a parabola with degree 2, 1
   turn, and 2 x-intercepts.
Polynomial Functions
Y = x – 1
  The graph is a line with degree 1, 0 turns,
   and 1 x-intercept.

 Y = x2 – 4
  The graph is a parabola with degree 2, 1
   turn, and 2 x-intercepts.

 Y = x3 + x2 - 12
  The graph is curvy with degree 3, 2 turns,
   and 3 x-intercepts.
Exploring Graphs of
   Polynomial Functions
Use the link below to explore an interactive Gizmo
 to see how the graph changes as you change the
                      coefficients
          of the cubic (degree 3) function.

      EXPLORING GRAPHS OF POLYNOMIALS
Interpreting Functions
   Graph y = x 3 − 5x 2 + x − 5


                                   5
Interpreting Functions
   Graph y = x 3 − 5x 2 + x − 5
 Change window so
     x-min is -10,
     x-max is 10,
     y-min is -25 and
     y-max is 5.


                                   5
Interpreting Functions
   Graph y = x 3 − 5x 2 + x − 5
 Change window so
     x-min is -10,
     x-max is 10,
     y-min is -25 and
     y-max is 5.
 Your graph should look similar to this one.


                                                5
Interpreting Functions
   Graph y = x 3 − 5x 2 + x − 5
 Change window so
     x-min is -10,
     x-max is 10,
     y-min is -25 and
     y-max is 5.
 Your graph should look similar to this one.
 Degree is 3 because the highest exponent is 3 in the
    function.


                                                     5
Interpreting Functions
   Graph y = x 3 − 5x 2 + x − 5
 Change window so
     x-min is -10,
     x-max is 10,
     y-min is -25 and
     y-max is 5.
 Your graph should look similar to this one.
 Degree is 3 because the highest exponent is 3 in the
  function.
 Number of turns is 2 because turns are always 1 less
  than the degree. Notice it’s easy to see the turns on
  this graph but this is not always the case. Don’t be
  deceived by the picture.                              5
Deceiving graphs


                                     1 2 1
 Which graph has the   y = −x 3 +
                                     2
                                       x + x −1
                                          4
 equation                             ?


                                                  6
Deceiving graphs


                                          1 2 1
 Which graph has the        y = −x 3 +
                                          2
                                            x + x −1
                                               4
  equation                          ?
 Both! Notice the function is degree 3 so this
  means we will have 2 turn.


                                                       6
Deceiving graphs


                                           1 2 1
 Which graph has the         y = −x 3 +
                                           2
                                             x + x −1
                                                4
  equation                           ?
 Both! Notice the function is degree 3 so this
  means we will have 2 turn.
 The graph on the left doesn’t look like there are 2
  turns but the graph on the right does.
                                                        6
Deceiving graphs


                                          1 2 1
 Which graph has the        y = −x 3 +
                                          2
                                            x + x −1
                                               4
  equation                           ?
 Both! Notice the function is degree 3 so this
  means we will have 2 turn.
 The graph on the left doesn’t look like there are 2
  turns but the graph on the right does.
 Don’t rely on the graph because it can be deceiving!
                                                     6
Back to Interpreting Functions
                                 3     2
 Still using the graph of   y = x − 5x + x − 5


                                                  7
Back to Interpreting Functions
                               3        2
 Still using the graph of y = x − 5x       +x−5
 The number of x-intercepts can be
  up to the degree of the function.


                                                   7
Back to Interpreting Functions
                               3        2
 Still using the graph of y = x − 5x       +x−5
 The number of x-intercepts can be
  up to the degree of the function.
 Our function has degree 3 so there
  can be 3, 2, or 1 x-intercepts.
 The x-intercept is 1 because the
  function crosses the x-axis in 1
  spot.


                                                   7
Back to Interpreting Functions
                                3       2
 Still using the graph of y = x − 5x       +x−5
 The number of x-intercepts can be
  up to the degree of the function.
 Our function has degree 3 so there
  can be 3, 2, or 1 x-intercepts.
 The x-intercept is 1 because the
  function crosses the x-axis in 1
  spot.
 The x-intercept is also called a zero because this is the value
  of the function when x is substituted into the function.


                                                              7
Back to Interpreting Functions
                                3       2
 Still using the graph of y = x − 5x       +x−5
 The number of x-intercepts can be
  up to the degree of the function.
 Our function has degree 3 so there
  can be 3, 2, or 1 x-intercepts.
 The x-intercept is 1 because the
  function crosses the x-axis in 1
  spot.
 The x-intercept is also called a zero because this is the value
  of the function when x is substituted into the function.
 If the degree of a function is odd, then there is always at least
  1 x-intercept. (Ours is odd because 3 is an odd number.)

                                                              7
Back to Interpreting Functions
                                3       2
 Still using the graph of y = x − 5x       +x−5
 The number of x-intercepts can be
  up to the degree of the function.
 Our function has degree 3 so there
  can be 3, 2, or 1 x-intercepts.
 The x-intercept is 1 because the
  function crosses the x-axis in 1
  spot.
 The x-intercept is also called a zero because this is the value
   of the function when x is substituted into the function.
 If the degree of a function is odd, then there is always at least
   1 x-intercept. (Ours is odd because 3 is an odd number.)
 If the degree of a function is even, then there could be no x-
  intercepts.                                                  7
More Interpreting Functions
 Still using the graph of   y = x 3 − 5x 2 + x − 5


                                                      8
More Interpreting Functions
 Still using the graph of y = x 3 − 5x 2 + x − 5
 Maximum is the maximum (highest) point on a
 graph.


                                                    8
More Interpreting Functions
 Still using the graph of y = x 3 − 5x 2 + x − 5
 Maximum is the maximum (highest) point on a
 graph.
   Relative Maximum when a “high” point on the
    graph but other points higher on the graph.


                                                    8
More Interpreting Functions
 Still using the graph of y = x 3 − 5x 2 + x − 5
 Maximum is the maximum (highest) point on a
 graph.
   Relative Maximum when a “high” point on the
    graph but other points higher on the graph.


                                                    8
More Interpreting Functions
 Still using the graph of y = x 3 − 5x 2 + x − 5
 Maximum is the maximum (highest) point on a
 graph.
   Relative Maximum when a “high” point on the
    graph but other points higher on the graph.
   Absolute Maximum is when there is no point
    higher any where on the graph. Our function
    doesn’t have one.
 Minimum is a minimum point on a graph.
    Relative Minimum when a “low” but other points are
     lower on the graph.
    Absolute Minimum is when not point is lower on
     the graph. Our function doesn’t have a minimum.
                                                   8
Max & Min of Even Function
 Graph of y = 2x 4 − 3x 3 − 5x 2 + 4x + 1


                                             9
Max & Min of Even Function
 Graph of y = 2x 4 − 3x 3 − 5x 2 + 4x + 1

 Relative Maximum


                                             9
Max & Min of Even Function
 Graph of y = 2x 4 − 3x 3 − 5x 2 + 4x + 1

 Relative Maximum


                                             9
Max & Min of Even Function
 Graph of y = 2x 4 − 3x 3 − 5x 2 + 4x + 1

 Relative Maximum
 Absolute Maximum -
 Function doesn’t have one.


                                             9
Max & Min of Even Function
 Graph of y = 2x 4 − 3x 3 − 5x 2 + 4x + 1

 Relative Maximum
 Absolute Maximum -
 Function doesn’t have one.

 Relative Minimum


                                             9
Max & Min of Even Function
 Graph of y = 2x 4 − 3x 3 − 5x 2 + 4x + 1

 Relative Maximum
 Absolute Maximum -
 Function doesn’t have one.

 Relative Minimum


                                             9
Max & Min of Even Function
 Graph of y = 2x 4 − 3x 3 − 5x 2 + 4x + 1

 Relative Maximum
 Absolute Maximum -
 Function doesn’t have one.

 Relative Minimum
 Absolute Minimum -
 No point appears lower vertically on the graph.


                                                   9
Max & Min of Even Function
 Graph of y = 2x 4 − 3x 3 − 5x 2 + 4x + 1

 Relative Maximum
 Absolute Maximum -
 Function doesn’t have one.

 Relative Minimum
 Absolute Minimum -
 No point appears lower vertically on the graph.


                                                   9
Back to Interpreting Functions
 Still using the graph of y = x 3 − 5x 2 + x − 5


                                                    10
Back to Interpreting Functions
 Still using the graph of y = x 3 − 5x 2 + x − 5
 End behavior is determined by how the function
 “behaves” as you move to the left or right.


                                                    10
Back to Interpreting Functions
 Still using the graph of y = x 3 − 5x 2 + x − 5
 End behavior is determined by how the function
 “behaves” as you move to the left or right.

 left is falling because as
  you move leftward on the
  graph the function
  decreases or goes down.
 right is rising because as
  you move rightward on
  the graph the function
  increases or goes up.
                                                    10
Input the function into your calculator
and answer the questions below.
               f ( x ) = −x 3 + 6x 2 − 6x − 3
 Degree:
 Turns:
 zeros (x-intercepts):
 Max/min:


 End behavior:


                                                11
Input the function into your calculator
and answer the questions below.
               f ( x ) = −x 3 + 6x 2 − 6x − 3
 Degree:
 Turns:
 zeros (x-intercepts):
 Max/min:


 End behavior:


                                                11
Input the function into your calculator
and answer the questions below.
                f ( x ) = −x 3 + 6x 2 − 6x − 3
 Degree:   3
 Turns:
 zeros (x-intercepts):
 Max/min:


 End behavior:


                                                 11
Input the function into your calculator
and answer the questions below.
               f ( x ) = −x 3 + 6x 2 − 6x − 3
 Degree: 3
 Turns: 2
 zeros (x-intercepts):
 Max/min:


 End behavior:


                                                11
Input the function into your calculator
and answer the questions below.
               f ( x ) = −x 3 + 6x 2 − 6x − 3
 Degree: 3
 Turns: 2
 zeros (x-intercepts):
 Max/min:                 3

 End behavior:


                                                11
Input the function into your calculator
and answer the questions below.
               f ( x ) = −x 3 + 6x 2 − 6x − 3
 Degree: 3
 Turns: 2
 zeros (x-intercepts):
 Max/min:                 3
           1 relative minimum &
           1 relative maximum
 End behavior:

                 left rises &
                 right falls
                                                11
Input the function into your calculator
and answer the questions below.
              f ( x ) = x 3 − x 2 − 8x + 12
 Degree:
 Turns:
 zeros:
 Max/min:


 End behavior:


                                              12
Input the function into your calculator
and answer the questions below.
                f ( x ) = x 3 − x 2 − 8x + 12
 Degree:   3
 Turns:
 zeros:
 Max/min:


 End behavior:


                                                12
Input the function into your calculator
and answer the questions below.
                f ( x ) = x 3 − x 2 − 8x + 12
 Degree:   3
 Turns:2
 zeros:
 Max/min:


 End behavior:


                                                12
Input the function into your calculator
and answer the questions below.
                f ( x ) = x 3 − x 2 − 8x + 12
 Degree:   3
 Turns: 2
 zeros:
         2
 Max/min:


 End behavior:


                                                12
Input the function into your calculator
and answer the questions below.
                f ( x ) = x 3 − x 2 − 8x + 12
 Degree:   3
 Turns: 2
 zeros:
         2
 Max/min:
             1 relative maximum &
           1 relative minimum
 End behavior:

                   left falls &
                   right rises
                                                12
Comparing Models
Comparing Models
You have looked at best-fit models of linear and
 quadratic functions in previous Modules.
 Sometimes you can fit data more closely by
 using a polynomial model of degree 3 or
 greater.
Comparing Models
You have looked at best-fit models of linear and
 quadratic functions in previous Modules.
 Sometimes you can fit data more closely by
 using a polynomial model of degree 3 or
 greater.

  Watch the video below on modeling functions.
                     VIDEO1
Comparing Models
You have looked at best-fit models of linear and
 quadratic functions in previous Modules.
 Sometimes you can fit data more closely by
 using a polynomial model of degree 3 or
 greater.

  Watch the video below on modeling functions.
                     VIDEO1
                    VIDEO 2

   Now let’s practice finding our own models!
Modeling Polynomial
        Functions
Sketch a graph and visually determine which
  model is a better fit? Linear, Quadratic or
                    Cubic?
                 X      Y

                  0     10
                  5     3

                 10     8

                 15     16

                 20     18
Polynomial Functions
          Solution: CUBIC MODEL

Find the equation that best models the data in
                   the table.
Polynomial Functions
          Solution: CUBIC MODEL

Find the equation that best models the data in
                   the table.

                  Reminder:
To enter data: STAT  1:Edit  L1 and L2
     To get model: STAT  CALC 
                  6:CubicReg
Polynomial Functions
          Solution: CUBIC MODEL

Find the equation that best models the data in
                   the table.

                  Reminder:
To enter data: STAT  1:Edit  L1 and L2
     To get model: STAT  CALC 
                  6:CubicReg
3       2
y = −0.012x + 0.42x − 3.2x + 10
You finished the notes!

Please complete the
    Assignment.

Notes - Graphs of Polynomials

  • 2.
    Polynomial Functions Using agraphing calculator , graph each equation below separately.
  • 3.
    Polynomial Functions Using agraphing calculator , graph each equation below separately. 1. Note and Similarities and Differences
  • 4.
    Polynomial Functions Using agraphing calculator , graph each equation below separately. 1. Note and Similarities and Differences 2. Compare the number of x-intercepts, number of turns, and the degree of the polynomial. Y=x-1  Y = x2 - 4  Y = x3 + x2 - 12
  • 5.
  • 6.
    Polynomial Functions Y =x – 1 The graph is a line with degree 1, 0 turns, and 1 x-intercept.
  • 7.
    Polynomial Functions Y =x – 1 The graph is a line with degree 1, 0 turns, and 1 x-intercept.  Y = x2 – 4 The graph is a parabola with degree 2, 1 turn, and 2 x-intercepts.
  • 8.
    Polynomial Functions Y =x – 1 The graph is a line with degree 1, 0 turns, and 1 x-intercept.  Y = x2 – 4 The graph is a parabola with degree 2, 1 turn, and 2 x-intercepts.  Y = x3 + x2 - 12 The graph is curvy with degree 3, 2 turns, and 3 x-intercepts.
  • 9.
    Exploring Graphs of Polynomial Functions Use the link below to explore an interactive Gizmo to see how the graph changes as you change the coefficients of the cubic (degree 3) function. EXPLORING GRAPHS OF POLYNOMIALS
  • 10.
    Interpreting Functions  Graph y = x 3 − 5x 2 + x − 5 5
  • 11.
    Interpreting Functions  Graph y = x 3 − 5x 2 + x − 5  Change window so  x-min is -10,  x-max is 10,  y-min is -25 and  y-max is 5. 5
  • 12.
    Interpreting Functions  Graph y = x 3 − 5x 2 + x − 5  Change window so  x-min is -10,  x-max is 10,  y-min is -25 and  y-max is 5.  Your graph should look similar to this one. 5
  • 13.
    Interpreting Functions  Graph y = x 3 − 5x 2 + x − 5  Change window so  x-min is -10,  x-max is 10,  y-min is -25 and  y-max is 5.  Your graph should look similar to this one.  Degree is 3 because the highest exponent is 3 in the function. 5
  • 14.
    Interpreting Functions  Graph y = x 3 − 5x 2 + x − 5  Change window so  x-min is -10,  x-max is 10,  y-min is -25 and  y-max is 5.  Your graph should look similar to this one.  Degree is 3 because the highest exponent is 3 in the function.  Number of turns is 2 because turns are always 1 less than the degree. Notice it’s easy to see the turns on this graph but this is not always the case. Don’t be deceived by the picture. 5
  • 15.
    Deceiving graphs 1 2 1  Which graph has the y = −x 3 + 2 x + x −1 4 equation ? 6
  • 16.
    Deceiving graphs 1 2 1  Which graph has the y = −x 3 + 2 x + x −1 4 equation ?  Both! Notice the function is degree 3 so this means we will have 2 turn. 6
  • 17.
    Deceiving graphs 1 2 1  Which graph has the y = −x 3 + 2 x + x −1 4 equation ?  Both! Notice the function is degree 3 so this means we will have 2 turn.  The graph on the left doesn’t look like there are 2 turns but the graph on the right does. 6
  • 18.
    Deceiving graphs 1 2 1  Which graph has the y = −x 3 + 2 x + x −1 4 equation ?  Both! Notice the function is degree 3 so this means we will have 2 turn.  The graph on the left doesn’t look like there are 2 turns but the graph on the right does.  Don’t rely on the graph because it can be deceiving! 6
  • 19.
    Back to InterpretingFunctions 3 2  Still using the graph of y = x − 5x + x − 5 7
  • 20.
    Back to InterpretingFunctions 3 2  Still using the graph of y = x − 5x +x−5  The number of x-intercepts can be up to the degree of the function. 7
  • 21.
    Back to InterpretingFunctions 3 2  Still using the graph of y = x − 5x +x−5  The number of x-intercepts can be up to the degree of the function.  Our function has degree 3 so there can be 3, 2, or 1 x-intercepts. 7
  • 22.
    Back to InterpretingFunctions 3 2  Still using the graph of y = x − 5x +x−5  The number of x-intercepts can be up to the degree of the function.  Our function has degree 3 so there can be 3, 2, or 1 x-intercepts.  The x-intercept is 1 because the function crosses the x-axis in 1 spot. 7
  • 23.
    Back to InterpretingFunctions 3 2  Still using the graph of y = x − 5x +x−5  The number of x-intercepts can be up to the degree of the function.  Our function has degree 3 so there can be 3, 2, or 1 x-intercepts.  The x-intercept is 1 because the function crosses the x-axis in 1 spot. 7
  • 24.
    Back to InterpretingFunctions 3 2  Still using the graph of y = x − 5x +x−5  The number of x-intercepts can be up to the degree of the function.  Our function has degree 3 so there can be 3, 2, or 1 x-intercepts.  The x-intercept is 1 because the function crosses the x-axis in 1 spot.  The x-intercept is also called a zero because this is the value of the function when x is substituted into the function. 7
  • 25.
    Back to InterpretingFunctions 3 2  Still using the graph of y = x − 5x +x−5  The number of x-intercepts can be up to the degree of the function.  Our function has degree 3 so there can be 3, 2, or 1 x-intercepts.  The x-intercept is 1 because the function crosses the x-axis in 1 spot.  The x-intercept is also called a zero because this is the value of the function when x is substituted into the function.  If the degree of a function is odd, then there is always at least 1 x-intercept. (Ours is odd because 3 is an odd number.) 7
  • 26.
    Back to InterpretingFunctions 3 2  Still using the graph of y = x − 5x +x−5  The number of x-intercepts can be up to the degree of the function.  Our function has degree 3 so there can be 3, 2, or 1 x-intercepts.  The x-intercept is 1 because the function crosses the x-axis in 1 spot.  The x-intercept is also called a zero because this is the value of the function when x is substituted into the function.  If the degree of a function is odd, then there is always at least 1 x-intercept. (Ours is odd because 3 is an odd number.)  If the degree of a function is even, then there could be no x- intercepts. 7
  • 27.
    More Interpreting Functions Still using the graph of y = x 3 − 5x 2 + x − 5 8
  • 28.
    More Interpreting Functions Still using the graph of y = x 3 − 5x 2 + x − 5  Maximum is the maximum (highest) point on a graph. 8
  • 29.
    More Interpreting Functions Still using the graph of y = x 3 − 5x 2 + x − 5  Maximum is the maximum (highest) point on a graph.  Relative Maximum when a “high” point on the graph but other points higher on the graph. 8
  • 30.
    More Interpreting Functions Still using the graph of y = x 3 − 5x 2 + x − 5  Maximum is the maximum (highest) point on a graph.  Relative Maximum when a “high” point on the graph but other points higher on the graph. 8
  • 31.
    More Interpreting Functions Still using the graph of y = x 3 − 5x 2 + x − 5  Maximum is the maximum (highest) point on a graph.  Relative Maximum when a “high” point on the graph but other points higher on the graph.  Absolute Maximum is when there is no point higher any where on the graph. Our function doesn’t have one. 8
  • 32.
    More Interpreting Functions Still using the graph of y = x 3 − 5x 2 + x − 5  Maximum is the maximum (highest) point on a graph.  Relative Maximum when a “high” point on the graph but other points higher on the graph.  Absolute Maximum is when there is no point higher any where on the graph. Our function doesn’t have one.  Minimum is a minimum point on a graph. 8
  • 33.
    More Interpreting Functions Still using the graph of y = x 3 − 5x 2 + x − 5  Maximum is the maximum (highest) point on a graph.  Relative Maximum when a “high” point on the graph but other points higher on the graph.  Absolute Maximum is when there is no point higher any where on the graph. Our function doesn’t have one.  Minimum is a minimum point on a graph.  Relative Minimum when a “low” but other points are lower on the graph. 8
  • 34.
    More Interpreting Functions Still using the graph of y = x 3 − 5x 2 + x − 5  Maximum is the maximum (highest) point on a graph.  Relative Maximum when a “high” point on the graph but other points higher on the graph.  Absolute Maximum is when there is no point higher any where on the graph. Our function doesn’t have one.  Minimum is a minimum point on a graph.  Relative Minimum when a “low” but other points are lower on the graph. 8
  • 35.
    More Interpreting Functions Still using the graph of y = x 3 − 5x 2 + x − 5  Maximum is the maximum (highest) point on a graph.  Relative Maximum when a “high” point on the graph but other points higher on the graph.  Absolute Maximum is when there is no point higher any where on the graph. Our function doesn’t have one.  Minimum is a minimum point on a graph.  Relative Minimum when a “low” but other points are lower on the graph.  Absolute Minimum is when not point is lower on the graph. Our function doesn’t have a minimum. 8
  • 36.
    Max & Minof Even Function  Graph of y = 2x 4 − 3x 3 − 5x 2 + 4x + 1 9
  • 37.
    Max & Minof Even Function  Graph of y = 2x 4 − 3x 3 − 5x 2 + 4x + 1  Relative Maximum 9
  • 38.
    Max & Minof Even Function  Graph of y = 2x 4 − 3x 3 − 5x 2 + 4x + 1  Relative Maximum 9
  • 39.
    Max & Minof Even Function  Graph of y = 2x 4 − 3x 3 − 5x 2 + 4x + 1  Relative Maximum  Absolute Maximum - Function doesn’t have one. 9
  • 40.
    Max & Minof Even Function  Graph of y = 2x 4 − 3x 3 − 5x 2 + 4x + 1  Relative Maximum  Absolute Maximum - Function doesn’t have one.  Relative Minimum 9
  • 41.
    Max & Minof Even Function  Graph of y = 2x 4 − 3x 3 − 5x 2 + 4x + 1  Relative Maximum  Absolute Maximum - Function doesn’t have one.  Relative Minimum 9
  • 42.
    Max & Minof Even Function  Graph of y = 2x 4 − 3x 3 − 5x 2 + 4x + 1  Relative Maximum  Absolute Maximum - Function doesn’t have one.  Relative Minimum  Absolute Minimum - No point appears lower vertically on the graph. 9
  • 43.
    Max & Minof Even Function  Graph of y = 2x 4 − 3x 3 − 5x 2 + 4x + 1  Relative Maximum  Absolute Maximum - Function doesn’t have one.  Relative Minimum  Absolute Minimum - No point appears lower vertically on the graph. 9
  • 44.
    Back to InterpretingFunctions  Still using the graph of y = x 3 − 5x 2 + x − 5 10
  • 45.
    Back to InterpretingFunctions  Still using the graph of y = x 3 − 5x 2 + x − 5  End behavior is determined by how the function “behaves” as you move to the left or right. 10
  • 46.
    Back to InterpretingFunctions  Still using the graph of y = x 3 − 5x 2 + x − 5  End behavior is determined by how the function “behaves” as you move to the left or right.  left is falling because as you move leftward on the graph the function decreases or goes down. 10
  • 47.
    Back to InterpretingFunctions  Still using the graph of y = x 3 − 5x 2 + x − 5  End behavior is determined by how the function “behaves” as you move to the left or right.  left is falling because as you move leftward on the graph the function decreases or goes down. 10
  • 48.
    Back to InterpretingFunctions  Still using the graph of y = x 3 − 5x 2 + x − 5  End behavior is determined by how the function “behaves” as you move to the left or right.  left is falling because as you move leftward on the graph the function decreases or goes down.  right is rising because as you move rightward on the graph the function increases or goes up. 10
  • 49.
    Back to InterpretingFunctions  Still using the graph of y = x 3 − 5x 2 + x − 5  End behavior is determined by how the function “behaves” as you move to the left or right.  left is falling because as you move leftward on the graph the function decreases or goes down.  right is rising because as you move rightward on the graph the function increases or goes up. 10
  • 50.
    Input the functioninto your calculator and answer the questions below. f ( x ) = −x 3 + 6x 2 − 6x − 3  Degree:  Turns:  zeros (x-intercepts):  Max/min:  End behavior: 11
  • 51.
    Input the functioninto your calculator and answer the questions below. f ( x ) = −x 3 + 6x 2 − 6x − 3  Degree:  Turns:  zeros (x-intercepts):  Max/min:  End behavior: 11
  • 52.
    Input the functioninto your calculator and answer the questions below. f ( x ) = −x 3 + 6x 2 − 6x − 3  Degree: 3  Turns:  zeros (x-intercepts):  Max/min:  End behavior: 11
  • 53.
    Input the functioninto your calculator and answer the questions below. f ( x ) = −x 3 + 6x 2 − 6x − 3  Degree: 3  Turns: 2  zeros (x-intercepts):  Max/min:  End behavior: 11
  • 54.
    Input the functioninto your calculator and answer the questions below. f ( x ) = −x 3 + 6x 2 − 6x − 3  Degree: 3  Turns: 2  zeros (x-intercepts):  Max/min: 3  End behavior: 11
  • 55.
    Input the functioninto your calculator and answer the questions below. f ( x ) = −x 3 + 6x 2 − 6x − 3  Degree: 3  Turns: 2  zeros (x-intercepts):  Max/min: 3 1 relative minimum & 1 relative maximum  End behavior: 11
  • 56.
    Input the functioninto your calculator and answer the questions below. f ( x ) = −x 3 + 6x 2 − 6x − 3  Degree: 3  Turns: 2  zeros (x-intercepts):  Max/min: 3 1 relative minimum & 1 relative maximum  End behavior: left rises & right falls 11
  • 57.
    Input the functioninto your calculator and answer the questions below. f ( x ) = x 3 − x 2 − 8x + 12  Degree:  Turns:  zeros:  Max/min:  End behavior: 12
  • 58.
    Input the functioninto your calculator and answer the questions below. f ( x ) = x 3 − x 2 − 8x + 12  Degree: 3  Turns:  zeros:  Max/min:  End behavior: 12
  • 59.
    Input the functioninto your calculator and answer the questions below. f ( x ) = x 3 − x 2 − 8x + 12  Degree: 3  Turns:2  zeros:  Max/min:  End behavior: 12
  • 60.
    Input the functioninto your calculator and answer the questions below. f ( x ) = x 3 − x 2 − 8x + 12  Degree: 3  Turns: 2  zeros: 2  Max/min:  End behavior: 12
  • 61.
    Input the functioninto your calculator and answer the questions below. f ( x ) = x 3 − x 2 − 8x + 12  Degree: 3  Turns: 2  zeros: 2  Max/min: 1 relative maximum & 1 relative minimum  End behavior: 12
  • 62.
    Input the functioninto your calculator and answer the questions below. f ( x ) = x 3 − x 2 − 8x + 12  Degree: 3  Turns: 2  zeros: 2  Max/min: 1 relative maximum & 1 relative minimum  End behavior: left falls & right rises 12
  • 63.
  • 64.
    Comparing Models You havelooked at best-fit models of linear and quadratic functions in previous Modules. Sometimes you can fit data more closely by using a polynomial model of degree 3 or greater.
  • 65.
    Comparing Models You havelooked at best-fit models of linear and quadratic functions in previous Modules. Sometimes you can fit data more closely by using a polynomial model of degree 3 or greater. Watch the video below on modeling functions. VIDEO1
  • 66.
    Comparing Models You havelooked at best-fit models of linear and quadratic functions in previous Modules. Sometimes you can fit data more closely by using a polynomial model of degree 3 or greater. Watch the video below on modeling functions. VIDEO1 VIDEO 2
  • 67.
    Comparing Models You havelooked at best-fit models of linear and quadratic functions in previous Modules. Sometimes you can fit data more closely by using a polynomial model of degree 3 or greater. Watch the video below on modeling functions. VIDEO1 VIDEO 2 Now let’s practice finding our own models!
  • 68.
    Modeling Polynomial Functions Sketch a graph and visually determine which model is a better fit? Linear, Quadratic or Cubic? X Y 0 10 5 3 10 8 15 16 20 18
  • 69.
    Polynomial Functions Solution: CUBIC MODEL Find the equation that best models the data in the table.
  • 70.
    Polynomial Functions Solution: CUBIC MODEL Find the equation that best models the data in the table. Reminder: To enter data: STAT  1:Edit  L1 and L2 To get model: STAT  CALC  6:CubicReg
  • 71.
    Polynomial Functions Solution: CUBIC MODEL Find the equation that best models the data in the table. Reminder: To enter data: STAT  1:Edit  L1 and L2 To get model: STAT  CALC  6:CubicReg
  • 72.
    3 2 y = −0.012x + 0.42x − 3.2x + 10
  • 73.
    You finished thenotes! Please complete the Assignment.