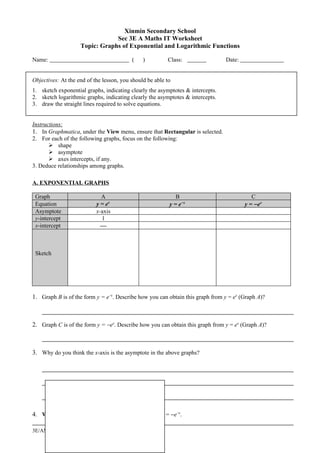
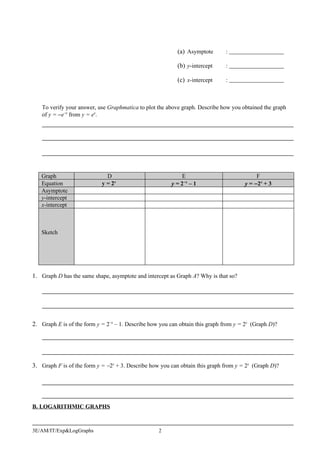
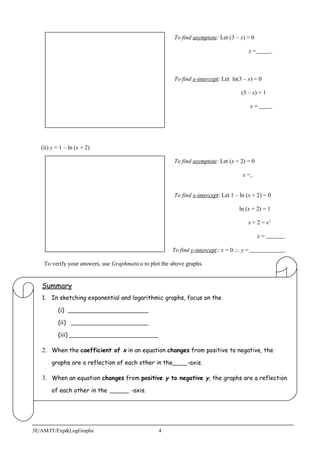
Xinmin Secondary School
                                Sec 3E A Maths IT Worksheet
                    Topic: Graphs of Exponential and Logarithmic Functions

Name:                                     (    )          Class:                Date:


Objectives: At the end of the lesson, you should be able to
1. sketch exponential graphs, indicating clearly the asymptotes & intercepts.
2. sketch logarithmic graphs, indicating clearly the asymptotes & intercepts.
3. draw the straight lines required to solve equations.


Instructions:
1. In Graphmatica, under the View menu, ensure that Rectangular is selected.
2. For each of the following graphs, focus on the following:
        shape
        asymptote
        axes intercepts, if any.
3. Deduce relationships among graphs.

A. EXPONENTIAL GRAPHS

 Graph                       A                               B                             C
 Equation                  y = ex                         y = e− x                      y = − ex
 Asymptote                 x-axis
 y-intercept                 1
 x-intercept                 


 Sketch


1. Graph B is of the form y = e−x. Describe how you can obtain this graph from y = ex (Graph A)?


2. Graph C is of the form y = −ex. Describe how you can obtain this graph from y = ex (Graph A)?


3. Why do you think the x-axis is the asymptote in the above graphs?


4. Without using Graphmatica, sketch the graph of y = −e−x.

3E/AM/IT/Exp&LogGraphs                                1
(a) Asymptote       :

                                                           (b) y-intercept     :

                                                           (c) x-intercept     :


   To verify your answer, use Graphmatica to plot the above graph. Describe how you obtained the graph
   of y = −e−x from y = ex.


   Graph                      D                              E                             F
   Equation                 y = 2x                      y = 2− x – 1                  y = − 2x + 3
   Asymptote
   y-intercept
   x-intercept


   Sketch


1. Graph D has the same shape, asymptote and intercept as Graph A? Why is that so?


2. Graph E is of the form y = 2−x – 1. Describe how you can obtain this graph from y = 2x (Graph D)?


3. Graph F is of the form y = −2x + 3. Describe how you can obtain this graph from y = 2x (Graph D)?


B. LOGARITHMIC GRAPHS


3E/AM/IT/Exp&LogGraphs                             2
Graph                   A                       B                        C                         D
Equation             y = lg x              y = lg (− x)              y = − lg x              y = − lg (− x)
Asymptote
y-intercept
x-intercept


Sketch


 1. Graph B is of the form y = lg (−x). Describe how you can obtain this graph from y = lg x (Graph A)?


 2. Graph C is of the form y = − lg x. Describe how you can obtain this graph from y = lg x (Graph A)?


 3. Graph D is of the form y = −lg (−x). Describe how you can obtain this graph from y = lg x (Graph A)?


 4. When the coefficient of x in an equation changes from positive to negative, what do you notice about
     the change in the graphs?


 5. When an equation changes from positive y to negative y, what do you notice about the change in the
     graphs?


 6. Do you expect any difference in the shape, asymptote and intercept of the graphs of y = lg x and
     y = ln x? Why?


 7. Without using Graphmatica, sketch the following graphs.

     (i) y = ln (3 – x).
 3E/AM/IT/Exp&LogGraphs                               3
To find asymptote: Let (3 – x) = 0

                                                                                            x=         .


                                                         To find x-intercept: Let ln(3 – x) = 0

                                                                                      (3 – x) = 1

                                                                                            x=         .


   (ii) y = 1 – ln (x + 2)

                                                         To find asymptote: Let (x + 2) = 0

                                                                                       x=.


                                                         To find x-intercept: Let 1 – ln (x + 2) = 0

                                                                                     ln (x + 2) = 1

                                                                                         x + 2 = e1

                                                                                                 x=        .

                                                        To find y-intercept:: x = 0 ∴ y =                  .

    To verify your answers, use Graphmatica to plot the above graphs.


   Summary
   1. In sketching exponential and logarithmic graphs, focus on the

           (i)

           (ii)

           (iii)

   2. When the coefficient of x in an equation changes from positive to negative, the
       graphs are a reflection of each other in the           -axis.

   3. When an equation changes from positive y to negative y, the graphs are a reflection
       of each other in the            -axis.


3E/AM/IT/Exp&LogGraphs                            4

Exp&log graphs it worksheet

  • 1.
    Xinmin Secondary School Sec 3E A Maths IT Worksheet Topic: Graphs of Exponential and Logarithmic Functions Name: ( ) Class: Date: Objectives: At the end of the lesson, you should be able to 1. sketch exponential graphs, indicating clearly the asymptotes & intercepts. 2. sketch logarithmic graphs, indicating clearly the asymptotes & intercepts. 3. draw the straight lines required to solve equations. Instructions: 1. In Graphmatica, under the View menu, ensure that Rectangular is selected. 2. For each of the following graphs, focus on the following:  shape  asymptote  axes intercepts, if any. 3. Deduce relationships among graphs. A. EXPONENTIAL GRAPHS Graph A B C Equation y = ex y = e− x y = − ex Asymptote x-axis y-intercept 1 x-intercept  Sketch 1. Graph B is of the form y = e−x. Describe how you can obtain this graph from y = ex (Graph A)? 2. Graph C is of the form y = −ex. Describe how you can obtain this graph from y = ex (Graph A)? 3. Why do you think the x-axis is the asymptote in the above graphs? 4. Without using Graphmatica, sketch the graph of y = −e−x. 3E/AM/IT/Exp&LogGraphs 1
  • 2.
    (a) Asymptote : (b) y-intercept : (c) x-intercept : To verify your answer, use Graphmatica to plot the above graph. Describe how you obtained the graph of y = −e−x from y = ex. Graph D E F Equation y = 2x y = 2− x – 1 y = − 2x + 3 Asymptote y-intercept x-intercept Sketch 1. Graph D has the same shape, asymptote and intercept as Graph A? Why is that so? 2. Graph E is of the form y = 2−x – 1. Describe how you can obtain this graph from y = 2x (Graph D)? 3. Graph F is of the form y = −2x + 3. Describe how you can obtain this graph from y = 2x (Graph D)? B. LOGARITHMIC GRAPHS 3E/AM/IT/Exp&LogGraphs 2
  • 3.
    Graph A B C D Equation y = lg x y = lg (− x) y = − lg x y = − lg (− x) Asymptote y-intercept x-intercept Sketch 1. Graph B is of the form y = lg (−x). Describe how you can obtain this graph from y = lg x (Graph A)? 2. Graph C is of the form y = − lg x. Describe how you can obtain this graph from y = lg x (Graph A)? 3. Graph D is of the form y = −lg (−x). Describe how you can obtain this graph from y = lg x (Graph A)? 4. When the coefficient of x in an equation changes from positive to negative, what do you notice about the change in the graphs? 5. When an equation changes from positive y to negative y, what do you notice about the change in the graphs? 6. Do you expect any difference in the shape, asymptote and intercept of the graphs of y = lg x and y = ln x? Why? 7. Without using Graphmatica, sketch the following graphs. (i) y = ln (3 – x). 3E/AM/IT/Exp&LogGraphs 3
  • 4.
    To find asymptote:Let (3 – x) = 0 x= . To find x-intercept: Let ln(3 – x) = 0 (3 – x) = 1 x= . (ii) y = 1 – ln (x + 2) To find asymptote: Let (x + 2) = 0 x=. To find x-intercept: Let 1 – ln (x + 2) = 0 ln (x + 2) = 1 x + 2 = e1 x= . To find y-intercept:: x = 0 ∴ y = . To verify your answers, use Graphmatica to plot the above graphs. Summary 1. In sketching exponential and logarithmic graphs, focus on the (i) (ii) (iii) 2. When the coefficient of x in an equation changes from positive to negative, the graphs are a reflection of each other in the -axis. 3. When an equation changes from positive y to negative y, the graphs are a reflection of each other in the -axis. 3E/AM/IT/Exp&LogGraphs 4