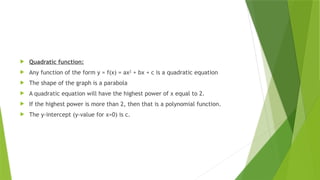
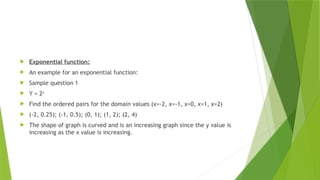
MAT 1004: GRAPH OF
FUNCTIONS
DR MEENA VARMA
Recap of Function
 A function(or mapping) from A into B is a relation from A to B in which no two
distinct ordered pairs have the same first element.
 A is called the domain of the function and B is called the codomain of the
function.
 For a relation to be a function it cannot contain ordered pairs like (1,a) and
(1,c) , because they have the same first element.
 If a function f is a relation, then it has a range- the set of all second elements
of the ordered pairs of f.
Graph : Introduction
 System of two number lines at right angles (horizontal – x-axis and vertical –
y-axis). It will specify points in a plane using the ordered pairs (x, y).
 Graph is the visual representation of the relation between the input and
output values.
 X values represent the domain.
 Y values represent the co-domain.
 The graph does not represent a function if any vertical line intersect the
graph at more than one point.
Graph of a function
 Linear Function:
 A linear function is in the general form Y = m X + C where X is the input
variable and Y is the output.
 The variable is any real number.
 The function f(x)=3x+2 is a set of ordered pairs
 f={(x, y) : y=3x+2}
 In this for every ordered pair of (X,Y) is a coordinate and is plotted to have a
graphical representation of the function f(x) = 3x + 2
 The shape of the graph is a straight line
No x value Y = f(x) = 3x +2
1 -2 3x(-2) + 2 = -4
2 -1 3x(-1) + 2 = -1
3 0 3 x0 + 2 = 2
4 1 3 x1 + 2 = 5
5 2 3x2 + 2 = 8
 From the table, the se of ordered pairs are : (-2, -4); (-1, -1); (0, 2); (1,5); (2,
8)
 This represent a function since
 for every ordered pair there is a unique member from the
domain which is not repeated.
 The x- intercept of the function is the value of x for which y=0. that is 0 = 3x
+ 2;
 3x = -2 or x = -2/3
 The y-intercept of the function is the value of y for which x is zero.
 Y = 3 x0 + 2 = 2
 In the general equation y = mx + c; m represent the slope ( how much graph is
tilted with horizontal) and c represent the y-intercept.
 Sample question 1:
 Draw the graph of the function f(x) = x ; x Є R
 Write any 5 set of ordered pairs and draw the graph.
 What is its x and y-intercept values?
 What is its slope?
 Sample question 2
 Draw the graph of the function f(x) = 4x -2 ; x Є R
 Write any 5 set of ordered pairs and draw the graph.
 What is its x and y-intercept values?
 What is its slope?
 Quadratic function:
 Any function of the form y = f(x) = ax2
+ bx + c is a quadratic equation
 The shape of the graph is a parabola
 A quadratic equation will have the highest power of x equal to 2.
 If the highest power is more than 2, then that is a polynomial function.
 The y-intercept (y-value for x=0) is c.
 Sample question 1:
 Draw the graph of the function f(x) = x2
- 4 ; x Є R
 Write any 6 set of ordered pairs and draw the graph.
 What is its x and y-intercept values?
 What is its slope?
 Comparing with the general equation; a = 1 b = 0; c= -4
 Sample question 2:
 Draw the graph of the function f(x) = x2
; x Є R
 Write any 5 set of ordered pairs and draw the graph.
 What is its x and y-intercept values?
 What is its slope?
 Comparing with the general equation; a = 1 b = 0; c= 0
 Exponential function:
 An example for an exponential function:
 Sample question 1
 Y = 2x
 Find the ordered pairs for the domain values (x=-2, x=-1, x=0, x=1, x=2)
 (-2, 0.25); (-1, 0.5); (0, 1); (1, 2); (2, 4)
 The shape of graph is curved and is an increasing graph since the y value is
increasing as the x value is increasing.
 Sample question 2:
 Y = (1/3)x
 This can be written as y = 3-x
 Find the ordered pairs for the domain values (x=-2, x=-1, x=0, x=1, x=2)
 (-2, 9); (-1, 3); (0, 1); (1, 0.33); (2, 0.11)
 The shape of graph is curved and is a decreasing graph since the y value is
decreasing as the x value is increasing.

mathematics-1 Math1001 --- Graphical function.pptx

  • 1.
    MAT 1004: GRAPHOF FUNCTIONS DR MEENA VARMA
  • 2.
    Recap of Function A function(or mapping) from A into B is a relation from A to B in which no two distinct ordered pairs have the same first element.  A is called the domain of the function and B is called the codomain of the function.  For a relation to be a function it cannot contain ordered pairs like (1,a) and (1,c) , because they have the same first element.  If a function f is a relation, then it has a range- the set of all second elements of the ordered pairs of f.
  • 3.
    Graph : Introduction System of two number lines at right angles (horizontal – x-axis and vertical – y-axis). It will specify points in a plane using the ordered pairs (x, y).  Graph is the visual representation of the relation between the input and output values.  X values represent the domain.  Y values represent the co-domain.  The graph does not represent a function if any vertical line intersect the graph at more than one point.
  • 4.
    Graph of afunction  Linear Function:  A linear function is in the general form Y = m X + C where X is the input variable and Y is the output.  The variable is any real number.  The function f(x)=3x+2 is a set of ordered pairs  f={(x, y) : y=3x+2}  In this for every ordered pair of (X,Y) is a coordinate and is plotted to have a graphical representation of the function f(x) = 3x + 2  The shape of the graph is a straight line
  • 5.
    No x valueY = f(x) = 3x +2 1 -2 3x(-2) + 2 = -4 2 -1 3x(-1) + 2 = -1 3 0 3 x0 + 2 = 2 4 1 3 x1 + 2 = 5 5 2 3x2 + 2 = 8
  • 6.
     From thetable, the se of ordered pairs are : (-2, -4); (-1, -1); (0, 2); (1,5); (2, 8)  This represent a function since  for every ordered pair there is a unique member from the domain which is not repeated.  The x- intercept of the function is the value of x for which y=0. that is 0 = 3x + 2;  3x = -2 or x = -2/3  The y-intercept of the function is the value of y for which x is zero.
  • 7.
     Y =3 x0 + 2 = 2  In the general equation y = mx + c; m represent the slope ( how much graph is tilted with horizontal) and c represent the y-intercept.  Sample question 1:  Draw the graph of the function f(x) = x ; x Є R  Write any 5 set of ordered pairs and draw the graph.  What is its x and y-intercept values?  What is its slope?
  • 8.
     Sample question2  Draw the graph of the function f(x) = 4x -2 ; x Є R  Write any 5 set of ordered pairs and draw the graph.  What is its x and y-intercept values?  What is its slope?
  • 9.
     Quadratic function: Any function of the form y = f(x) = ax2 + bx + c is a quadratic equation  The shape of the graph is a parabola  A quadratic equation will have the highest power of x equal to 2.  If the highest power is more than 2, then that is a polynomial function.  The y-intercept (y-value for x=0) is c.
  • 11.
     Sample question1:  Draw the graph of the function f(x) = x2 - 4 ; x Є R  Write any 6 set of ordered pairs and draw the graph.  What is its x and y-intercept values?  What is its slope?  Comparing with the general equation; a = 1 b = 0; c= -4
  • 12.
     Sample question2:  Draw the graph of the function f(x) = x2 ; x Є R  Write any 5 set of ordered pairs and draw the graph.  What is its x and y-intercept values?  What is its slope?  Comparing with the general equation; a = 1 b = 0; c= 0
  • 13.
     Exponential function: An example for an exponential function:  Sample question 1  Y = 2x  Find the ordered pairs for the domain values (x=-2, x=-1, x=0, x=1, x=2)  (-2, 0.25); (-1, 0.5); (0, 1); (1, 2); (2, 4)  The shape of graph is curved and is an increasing graph since the y value is increasing as the x value is increasing.
  • 14.
     Sample question2:  Y = (1/3)x  This can be written as y = 3-x  Find the ordered pairs for the domain values (x=-2, x=-1, x=0, x=1, x=2)  (-2, 9); (-1, 3); (0, 1); (1, 0.33); (2, 0.11)  The shape of graph is curved and is a decreasing graph since the y value is decreasing as the x value is increasing.