This document provides an overview of key concepts related to graphing polynomials, including:
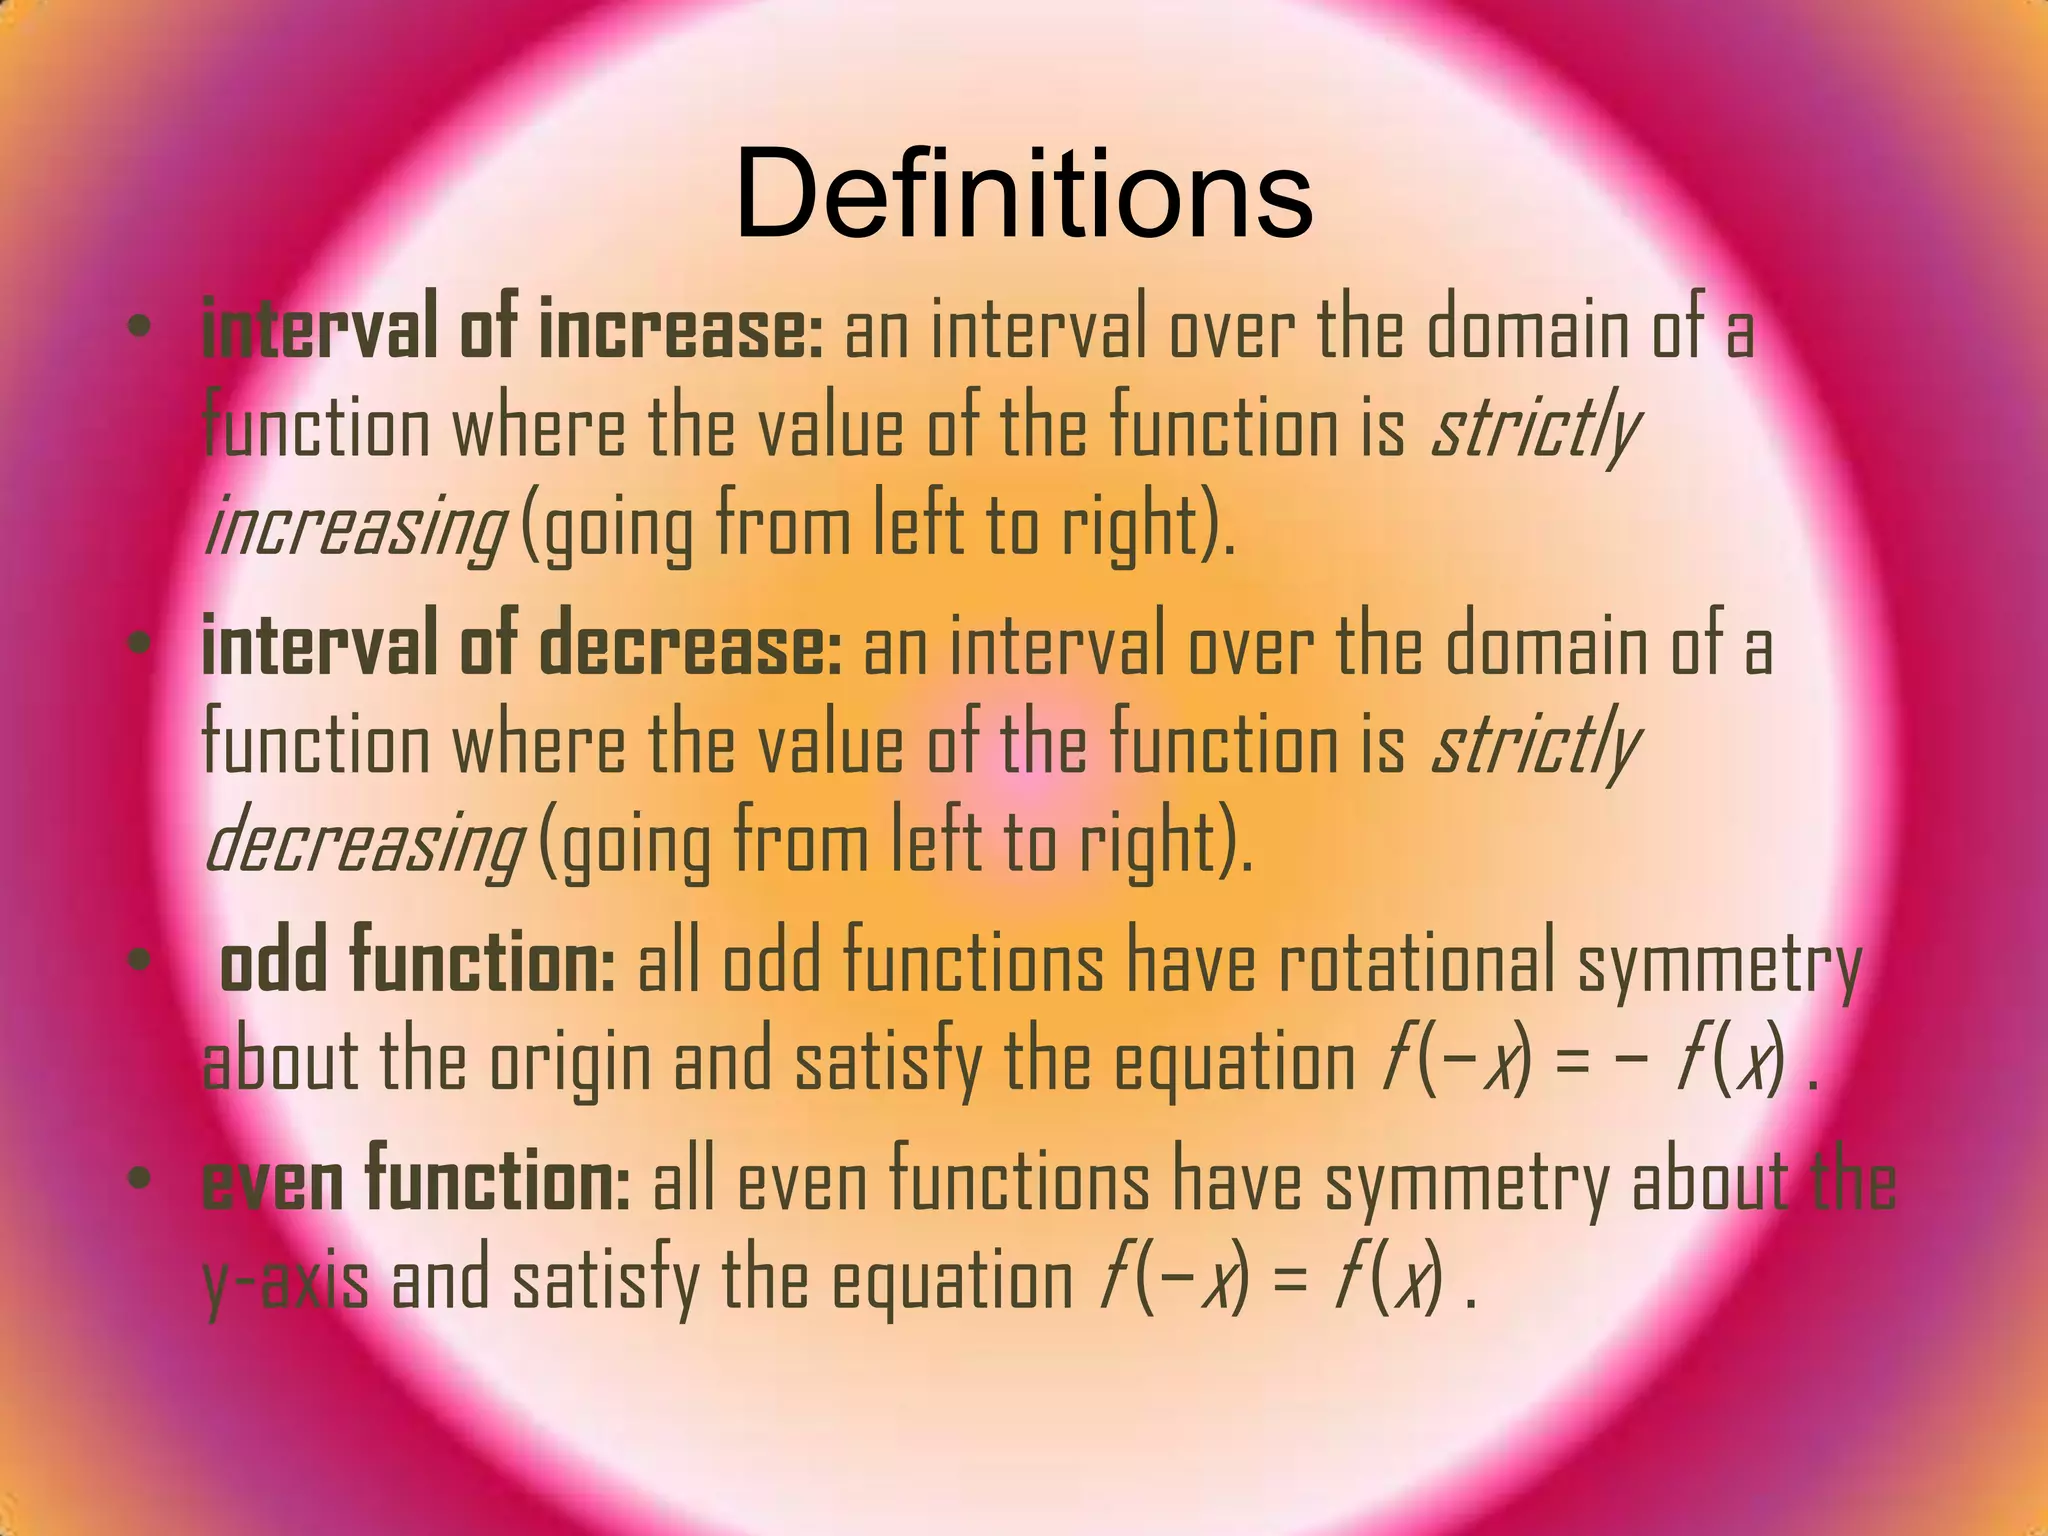
1. Definitions of terms like intervals of increase/decrease, odd/even functions, zeros, and multiplicities.
2. Steps for graphing polynomials which include determining behavior, finding intercepts and zeros, and joining points based on multiplicities.
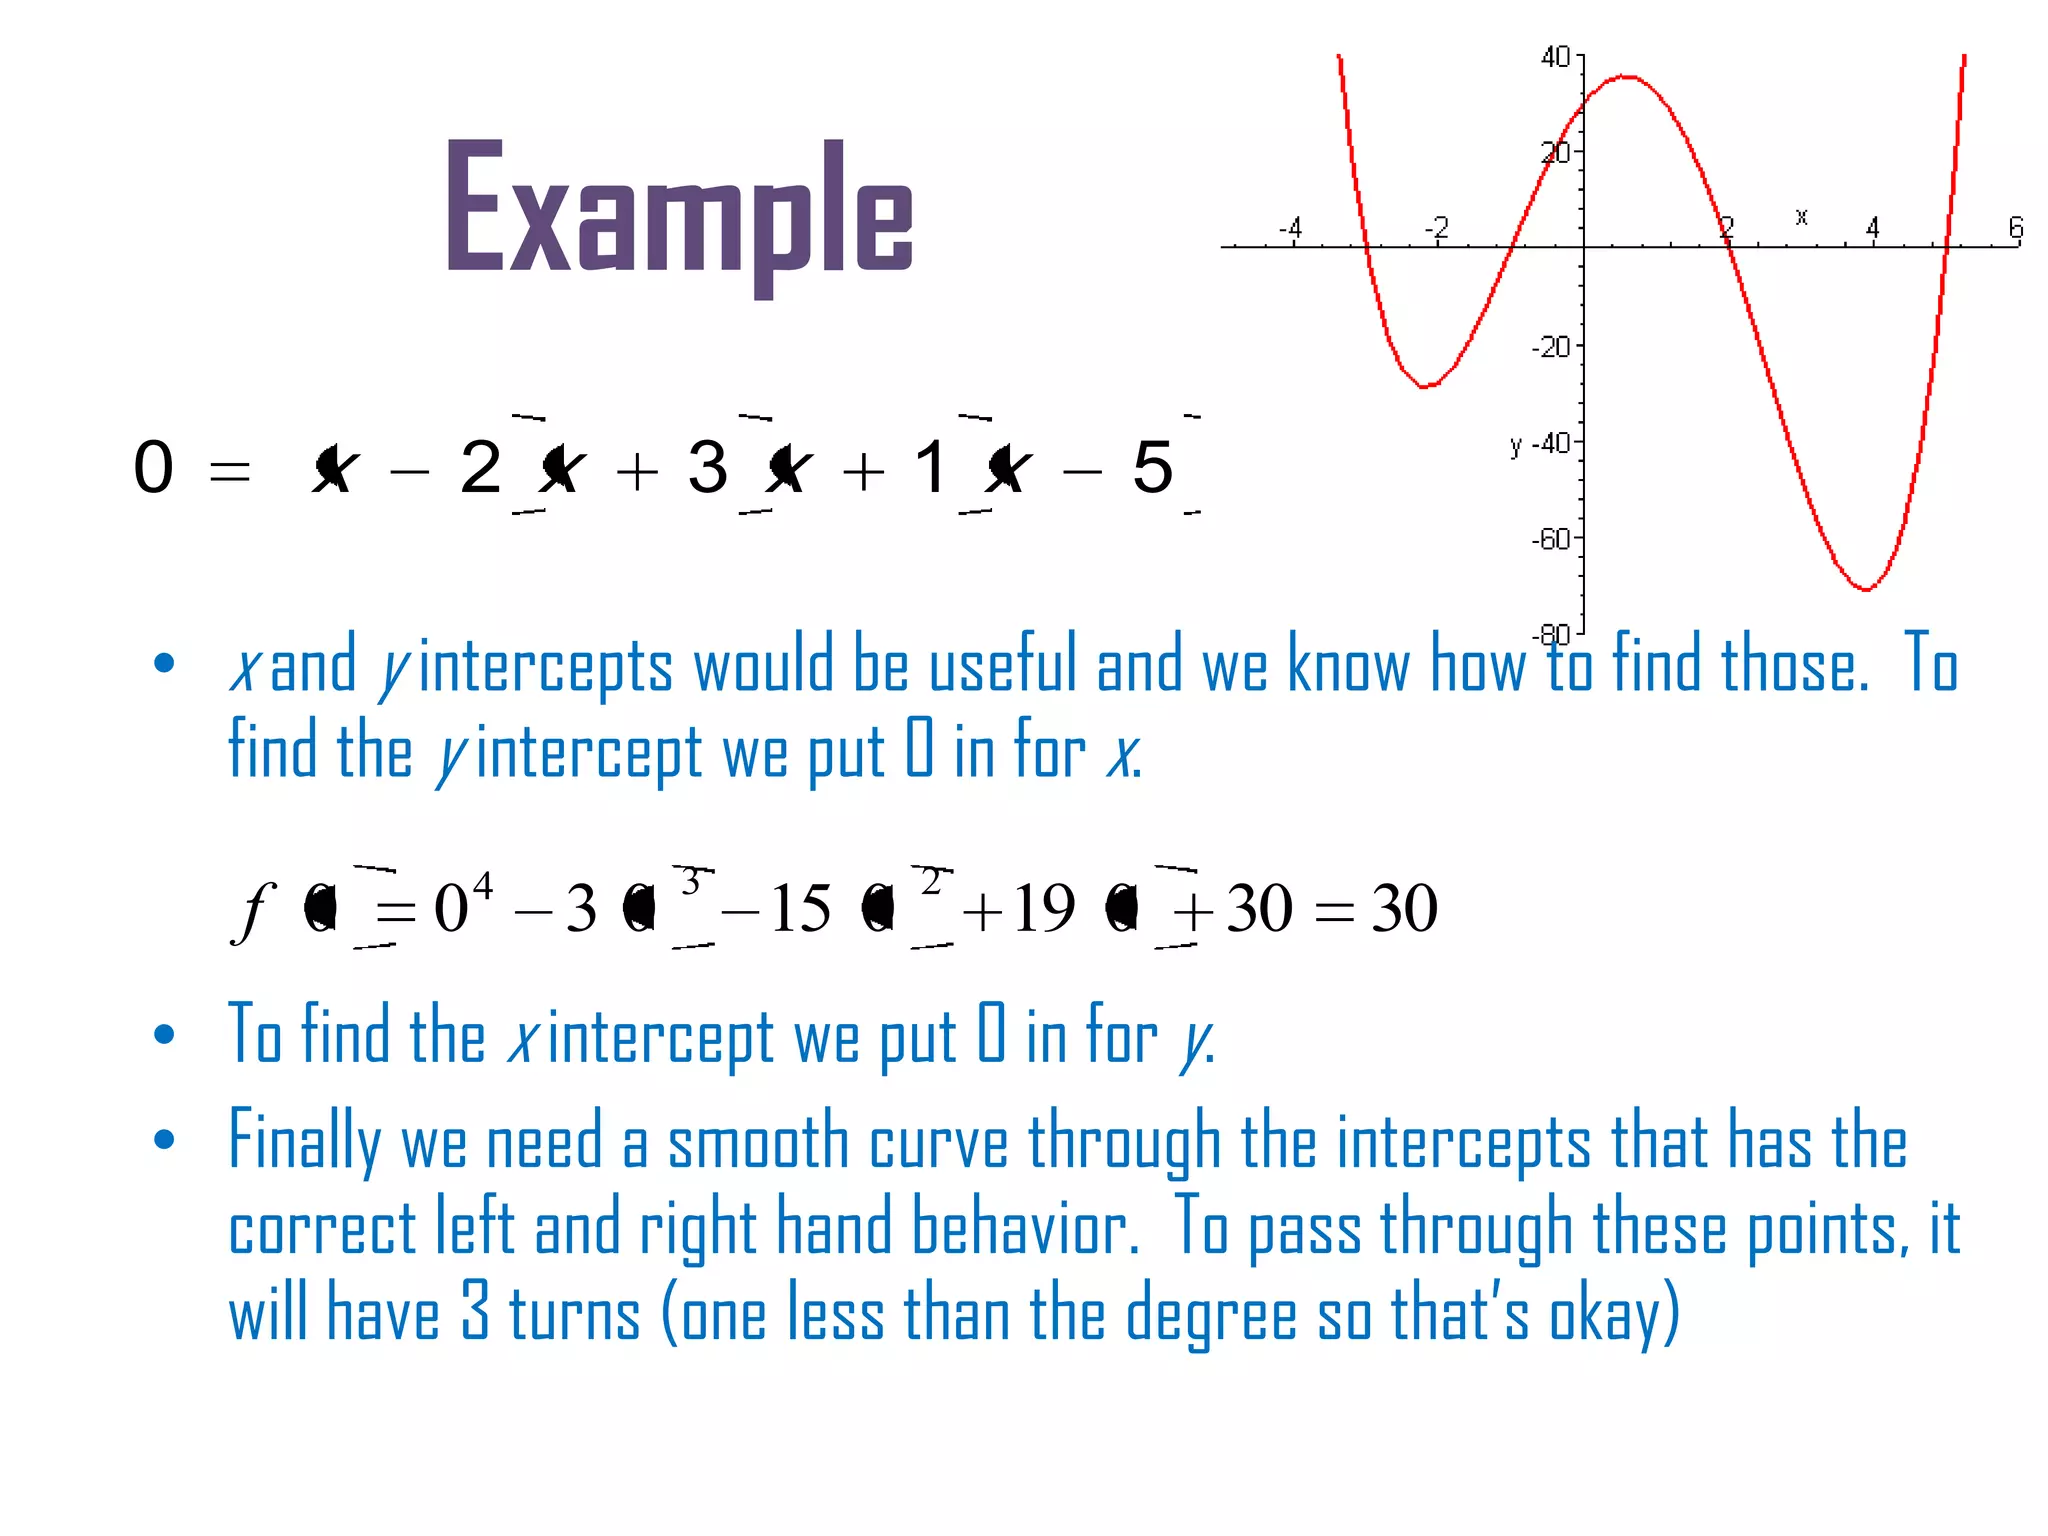
3. Examples are provided to demonstrate finding zeros and their multiplicities, and graphing a polynomial based on the identified features.
4. Information that can be determined from a polynomial graph, such as degree, leading coefficient, end behavior, intercepts, and intervals of increase/decrease.