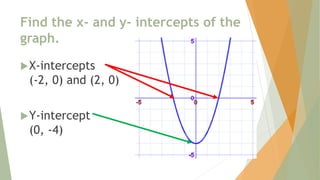
The document discusses key concepts for interpreting graphs of functions, including:
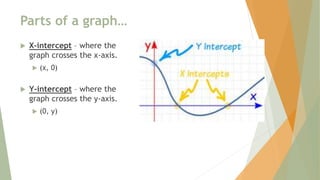
- Identifying x-intercepts, y-intercepts, intervals where a function is increasing or decreasing, maximums, and minimums of a graph
- Understanding function notation and evaluating functions for given inputs
- Sketching graphs of functions and determining their domains from equations or graphs

![4 3 2 1 0
In addition to level
3.0 and above and
beyond what was
taught in
class, the student
may:
· Make connection
with other
concepts in math
· Make connection
with other content
areas.
The student will understand the
concept of a function and use of
function notation.
- Evaluate functions for given
inputs.
- Interpret key features of
graphs and tables of a function.
- Sketch graphs of functions.
- Determine the domain of the
equation or graph of a function
and what it may represent in
context.
- Convert a table, graph, set of
ordered pairs, or description
into function notation by
identifying a rule.
- Identify numbers that are not
in the domain of a function.
[f(x) = 1/x x≠ 0 or f(x) = 𝑥 x ≠
a negative]
The student will be
able to understand
the concept of a
function.
- Correctly use
function terminology
(domain, range,
f(x)).
- Determine if a
relationship given in
a table, graph, or
words depicts a
function.
With help from
the
teacher, the
student has
partial success
with function
terminology,
function
notation and
determining if
a relation table
or graph depict
a function.
Even with help,
the student has
no success
understanding
the concept of
a function.
Learning Goal for Focus 3 (HS.A-CED.A.1, HS.F-IF.A.1 & 2, HS.F-IF.B.4 & 5):
The student will understand the concept of a function and use
of function notation.](https://image.slidesharecdn.com/interpretinggraphsoffunctions-240103235819-f019b40f/85/Interpreting-Graphs-and-Functions-of-the-2-320.jpg)
![Find where the function is increasing
or decreasing.
The graph is increasing in the
following intervals:
[-2.2, -1.2]
[1.2, 2.2]
The graph is decreasing in the
following interval:
[-1.2, 1.2]](https://image.slidesharecdn.com/interpretinggraphsoffunctions-240103235819-f019b40f/85/Interpreting-Graphs-and-Functions-of-the-6-320.jpg)
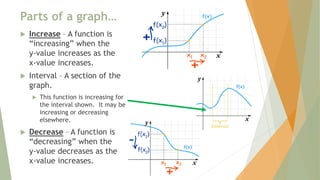
![Parts of a graph…
Maximum – the largest value of the
function within the interval.
What is the maximum value in the
interval [1, 5]?
The maximum value is 4.
Minimum – the smallest value of the
function with an interval.
What is the minimum value in the
interval [1, 5]?
The minimum value is 1.](https://image.slidesharecdn.com/interpretinggraphsoffunctions-240103235819-f019b40f/85/Interpreting-Graphs-and-Functions-of-the-7-320.jpg)
![Identify the features of the function.
Find the x-intercepts:
(-8, 0), (-3, 0), (8, 0)
Find the y-intercept:
(0, -4)
Name the intervals where the
function is increasing:
[-8, -6], [6, ∞]
Name the intervals where the
function is decreasing:
[-6, 0], [4, 6]
Name the interval where the
function is flat: [0, 4]](https://image.slidesharecdn.com/interpretinggraphsoffunctions-240103235819-f019b40f/85/Interpreting-Graphs-and-Functions-of-the-8-320.jpg)
![Identify the features of the function.
Name the maximum for the
interval [-8, -5]:
7
Name the minimum for the
interval [2, 8]:
-8](https://image.slidesharecdn.com/interpretinggraphsoffunctions-240103235819-f019b40f/85/Interpreting-Graphs-and-Functions-of-the-9-320.jpg)