This document defines and describes several normal interval values in an electrocardiogram (ECG). It discusses the RR, PP, PR, QRS, and QT intervals which measure the timing of electrical signals in the atria and ventricles. It also describes ventricular activation time, normal ECG segments including the PR, RST, and TP segments, and provides information on what can be determined from an ECG reading such as the site of the pacemaker, heart rate, rhythm, and potential in diagnosing heart conditions.
Biatrial enlargement is diagnosed when criteria for both right and left atrial enlargement are present on the same ECG.
The diagnosis of biatrial enlargement requires criteria for LAE and RAE to be met in either lead II, lead V1 or a combination of leads.
Biatrial enlargement is diagnosed when criteria for both right and left atrial enlargement are present on the same ECG.
The diagnosis of biatrial enlargement requires criteria for LAE and RAE to be met in either lead II, lead V1 or a combination of leads.
Sinus arrhythmia is a normal physiological phenomenon, most commnonly seen in young, healthy people. The heart rate varies due to reflex changes in vagal tone during the different stages of the respiratory cycle. Inspiration increases the heart rate by decreasing vagal tone
Basics on heart murmurs, differentiate physiologic murmur from pathologic. Learn when to investigate further and when to monitor. Know the effect of different maneuvers on murmurs and physiology behind them. Listen to the heart sounds on the slides to appreciate the distinctive nature of each murmur.
Arterial pulse (The Guyton and Hall Physiology)Maryam Fida
It is the pressure wave which travel along the walls of Arteries when blood is ejected from the left ventricle into the aorta
Aorta expands to accommodate the ejected blood volume, when it expands it has got elastic recoil, so it shortens back. This causes pressure wave which leads to expansion of arterial wall which can be palpated as arterial pulse.
Normally arterial pulse ends at arterioles.
So normally there is no capillary pulsations
FACTORS
The velocity of blood flow
The velocity of transmission of pressure wave
Anti ulcer drugs and their Advance pharmacology ||
Anti-ulcer drugs are medications used to prevent and treat ulcers in the stomach and upper part of the small intestine (duodenal ulcers). These ulcers are often caused by an imbalance between stomach acid and the mucosal lining, which protects the stomach lining.
||Scope: Overview of various classes of anti-ulcer drugs, their mechanisms of action, indications, side effects, and clinical considerations.
Flu Vaccine Alert in Bangalore Karnatakaaddon Scans
As flu season approaches, health officials in Bangalore, Karnataka, are urging residents to get their flu vaccinations. The seasonal flu, while common, can lead to severe health complications, particularly for vulnerable populations such as young children, the elderly, and those with underlying health conditions.
Dr. Vidisha Kumari, a leading epidemiologist in Bangalore, emphasizes the importance of getting vaccinated. "The flu vaccine is our best defense against the influenza virus. It not only protects individuals but also helps prevent the spread of the virus in our communities," he says.
This year, the flu season is expected to coincide with a potential increase in other respiratory illnesses. The Karnataka Health Department has launched an awareness campaign highlighting the significance of flu vaccinations. They have set up multiple vaccination centers across Bangalore, making it convenient for residents to receive their shots.
To encourage widespread vaccination, the government is also collaborating with local schools, workplaces, and community centers to facilitate vaccination drives. Special attention is being given to ensuring that the vaccine is accessible to all, including marginalized communities who may have limited access to healthcare.
Residents are reminded that the flu vaccine is safe and effective. Common side effects are mild and may include soreness at the injection site, mild fever, or muscle aches. These side effects are generally short-lived and far less severe than the flu itself.
Healthcare providers are also stressing the importance of continuing COVID-19 precautions. Wearing masks, practicing good hand hygiene, and maintaining social distancing are still crucial, especially in crowded places.
Protect yourself and your loved ones by getting vaccinated. Together, we can help keep Bangalore healthy and safe this flu season. For more information on vaccination centers and schedules, residents can visit the Karnataka Health Department’s official website or follow their social media pages.
Stay informed, stay safe, and get your flu shot today!
Lung Cancer: Artificial Intelligence, Synergetics, Complex System Analysis, S...Oleg Kshivets
RESULTS: Overall life span (LS) was 2252.1±1742.5 days and cumulative 5-year survival (5YS) reached 73.2%, 10 years – 64.8%, 20 years – 42.5%. 513 LCP lived more than 5 years (LS=3124.6±1525.6 days), 148 LCP – more than 10 years (LS=5054.4±1504.1 days).199 LCP died because of LC (LS=562.7±374.5 days). 5YS of LCP after bi/lobectomies was significantly superior in comparison with LCP after pneumonectomies (78.1% vs.63.7%, P=0.00001 by log-rank test). AT significantly improved 5YS (66.3% vs. 34.8%) (P=0.00000 by log-rank test) only for LCP with N1-2. Cox modeling displayed that 5YS of LCP significantly depended on: phase transition (PT) early-invasive LC in terms of synergetics, PT N0—N12, cell ratio factors (ratio between cancer cells- CC and blood cells subpopulations), G1-3, histology, glucose, AT, blood cell circuit, prothrombin index, heparin tolerance, recalcification time (P=0.000-0.038). Neural networks, genetic algorithm selection and bootstrap simulation revealed relationships between 5YS and PT early-invasive LC (rank=1), PT N0—N12 (rank=2), thrombocytes/CC (3), erythrocytes/CC (4), eosinophils/CC (5), healthy cells/CC (6), lymphocytes/CC (7), segmented neutrophils/CC (8), stick neutrophils/CC (9), monocytes/CC (10); leucocytes/CC (11). Correct prediction of 5YS was 100% by neural networks computing (area under ROC curve=1.0; error=0.0).
CONCLUSIONS: 5YS of LCP after radical procedures significantly depended on: 1) PT early-invasive cancer; 2) PT N0--N12; 3) cell ratio factors; 4) blood cell circuit; 5) biochemical factors; 6) hemostasis system; 7) AT; 8) LC characteristics; 9) LC cell dynamics; 10) surgery type: lobectomy/pneumonectomy; 11) anthropometric data. Optimal diagnosis and treatment strategies for LC are: 1) screening and early detection of LC; 2) availability of experienced thoracic surgeons because of complexity of radical procedures; 3) aggressive en block surgery and adequate lymph node dissection for completeness; 4) precise prediction; 5) adjuvant chemoimmunoradiotherapy for LCP with unfavorable prognosis.
Ethanol (CH3CH2OH), or beverage alcohol, is a two-carbon alcohol
that is rapidly distributed in the body and brain. Ethanol alters many
neurochemical systems and has rewarding and addictive properties. It
is the oldest recreational drug and likely contributes to more morbidity,
mortality, and public health costs than all illicit drugs combined. The
5th edition of the Diagnostic and Statistical Manual of Mental Disorders
(DSM-5) integrates alcohol abuse and alcohol dependence into a single
disorder called alcohol use disorder (AUD), with mild, moderate,
and severe subclassifications (American Psychiatric Association, 2013).
In the DSM-5, all types of substance abuse and dependence have been
combined into a single substance use disorder (SUD) on a continuum
from mild to severe. A diagnosis of AUD requires that at least two of
the 11 DSM-5 behaviors be present within a 12-month period (mild
AUD: 2–3 criteria; moderate AUD: 4–5 criteria; severe AUD: 6–11 criteria).
The four main behavioral effects of AUD are impaired control over
drinking, negative social consequences, risky use, and altered physiological
effects (tolerance, withdrawal). This chapter presents an overview
of the prevalence and harmful consequences of AUD in the U.S.,
the systemic nature of the disease, neurocircuitry and stages of AUD,
comorbidities, fetal alcohol spectrum disorders, genetic risk factors, and
pharmacotherapies for AUD.
Title: Sense of Taste
Presenter: Dr. Faiza, Assistant Professor of Physiology
Qualifications:
MBBS (Best Graduate, AIMC Lahore)
FCPS Physiology
ICMT, CHPE, DHPE (STMU)
MPH (GC University, Faisalabad)
MBA (Virtual University of Pakistan)
Learning Objectives:
Describe the structure and function of taste buds.
Describe the relationship between the taste threshold and taste index of common substances.
Explain the chemical basis and signal transduction of taste perception for each type of primary taste sensation.
Recognize different abnormalities of taste perception and their causes.
Key Topics:
Significance of Taste Sensation:
Differentiation between pleasant and harmful food
Influence on behavior
Selection of food based on metabolic needs
Receptors of Taste:
Taste buds on the tongue
Influence of sense of smell, texture of food, and pain stimulation (e.g., by pepper)
Primary and Secondary Taste Sensations:
Primary taste sensations: Sweet, Sour, Salty, Bitter, Umami
Chemical basis and signal transduction mechanisms for each taste
Taste Threshold and Index:
Taste threshold values for Sweet (sucrose), Salty (NaCl), Sour (HCl), and Bitter (Quinine)
Taste index relationship: Inversely proportional to taste threshold
Taste Blindness:
Inability to taste certain substances, particularly thiourea compounds
Example: Phenylthiocarbamide
Structure and Function of Taste Buds:
Composition: Epithelial cells, Sustentacular/Supporting cells, Taste cells, Basal cells
Features: Taste pores, Taste hairs/microvilli, and Taste nerve fibers
Location of Taste Buds:
Found in papillae of the tongue (Fungiform, Circumvallate, Foliate)
Also present on the palate, tonsillar pillars, epiglottis, and proximal esophagus
Mechanism of Taste Stimulation:
Interaction of taste substances with receptors on microvilli
Signal transduction pathways for Umami, Sweet, Bitter, Sour, and Salty tastes
Taste Sensitivity and Adaptation:
Decrease in sensitivity with age
Rapid adaptation of taste sensation
Role of Saliva in Taste:
Dissolution of tastants to reach receptors
Washing away the stimulus
Taste Preferences and Aversions:
Mechanisms behind taste preference and aversion
Influence of receptors and neural pathways
Impact of Sensory Nerve Damage:
Degeneration of taste buds if the sensory nerve fiber is cut
Abnormalities of Taste Detection:
Conditions: Ageusia, Hypogeusia, Dysgeusia (parageusia)
Causes: Nerve damage, neurological disorders, infections, poor oral hygiene, adverse drug effects, deficiencies, aging, tobacco use, altered neurotransmitter levels
Neurotransmitters and Taste Threshold:
Effects of serotonin (5-HT) and norepinephrine (NE) on taste sensitivity
Supertasters:
25% of the population with heightened sensitivity to taste, especially bitterness
Increased number of fungiform papillae
Couples presenting to the infertility clinic- Do they really have infertility...Sujoy Dasgupta
Dr Sujoy Dasgupta presented the study on "Couples presenting to the infertility clinic- Do they really have infertility? – The unexplored stories of non-consummation" in the 13th Congress of the Asia Pacific Initiative on Reproduction (ASPIRE 2024) at Manila on 24 May, 2024.
Prix Galien International 2024 Forum ProgramLevi Shapiro
June 20, 2024, Prix Galien International and Jerusalem Ethics Forum in ROME. Detailed agenda including panels:
- ADVANCES IN CARDIOLOGY: A NEW PARADIGM IS COMING
- WOMEN’S HEALTH: FERTILITY PRESERVATION
- WHAT’S NEW IN THE TREATMENT OF INFECTIOUS,
ONCOLOGICAL AND INFLAMMATORY SKIN DISEASES?
- ARTIFICIAL INTELLIGENCE AND ETHICS
- GENE THERAPY
- BEYOND BORDERS: GLOBAL INITIATIVES FOR DEMOCRATIZING LIFE SCIENCE TECHNOLOGIES AND PROMOTING ACCESS TO HEALTHCARE
- ETHICAL CHALLENGES IN LIFE SCIENCES
- Prix Galien International Awards Ceremony
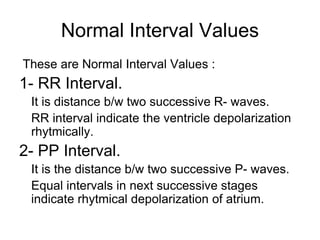
1. Normal Interval Values
These are Normal Interval Values :
1- RR Interval.
It is distance b/w two successive R- waves.
RR interval indicate the ventricle depolarization
rhytmically.
2- PP Interval.
It is the distance b/w two successive P- waves.
Equal intervals in next successive stages
indicate rhytmical depolarization of atrium.
2. 3- PR Interval.
This is interval from the onset of P to that of QRS
complex.
The more accurate term of PR interval is PQ interval.
During it the cardiac impulse travels from S.A node to
ventricles.
Its duration ranges b/w 0.12 to 0.20 or even 0.22 sec.
Longer interval of PR show impaired conduction through
the bundle, e.g, During Rheumatic fever.
Variable PR interval in successive stages indicate A.V
dissociation which indicate that ventricles beat without
influence of S.A node.
3. 4- QRS interval.
It measure the total ventricular depolarization time.
It is measured from the onset of Q- wave to end of S-
wave.
Its varies from 0.08 to 0.1 sec.
5- QT interval.
It measure the ventricular total systolic time.
It is generally measured from the onset of Q- wave to the
end of T- wave.
Its duration is 0.36 sec.
4. VAT ( Ventricular Activation Time )
It is represented by the interval b/w the onset of
Q- wave and the peak of R- wave.
Normal Segments.
1- PR segment.
It extends from the end of P to the onset of QRS
complex.
It is shorter than P.
5. 2- RST segment.
It also calls as J- point.
This indicate myocardial damage or hypoxia.
3- TP segment.
It extends from the end of T to the beginning of
the next P- wave.
It represents the resting state (repolarization
state ) of the atria and ventricle.
Its duration varies inversely with heart rate.
6. Significances of E.C.G.
Site of pace maker is recorded.
Heart rate can be calculated.
Rhythm of heart can be recognized.
Voltage produced due to potential change in
heart can be calculated.
Help in diagnosing of heart disease.
If Q- wave is not present causes of heart attack
increases.
7. If P- wave is inverted it indicates atrial fibrillation
or atrial hypertrophy.
If T- wave is prominent it indicate myocardial
infarction.
U- wave absence indicates hypokalemia.