Downloaded 245 times
![Introduction to ECG Interpretation
Rate
Rate is cycles or beats per minute.
Normal rate for the SA node 60-100.
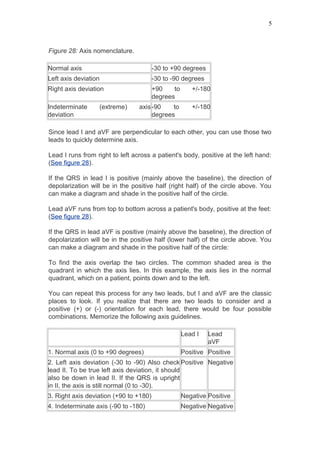
<60
bradycardia
>100
tachycardia
SA node is the usual pacemaker, other potential pacemakers (if SA node
fails) are atrial pacemakers with inherent rates of 60-80, AV node (rate 40-60),
or ventricular pacer (rate 20-40). In certain pathologic conditions ectopic (out
of place) pacemakers can go much faster at rates 150-250 cycles/minute.
There are three methods of calculating rate:
1. Most Common Method:
(Most rates can be calculated this way). Find an R wave on a heavy
line (large box) count off "300, 150, 100, 75, 60, 50" for each large box
you land on until you reach the next R wave. Estimate the rate if the
second R wave doesn't fall on a heavy black line.
Rate calculation
Memorize the number sequence:
300, 150, 100, 75, 60, 50
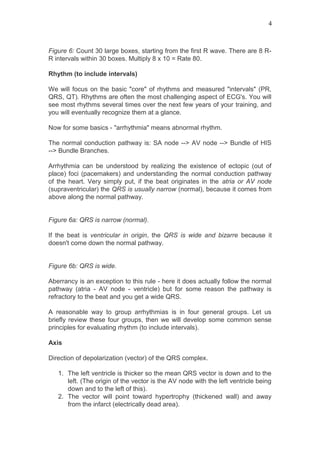
2. Figure 4: Common Method.
3. Mathematical method:
Use this method if there is a regular bradycardia, i.e. - rate < 50. If the
distance between the two R waves is too long to use the common
method, use the approach: 300/[# large boxes between two R waves].
Figure 5: Count number of large boxes between first and second R
waves=7.5. 300/7.5 large boxes = rate 40.
4. Six-second method:
Count off 30 large boxes = 6 seconds (remember 1 large box = 0.2
seconds, so 30 large boxes = 6 seconds). Then, count the number of
R-R intervals in six seconds and multiply by 10. This is the number of
beats per minute. This is most useful if you have an irregular rhythm
(like atrial fibrillation) when you want to know an average rate.
3](https://image.slidesharecdn.com/ecg-1232356830337769-2/85/Ecg-ELECTROCARDIOGRAM-3-320.jpg)

This document provides an overview of ECG interpretation, including: - The components of the ECG waveform and what each represents, such as the P wave for atrial depolarization and QRS complex for ventricular depolarization. - How to calculate heart rate by counting the number of large boxes between R waves. - Common arrhythmias like sinus tachycardia, bradycardia, and atrial fibrillation. - Interpreting abnormalities such as widened QRS indicating impaired ventricular conduction. - Relating changes in specific ECG leads to regions of the heart, helping localize conditions like ischemia or infarction.


