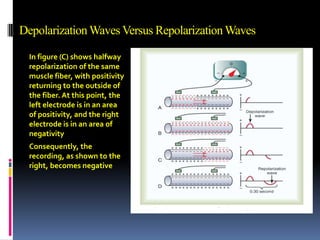
The electrocardiogramECG or EKGThe ECG is a measurement of the sum total of electrical activity generated by the heart measured from the surface of the bodyAn electrical record of the heart’s activityIt is one of the most valuable diagnostic tools for the recognition of a large variety of cardiac disorders
Characteristics of the normal electrocardiogramThe normal electrocardiogram is composed of:P wave: is caused by electrical potentials generated when the atria depolarizebefore atrial contraction beginsQRS complex: is caused by potentials generated when the ventricles depolarizebefore contraction	The P wave and the components of the QRS complex aredepolarization waves
T wave: is caused by potentials generated as the ventricles recover from the state of depolarization. the T wave is known as a repolarizationwaveThe electrocardiogram is composed of both depolarization and repolarization waves.
	The atrial repolarization wave, known as the atrial T wave, is usually obscured by the much larger QRS complex. For this reason, an atrial T wave seldom is observed in the electrocardiogram
The “PQRST”P wave - Atrial 	                                         		  depolarizationQRS - Ventricular 	      depolarization
T wave - Ventricular 	     		  repolarizationDepolarization Waves Versus Repolarization WavesIn figure (A) depolarization, The first half of the fiber has already depolarized, while the remaining half is still polarizedThe left electrode on the outside of the fiber is in an area of negativity, and the right electrode is in an area of positivity, this causes the meter to record positiveWhen depolarization has reached half way mark the record risen to maximum positive value
Depolarization Waves Versus Repolarization WavesIn figure (B) depolarization has extended over the entire muscle fiber, and the recording to the right has returned to the zero baseline because both electrodes are now in areas of equal negativity. The completed wave is a depolarization wave because it results from spread of depolarization along the muscle fiber membrane
Depolarization Waves Versus Repolarization WavesIn figure (C) shows halfway repolarization of the same muscle fiber, with positivity returning to the outside of the fiber. At this point, the left electrode is in an area of positivity, and the right electrode is in an area of negativityConsequently, the recording, as shown to the right, becomes negative
Depolarization Waves Versus Repolarization WavesIn figure (D) the muscle fiber has completely repolarized, and both electrodes are now in areas of positivity, so that no potential difference is recorded between them This completed negative wave is a repolarization wave because it results from spread of repolarization along the muscle fiber membrane
Relation of ventricle action potential to the QRS and T waves in the electrocardiogramNo potential is recorded in the electrocardiogram when the ventricular muscle is either completely polarized or completely depolarizedOnly when the muscle is partly polarized and partly depolarized does current flow from one part of the ventricles to another part, and therefore current also flows to the surface of the body to produce the electrocardiogram
The time of the onset of the P wave to the onset of the QRS complex is termed as PR interval. It represent the conduction time from the atrial to the ventricleThe time from the beginning of the Q wave to the end of the S wave is called the QRS interval. It indicates the time taken by the impulse to separate to the two ventricles
The time from the beginning of the Q wave to the end of T wave is called the QT interval. It represent the total electrical activity of ventriclesThe line between the QRS complex and T wave is called ST segment. It represent the time between completion of depolarization and onset of repolarization
The time interval from the apex of one R wave to the next R wave is called R-R intervalR-R interval is related to the heart rate or rate of ventricular contraction The time interval from the beginning of one P wave to the beginning of the next P wave is called P-P interval
Vertical Axis = VoltageVertical axis represents voltage on the EKGOne small box (1 mm) represents 0.10 mV
Horizontal Axis = Time1 small (1 mm) box = 0.04 seconds (40 ms)1 large (5 mm) box = 0.20 seconds (200 ms)5 large(5 mm) boxes = 1 second (1000 ms)15 large(5 mm) boxes = 3 seconds and is marked  on EKG paper
The ECG PaperHorizontallyOne small box - 0.04 sOne large box - 0.20 s VerticallyOne large box - 0.5 mV
The ECG Paper Every 3 seconds (15 large boxes) is marked by a vertical line.This helps when calculating the heart rate.NOTE: the following strips are not marked 	    but all are 6 seconds long.3 sec3 sec
Rhythm AnalysisStep 1:	Calculate rate.Step 2:	Determine regularity.Step 3:	Assess the P waves.Step 4:	Determine PR interval.Step 5:	Determine QRS duration.
Step 1: Calculate RateOption 1Count the # of R waves in a 6 second rhythm strip, then multiply by 10.Interpretation?3 sec3 sec9 x 10 = 90 bpm
Step 1: Calculate RateOption 2 Find a R wave that lands on a bold line.Count the # of large boxes to the next R wave. If the second R wave is 1 large box away the rate is 300, 2 boxes - 150, 3 boxes - 100, 4 boxes - 75, etc.  (cont)R wave
Step 1: Calculate RateOption 2 Interpretation?300150100756050Approx. 1 box less than 100 = 95 bpm
What is the heart rate?
Step 2 : Determine RegularityRegular: If the difference between the longest R-R interval in the ECG and the shortest R-R interval is less than 0.12 secondIrregular: If the difference between the longest R-R interval in the ECG and the shortest R-R interval is greater than 0.12 second
Step 2: Determine regularityLook at the R-R distances (using a caliper or markings on a pen or paper).Interpretation?RRRegular
Step 3: Assess the P wavesAre there P waves?Do the P waves all look alike?Do the P waves occur at a regular rate?Is there one P wave before each QRS?Interpretation?Normal P waves with 1 P wave for every QRS
Step 4: Determine PR intervalNormal: 0.12 - 0.20 seconds.		        (3 - 5 boxes)Interpretation?0.12 seconds
Step 5: QRS durationNormal: 0.04 - 0.12 seconds.                 (1 - 3 boxes)Interpretation?0.08 seconds
Rhythm SummaryRate				90-95 bpm	Regularity			regularP waves				normalPR interval			0.12 sQRS duration			0.08 sInterpretation?Normal Sinus Rhythm

Lec51()

  • 1.
    The electrocardiogramECG orEKGThe ECG is a measurement of the sum total of electrical activity generated by the heart measured from the surface of the bodyAn electrical record of the heart’s activityIt is one of the most valuable diagnostic tools for the recognition of a large variety of cardiac disorders
  • 2.
    Characteristics of thenormal electrocardiogramThe normal electrocardiogram is composed of:P wave: is caused by electrical potentials generated when the atria depolarizebefore atrial contraction beginsQRS complex: is caused by potentials generated when the ventricles depolarizebefore contraction The P wave and the components of the QRS complex aredepolarization waves
  • 3.
    T wave: iscaused by potentials generated as the ventricles recover from the state of depolarization. the T wave is known as a repolarizationwaveThe electrocardiogram is composed of both depolarization and repolarization waves.
  • 4.
    The atrial repolarizationwave, known as the atrial T wave, is usually obscured by the much larger QRS complex. For this reason, an atrial T wave seldom is observed in the electrocardiogram
  • 5.
    The “PQRST”P wave- Atrial depolarizationQRS - Ventricular depolarization
  • 6.
    T wave -Ventricular repolarizationDepolarization Waves Versus Repolarization WavesIn figure (A) depolarization, The first half of the fiber has already depolarized, while the remaining half is still polarizedThe left electrode on the outside of the fiber is in an area of negativity, and the right electrode is in an area of positivity, this causes the meter to record positiveWhen depolarization has reached half way mark the record risen to maximum positive value
  • 7.
    Depolarization Waves VersusRepolarization WavesIn figure (B) depolarization has extended over the entire muscle fiber, and the recording to the right has returned to the zero baseline because both electrodes are now in areas of equal negativity. The completed wave is a depolarization wave because it results from spread of depolarization along the muscle fiber membrane
  • 8.
    Depolarization Waves VersusRepolarization WavesIn figure (C) shows halfway repolarization of the same muscle fiber, with positivity returning to the outside of the fiber. At this point, the left electrode is in an area of positivity, and the right electrode is in an area of negativityConsequently, the recording, as shown to the right, becomes negative
  • 9.
    Depolarization Waves VersusRepolarization WavesIn figure (D) the muscle fiber has completely repolarized, and both electrodes are now in areas of positivity, so that no potential difference is recorded between them This completed negative wave is a repolarization wave because it results from spread of repolarization along the muscle fiber membrane
  • 10.
    Relation of ventricleaction potential to the QRS and T waves in the electrocardiogramNo potential is recorded in the electrocardiogram when the ventricular muscle is either completely polarized or completely depolarizedOnly when the muscle is partly polarized and partly depolarized does current flow from one part of the ventricles to another part, and therefore current also flows to the surface of the body to produce the electrocardiogram
  • 11.
    The time ofthe onset of the P wave to the onset of the QRS complex is termed as PR interval. It represent the conduction time from the atrial to the ventricleThe time from the beginning of the Q wave to the end of the S wave is called the QRS interval. It indicates the time taken by the impulse to separate to the two ventricles
  • 12.
    The time fromthe beginning of the Q wave to the end of T wave is called the QT interval. It represent the total electrical activity of ventriclesThe line between the QRS complex and T wave is called ST segment. It represent the time between completion of depolarization and onset of repolarization
  • 13.
    The time intervalfrom the apex of one R wave to the next R wave is called R-R intervalR-R interval is related to the heart rate or rate of ventricular contraction The time interval from the beginning of one P wave to the beginning of the next P wave is called P-P interval
  • 14.
    Vertical Axis =VoltageVertical axis represents voltage on the EKGOne small box (1 mm) represents 0.10 mV
  • 15.
    Horizontal Axis =Time1 small (1 mm) box = 0.04 seconds (40 ms)1 large (5 mm) box = 0.20 seconds (200 ms)5 large(5 mm) boxes = 1 second (1000 ms)15 large(5 mm) boxes = 3 seconds and is marked on EKG paper
  • 16.
    The ECG PaperHorizontallyOnesmall box - 0.04 sOne large box - 0.20 s VerticallyOne large box - 0.5 mV
  • 17.
    The ECG PaperEvery 3 seconds (15 large boxes) is marked by a vertical line.This helps when calculating the heart rate.NOTE: the following strips are not marked but all are 6 seconds long.3 sec3 sec
  • 18.
    Rhythm AnalysisStep 1: Calculaterate.Step 2: Determine regularity.Step 3: Assess the P waves.Step 4: Determine PR interval.Step 5: Determine QRS duration.
  • 19.
    Step 1: CalculateRateOption 1Count the # of R waves in a 6 second rhythm strip, then multiply by 10.Interpretation?3 sec3 sec9 x 10 = 90 bpm
  • 20.
    Step 1: CalculateRateOption 2 Find a R wave that lands on a bold line.Count the # of large boxes to the next R wave. If the second R wave is 1 large box away the rate is 300, 2 boxes - 150, 3 boxes - 100, 4 boxes - 75, etc. (cont)R wave
  • 21.
    Step 1: CalculateRateOption 2 Interpretation?300150100756050Approx. 1 box less than 100 = 95 bpm
  • 23.
    What is theheart rate?
  • 24.
    Step 2 :Determine RegularityRegular: If the difference between the longest R-R interval in the ECG and the shortest R-R interval is less than 0.12 secondIrregular: If the difference between the longest R-R interval in the ECG and the shortest R-R interval is greater than 0.12 second
  • 25.
    Step 2: DetermineregularityLook at the R-R distances (using a caliper or markings on a pen or paper).Interpretation?RRRegular
  • 26.
    Step 3: Assessthe P wavesAre there P waves?Do the P waves all look alike?Do the P waves occur at a regular rate?Is there one P wave before each QRS?Interpretation?Normal P waves with 1 P wave for every QRS
  • 27.
    Step 4: DeterminePR intervalNormal: 0.12 - 0.20 seconds. (3 - 5 boxes)Interpretation?0.12 seconds
  • 28.
    Step 5: QRSdurationNormal: 0.04 - 0.12 seconds. (1 - 3 boxes)Interpretation?0.08 seconds
  • 29.
    Rhythm SummaryRate 90-95 bpm Regularity regularPwaves normalPR interval 0.12 sQRS duration 0.08 sInterpretation?Normal Sinus Rhythm