Download as PDF, PPTX


![IRR Solution (Try 10%)
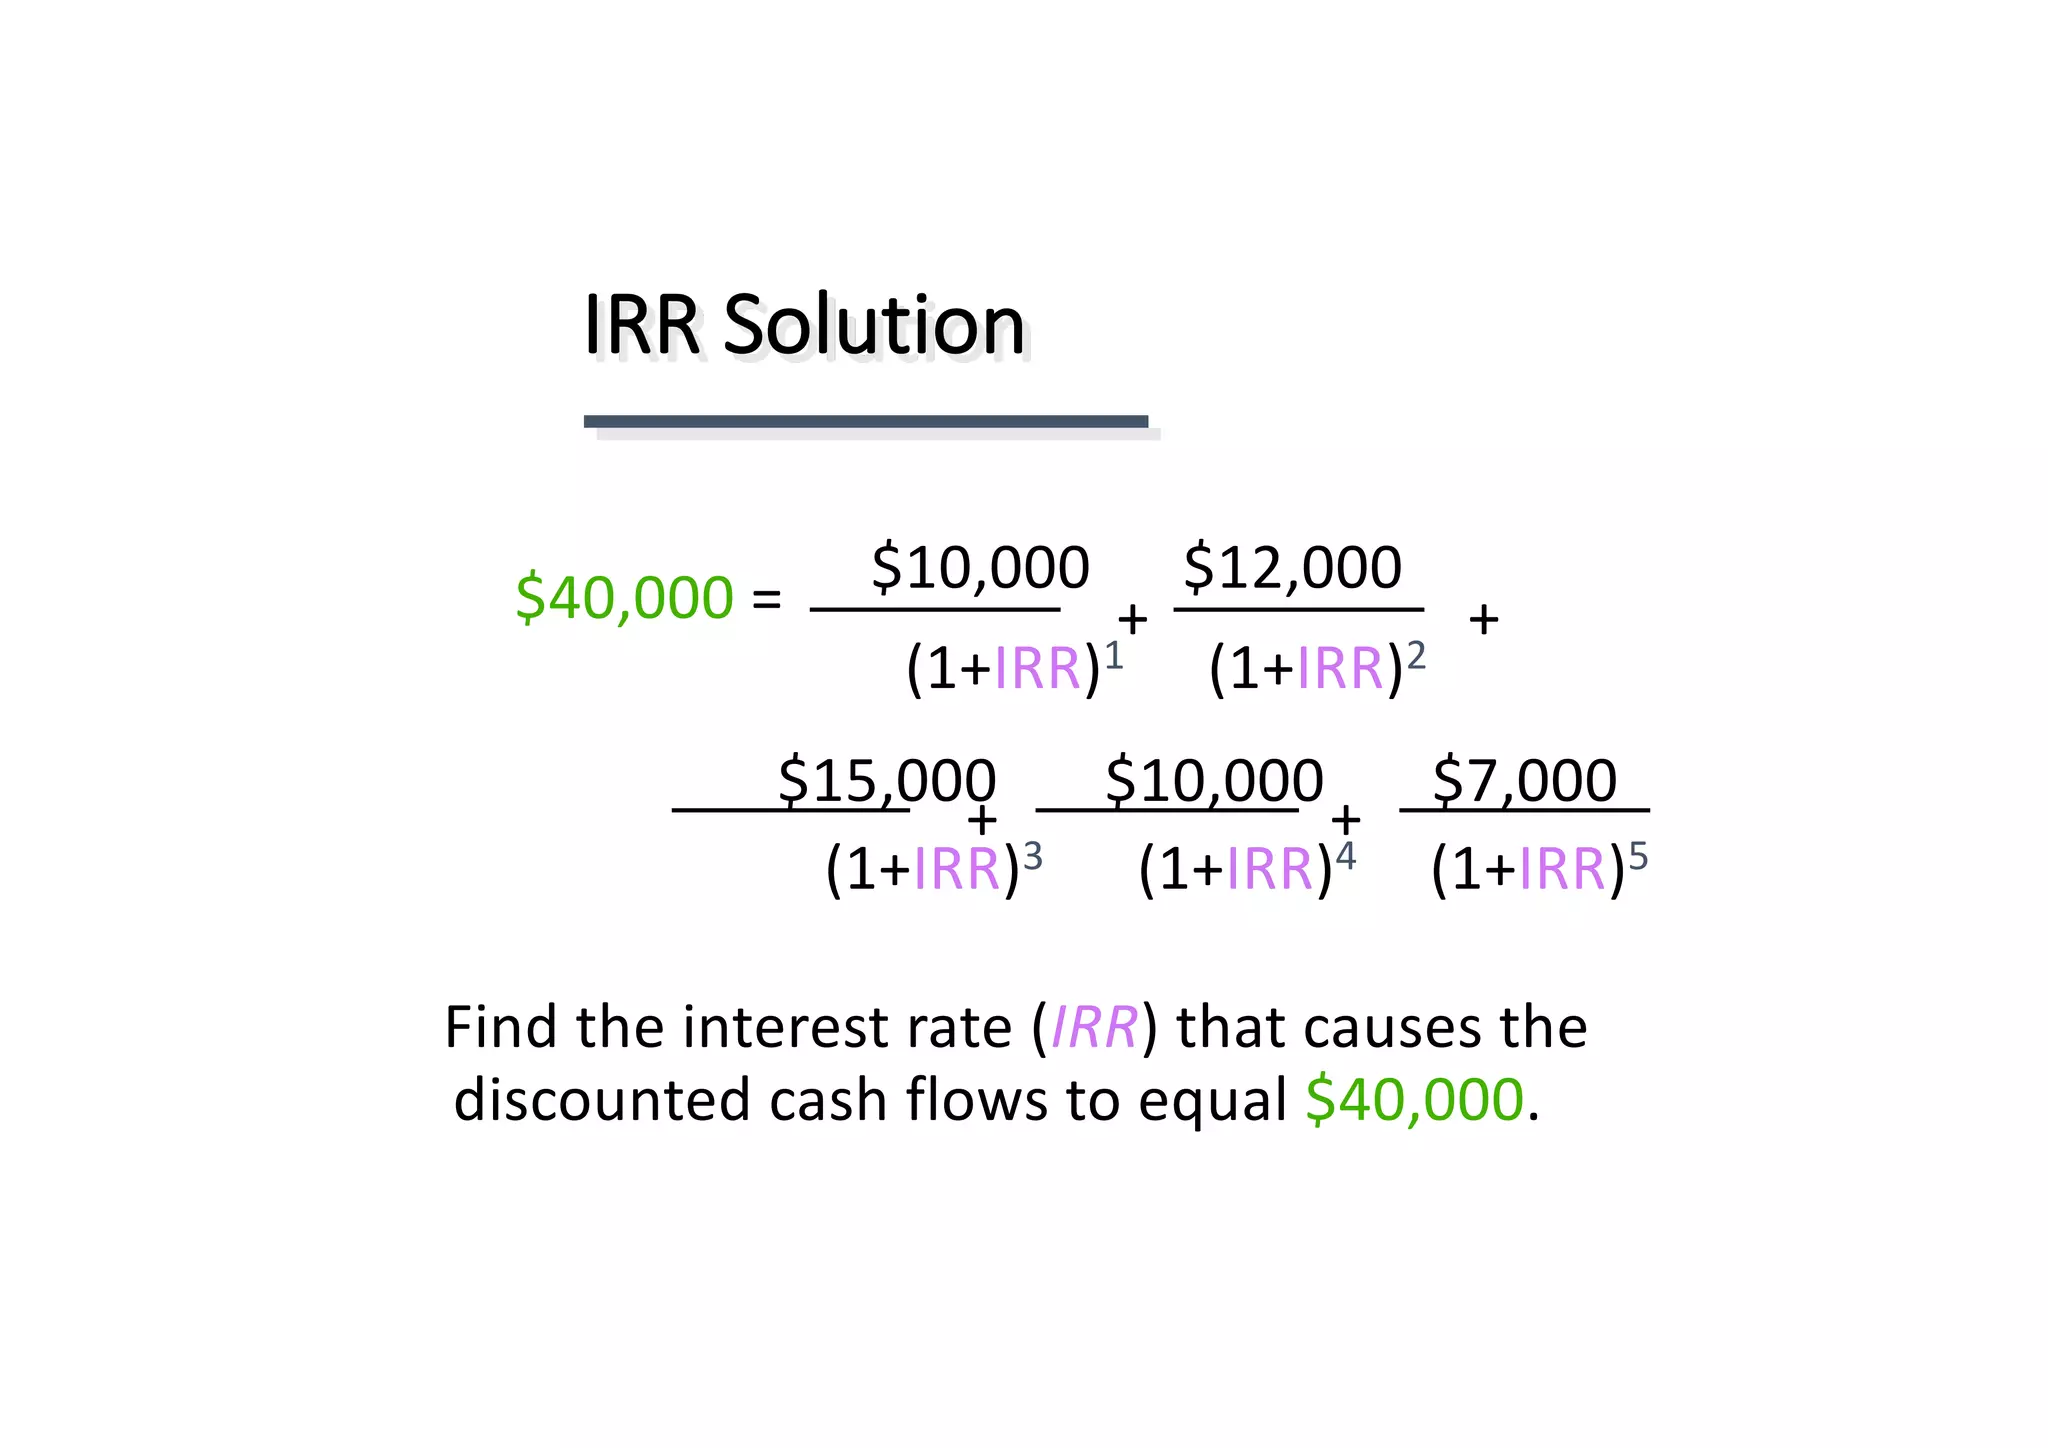
$40,000 = $10,000(PVIF10%,1) + $12,000(PVIF10%,2) +
$15,000(PVIF10%,3) + $10,000(PVIF10%,4) + $
7,000(PVIF10%,5)
$40,000 = $10,000(.909) + $12,000(.826) +
$15,000(.751) + $10,000(.683) +
$ 7,000(.621)
$40,000 = $9,090 + $9,912 + $11,265 +
$6,830 + $4,347
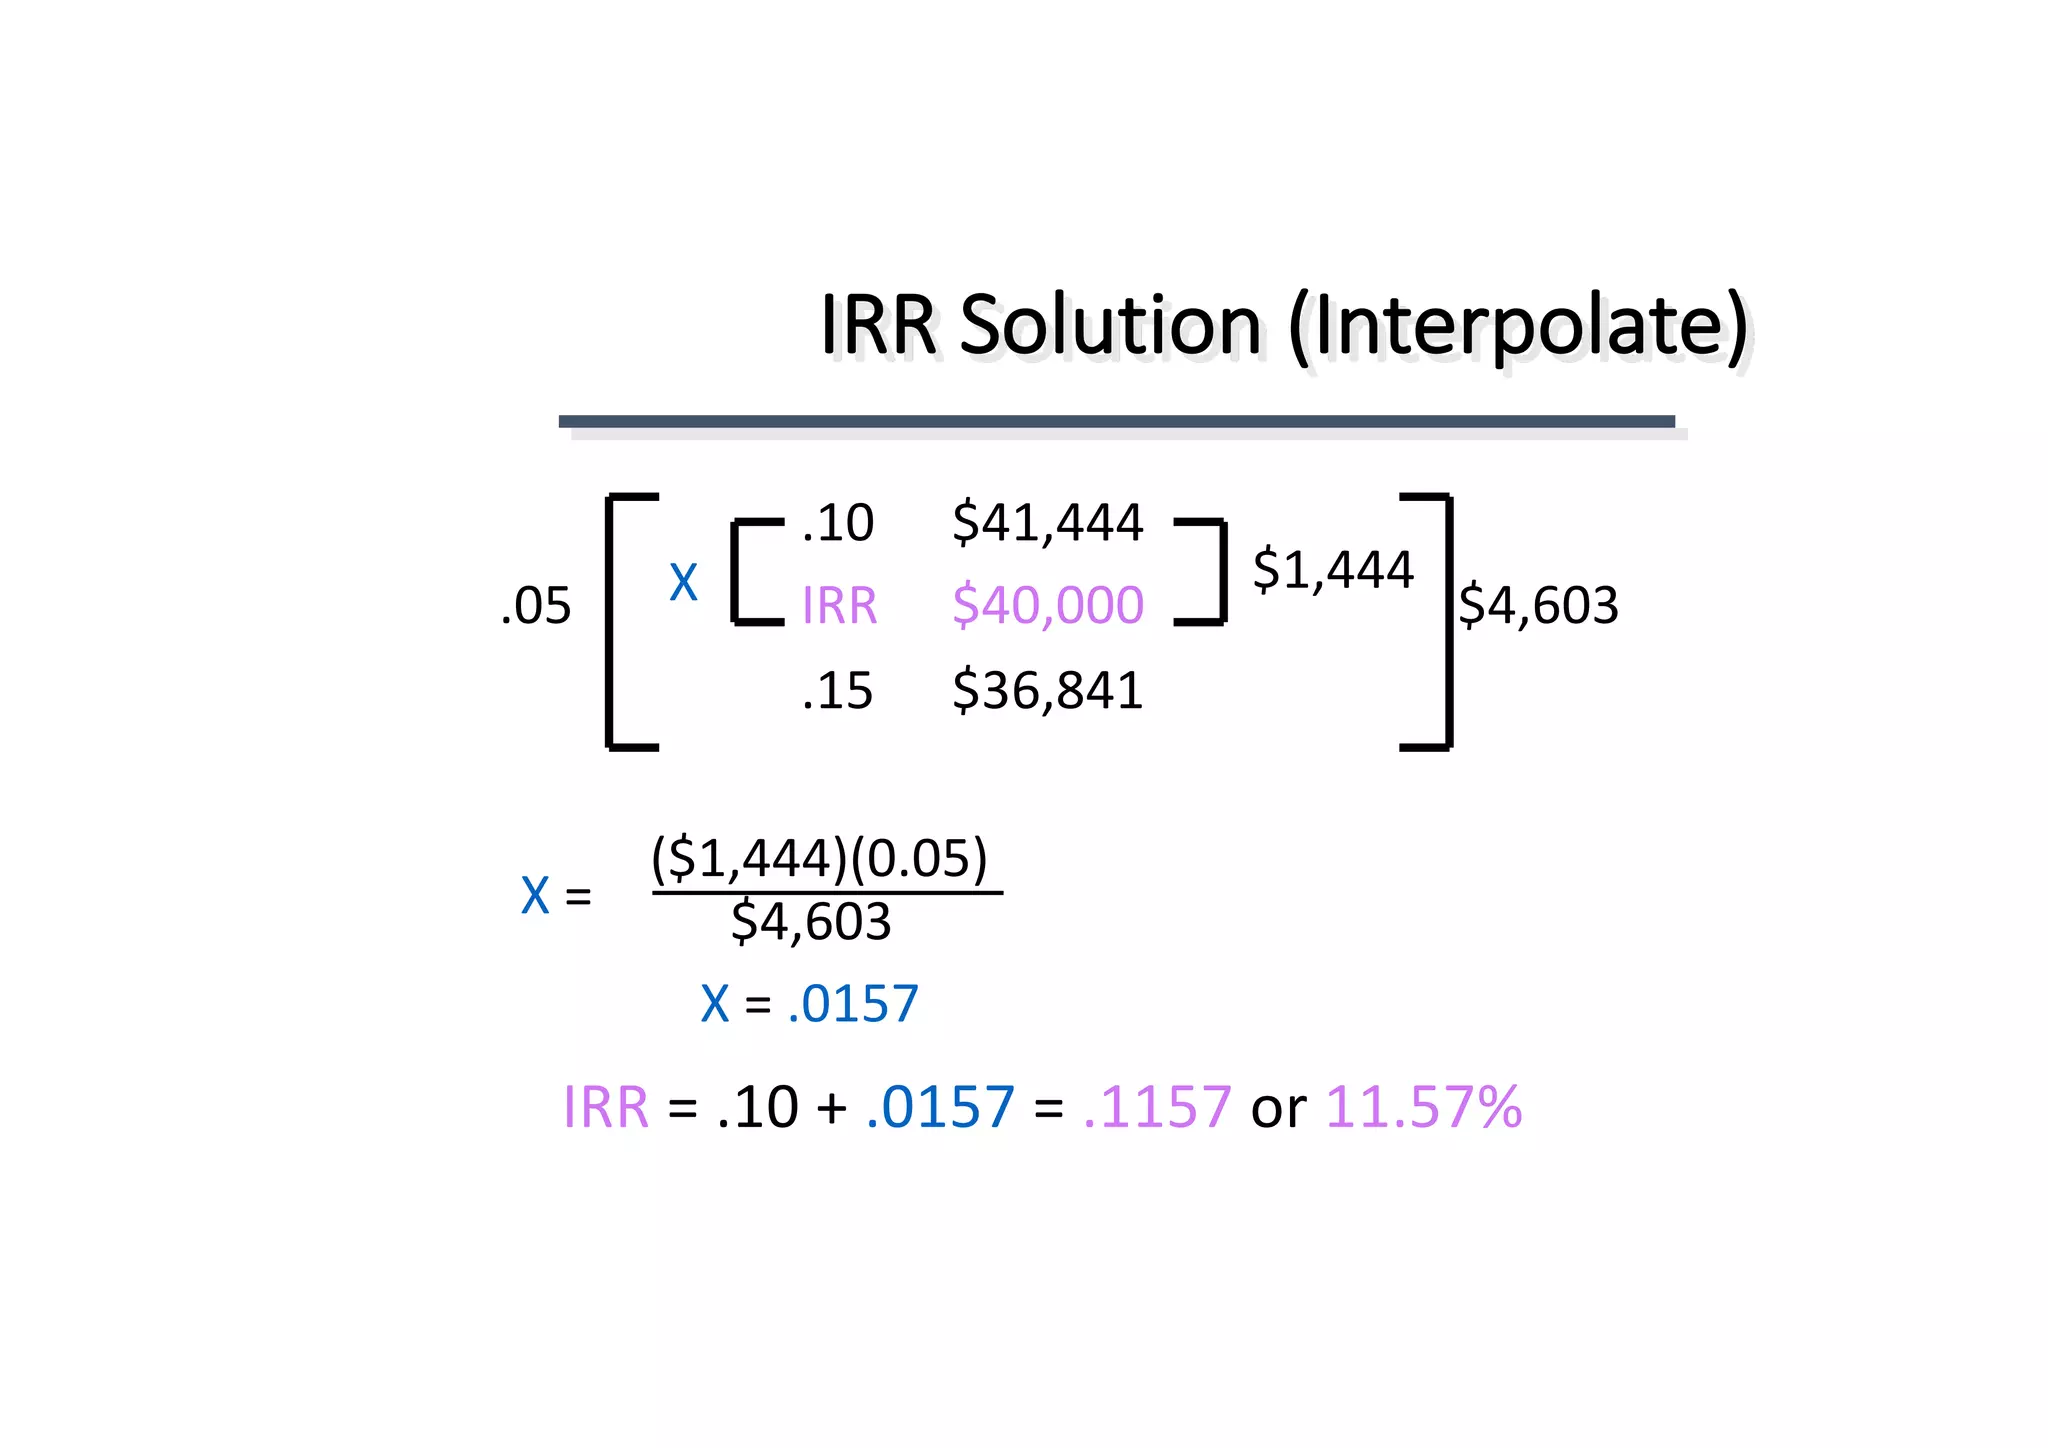
= $41,444 [Rate is too low!!]](https://image.slidesharecdn.com/npvirrpi-161105035500/75/Net-Present-Value-IRR-and-Profitability-Index-26-2048.jpg)
![IRR Solution (Try 15%)
$40,000 = $10,000(PVIF15%,1) + $12,000(PVIF15%,2) +
$15,000(PVIF15%,3) + $10,000(PVIF15%,4) + $
7,000(PVIF15%,5)
$40,000 = $10,000(.870) + $12,000(.756) +
$15,000(.658) + $10,000(.572) +
$ 7,000(.497)
$40,000 = $8,700 + $9,072 + $9,870 +
$5,720 + $3,479
= $36,841 [Rate is too high!!]](https://image.slidesharecdn.com/npvirrpi-161105035500/75/Net-Present-Value-IRR-and-Profitability-Index-27-2048.jpg)
![IRR Acceptance Criterion
No! The firm will receive 11.57% for each
dollar invested in this project at a cost of
13%. [ IRR < Hurdle Rate ]
The management of a company has
determined that the hurdle rate is 13% for
projects of this type.
Should this project be accepted?](https://image.slidesharecdn.com/npvirrpi-161105035500/75/Net-Present-Value-IRR-and-Profitability-Index-29-2048.jpg)
![Profitability Index (PI)
PI is the ratio of the present value of a
project’s future net cash flows to the
project’s initial cash outflow.
CF1 CF2 CFn
(1+k)1 (1+k)2 (1+k)n
+ . . . ++ ICOPI =
PI = 1 + [ NPV / ICO ]
<< OR >>](https://image.slidesharecdn.com/npvirrpi-161105035500/75/Net-Present-Value-IRR-and-Profitability-Index-38-2048.jpg)
![PI Acceptance Criterion
This. 1.00less than is PIThe No! means
that the project is not profitable. [Reject as PI <
1.00 ]
PI= $38,572 / $40,000
= .9643 (Method #1, 13-33)
Should this project be accepted?](https://image.slidesharecdn.com/npvirrpi-161105035500/75/Net-Present-Value-IRR-and-Profitability-Index-39-2048.jpg)


This document provides an overview of capital budgeting techniques, including net present value (NPV), internal rate of return (IRR), and payback period. It begins with definitions of key terms like present value, future value, and discounting. It then discusses how to calculate NPV and IRR using examples. The strengths and weaknesses of each method are reviewed. The document also demonstrates how to perform the calculations using a financial calculator.