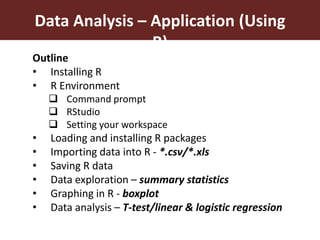
The document provides an overview of data analysis methods and concepts for graduate fellows. It covers:
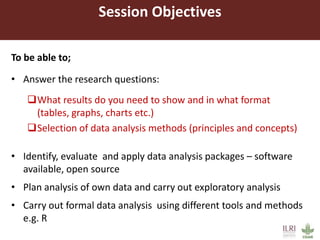
1) The objectives of translating research questions into an analysis plan, identifying appropriate data analysis methods and software, and conducting exploratory analysis.
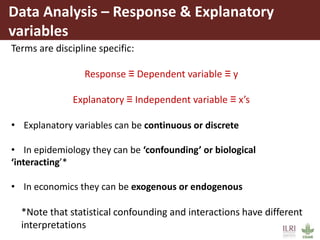
2) Key concepts in data analysis including response and explanatory variables, multi-level data structures, and exploratory versus confirmatory analysis.
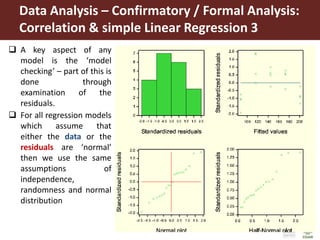
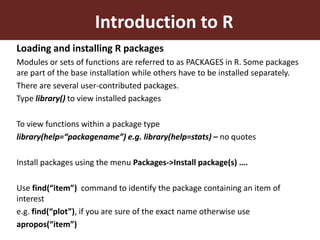
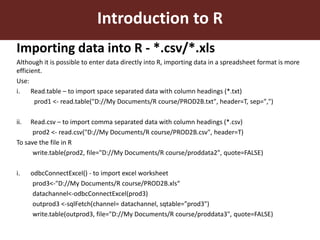
3) Guidance on specific exploratory analysis methods and examples of confirmatory analysis options using different statistical models depending on variable types.


![Zendesk reseller agreement worldwide template_dec_1_14[3]](https://cdn.slidesharecdn.com/ss_thumbnails/zendeskreselleragreementworldwidetemplatedec1143-150219083707-conversion-gate02-thumbnail.jpg?width=640&height=640&fit=bounds)


