This document provides an overview of quantitative data analysis and statistical tests. It discusses research questions, variables, descriptive and inferential statistics. Common statistical tests are explained like the Mann-Whitney U test, Spearman rank correlation, Kruskal-Wallis test, t-test, Pearson correlation, ANOVA, and chi-square test. Factors to consider when selecting a statistical test are highlighted like level of data, number of groups, independent or related groups, and data distribution. The document emphasizes keeping analyses simple and statistics in context of discussion.
Data presentation and interpretation I Quantitative ResearchJimnaira Abanto
Topics;
DATA PRESENTATION & INTERPRETATION
Preparation in writing your data analysis
Techniques in Data Processing
Presentation and Interpretation of Data
Using statistical Techniques (Sample)
In this lesson we discuss the different levels of measurement as we continue to explore data. Knowing such will enable us to plan the data collection process we need to employ in order to gather the appropriate data for analysis.
This presentation is about Quantitative Research, its types and important aspects including advantages and disadvantages, characteristics and definitions.
Data collection is a one of the major important topic in research study, It should be clear and understandable to all students, especially in graduate studies
Topics:
Quantitative research
Characteristics of Quantitative Research
Strengths of Quantitative Research
Weaknesses of Quantitative Research
Importance of Quantitative Research Across Fields
TYPES OF QUANTITATIVE RESEARCH DESIGN
Statistics What you Need to KnowIntroductionOften, when peop.docxdessiechisomjj4
Statistics: What you Need to Know
Introduction
Often, when people begin a statistics course, they worry about doing advanced mathematics or their math phobias kick in. Understanding that statistics as addressed in this course is not a math course at all is important. The only math you will do is addition, subtraction, multiplication, and division. In these days of computer capability, you generally don't even have to do that much, since Excel is set up to do basic statistics for you. The key elements for the student in this course is to understand the various types of statistics, what their requirements are, what they do, and how you can use and interpret the results. Referring back to the basic components of a valid research study, which statistic a researcher uses depends on several things:
The research question itself
The sample size
The type of data you have collected
The type of statistic called for by the design
All quantitative studies require a data set. Qualitative studies may use a data set or may use observations with no numerical data at all. For the purposes of the next modules, our focus will be on quantitative studies.
Types of Statistics
There are several types of statistics available to the researcher. Descriptive statistics provide a basic description of the data set. This includes the measures of central tendency: means, medians, and modes, and the measures of dispersion, including variances and standard deviations. Descriptive statistics also include the sample size, or "N", and the frequency with which each data point occurs in the data set.
Inferential statistics allow the researcher to make predictions, estimations, and generalizations about the data set, the sample, and the population from which the sample was drawn. They allow you to draw inferences, generalizations, and possibilities regarding the relationship between the independent variable and the dependent variable to indicate how those inferences answer the research question. Researchers can make predictions and estimations about how the results will fit the overall population. Statistics can also be described in terms of the types of data they can analyze. Non-parametric statistics can be used with nominal or ordinal data, while parametric statistics can be used with interval and ratio data types.
Types of Data
There are four types of data that a researcher may collect.
Nominal Data Sets
The Nominal data set includes simple classifications of data into categories which are all of equal weight and value. Examples of categories that are equal to each other include gender (male, female), state of birth (Arizona, Wyoming, etc.), membership in a group (yes, no). Each of these categories is equivalent to the other, without value judgments.
Ordinal Data Sets
Ordinal data sets also have data classified into categories, but these categories have some form or order or ranking attached, often of some sort of value / val.
Need a nonplagiarised paper and a form completed by 1006015 before.docxlea6nklmattu
Need a nonplagiarised paper and a form completed by 10/06/015 before 7:00pm. I have attached the documents along the rubics that must be followed.
Coyne and Messina Articles, Part 2 Statistical Assessment
Details:
1) Write a paper of 1,000-1,250 words regarding the statistical significance of outcomes as presented in Messina's, et al. article "The Relationship between Patient Satisfaction and Inpatient Admissions Across Teaching and Nonteaching Hospitals."
2) Assess the appropriateness of the statistics used by referring to the chart presented in the Module 4 lecture and the resource "Statistical Assessment."
3) Discuss the value of statistical significance vs. pragmatic usefulness.
4) Prepare this assignment according to the APA guidelines found in the APA Style Guide located in the Student Success Center. An abstract is not required.
5) This assignment uses a grading rubric. Instructors will be using the rubric to grade the assignment; therefore, students should review the rubric prior to beginning the assignment to become familiar with the assignment criteria and expectations for successful completion of the assignment.
Statistics: What you Need to Know
Introduction
Often, when people begin a statistics course, they worry about doing advanced mathematics or their math phobias kick in. Understanding that statistics as addressed in this course is not a math course at all is important. The only math you will do is addition, subtraction, multiplication, and division. In these days of computer capability, you generally don't even have to do that much, since Excel is set up to do basic statistics for you. The key elements for the student in this course is to understand the various types of statistics, what their requirements are, what they do, and how you can use and interpret the results. Referring back to the basic components of a valid research study, which statistic a researcher uses depends on several things:
·
The research question itself
·
The sample size
·
The type of data you have collected
·
The type of statistic called for by the design
All quantitative studies require a data set. Qualitative studies may use a data set or may use observations with no numerical data at all. For the purposes of the next modules, our focus will be on quantitative studies.
Types of Statistics
There are several types of statistics available to the researcher. Descriptive statistics provide a basic description of the data set. This includes the measures of central tendency: means, medians, and modes, and the measures of dispersion, including variances and standard deviations. Descriptive statistics also include the sample size, or "N", and the frequency with which each data point occurs in the data set.
Inferential statistics allow the researcher to make predictions, estimations, and generalizations about the data set, the sample, and the population from which the sample was drawn. They allow you to draw inferences, generaliza.
statistics/cf_choose_a_statistical_test (1) (1).pptx
Independent Variable [IV]
(number of groups)Dependent Variable [DV]
(measurement level) Two Groups
Three + Groups
Independent
(“unpaired”)Dependent
(“paired”)Independent
(“unpaired”)
Dependent
(“paired”)
CategoricalNon-parametric TestsChi-squareMcNemar’sChi-square
Cochran’s QOrdinal Mann-Whitney UWilcoxon Signed ranksKruskal Wallis HFriedman’sInterval / Ratio
(continuous)Parametric TestsIndependent
t-testDependent
t-testANOVARM-ANOVA
“What is the effect of TREATMENT (IV) on our OUTCOME (DV) of interest?”
Example: TREATMENT independent groups (placebo versus drug), OUTCOME interval/ratio (blood pressure)
Example: TREATMENT dependent group (pre/post yoga therapy), OUTCOME ordinal (back pain levels)
Example: TREATMENT independent 3+ groups (yoga therapy, none, aerobics), OUTCOME categorical (pass/fail of driving test)CorrelationsPhi coefficientSpearman’s rhoPearson’s r
Independent Variable
(number of groups)Dependent Variable (measurement level) Two Groups
Three + Groups
Independent
(“unpaired”)Dependent
(“paired”)Independent
(“unpaired”)
Dependent
(“paired”)
CategoricalNon-parametric TestsChi-squareMcNemar’sChi-square
Cochran’s QOrdinal Mann-Whitney UWilcoxon Signed ranksKruskal Wallis HFriedman’sInterval / Ratio
(continuous)Parametric TestsIndependent
t-testDependent
t-testANOVARM-ANOVA
STEP #1
Check what measurement level your DV is.
STEP #2
Choose the column related to the number Groups in your study.
STEP #3
Choose the column where intervention groups are either “paired” or “unpaired.”
STEP #4
Match your column with the row to find which test
to run.
STEP #1
Look at your Dependent Variable or outcome.
The data that we are looking at here is from the instruments you used to measure the effect of your intervention. Maybe you chose to measure stress with a commonly used psychological questionnaire or maybe you measured cholesterol levels or test scores.
What is its measurement level?
Categorical (such as yes or no; dead or alive; pass or fail).
Ordinal (such as health status – poor, average, excellent).
Interval ratio (for instance blood pressure, cholesterol level, rates of infection, or workplace satisfaction scores on a scale of 0-100).
STEP #2
Next you will look for the column that corresponds to the number of groups you have for your Independent Variable (also called experimental or predictor variable).
Remember, the independent variable is the thing in your study that was controlled by you (such as a medical intervention, or training initiative, or implementation of a modified protocol) for the purpose of making a change on some outcome in the population you are studying.
So…how many groups were involved in this intervention?
For example, if you were testing the effect of an evidence-based training initiative on employee workplace satisfaction or happiness, you might be interested in comparing the training initiative in one group to no training in another group..
Chapter 12Choosing an Appropriate Statistical TestiStockph.docxmccormicknadine86
Chapter 12
Choosing an Appropriate Statistical Test
iStockphoto/ThinkstockLearning Objectives
After reading this chapter, you will be able to. . .
· understand the importance of using the proper statistical analysis.
· identify the type of analysis based on four critical questions.
· use the decision tree to identify the correct statistical test.
Here we are in the final chapter that will pull all prior chapters together. Chapters 1 to 3 discussed descriptive statistics while the latterchapters, 4 to 11, discussed inferential statistics. Each of the inferential chapters presented a statistical concept then conducted the appropriateanalysis to be able to test a hypothesis. The big question for students learning statistics is, "How do I know if I'm using the correct statisticaltest?" For experienced statisticians this question is easy to answer as it is based on a few criteria. However, to a student just learning statisticsor to the novice researcher, this question is a legitimate one. Many statistical reference texts include a guide that asks specific questionsregarding the type of research question, design, number and scales of measurement of variables, and statistical assumption of the data thatallows you to use an elegant chart known as a decision tree. Based on the answers to these questions, the decision tree is used to helpdetermine the type of analysis to be used for the research, thereby helping you answer this big question.
12.1 Considerations
To make the correct decisions based on the use of a decision tree, there are four specific questions that must be answered. These questions areas follows:
· What is your overarching research question?
· How many independent, dependent, and covariate variables are used in the study?
· What are the scales of measurement of each of your variables?
· Are there violations of statistical assumptions?
If you are able to answer these specific questions, then you will be able to determine the proper analysis for your study. These questions arecritically important, and if they cannot be answered, then not enough thought has gone into the research. That said, let us discuss each ofthese questions so that they can be considered and answered in the use of the decision tree.
What Is Your Overarching Research Question?Try It!
Derive your ownresearch question foryour Master's Thesisor DoctoralDissertation. Have a colleague orprofessor read it. What are theirthoughts or suggestions forimprovements?
Answering this question seems simple enough as all research has an overarching research questionthat drives the study, especially since this dictates the type of quantitative methodology. There arekey words in every research question that help determine the appropriate type of analysis. Forinstance, if the research question states, "What are the effects of job satisfaction on employeeproductivity?" the keyword is "effects" as in the cause and effect of job satisfaction (theindependent variable) on productivity (th ...
Respond using one or more of the following approachesAsk a promickietanger
Respond using one or more of the following approaches:
Ask a probing question, substantiated with additional background information, and evidence.
Share an insight from having read your colleagues’ postings, synthesizing the information to provide new perspectives.
Group B
Inferential Statistics- Based on probability; used to draw conclusions or make generalizations about a given population or problem.
Example: “What can I infer about 5-minute Apgar scores of premature babies (the population) after calculating a mean Apgar score of 7.5 in a sample of 300 premature babies?” (McGonigle & Mastrain, p. 376, 2017).
Sampling Distributions- A sampling distribution is the frequency distribution of a statistic over many random samples from a single population.
Sampling Distribution of the Mean - as an example we randomly draw test scores from 25 students out of a total group of 5,000. We then calculate the mean, then draw a new group and repeat; each mean will serve as one datum, or data point.
Hypothesis Testing- is the use of statistics to determine the probability that a given hypothesis is true.
Null Hypothesis- the hypothesis that there is no significant difference between specified populations; or differences can be attributed to sampling or experimental error
Type 1 Error- This error occurs when we reject the null hypothesis when we should have retained it.
Type 2 Error- This error occurs when we fail to reject the null hypothesis. In other words, we believe that there isn’t a genuine effect when actually there is one.
Parametric statistics – A class of statistical tests that involve assumptions about the distribution of the variables and the estimation of a parameter.
Nonparametic statistics – A class of statistical tests that do not involve stringent assumptions about the distribution of variables. Between-subject design – A research design in which separate groups of people are compared (e.g. smokers and nonsmokers; intervention and control group subjects). Within-subject design – A research design in which a single group of participants is compared under different conditions or different points in time (e.g. before and after surgery).
Two classes of Statistical Tests:
Parametric tests - tests involving an estimation of a parameter, the use of interval or ratio-level data, and the assumption of normally distributed variables. Include t-tests and ANOVA.
Nonparametric tests - used when the data are nominal or ordinal or when a normal distribution cannot be assumed. Include the Mann-Whitney U test, Wilcoxon signed - rank test, and Kruskal - Wallis test.
Statistical Tests
T-test parametric procedure identifying mean differences for two independent groups, like experiment versus control or dependent groups, like pretreatment and post-treatment scores.
One - way ANOVA - tests the relationship between one categorical independent variable, such as different interventions, and a continuous dependent variable.
...
Students, digital devices and success - Andreas Schleicher - 27 May 2024..pptxEduSkills OECD
Andreas Schleicher presents at the OECD webinar ‘Digital devices in schools: detrimental distraction or secret to success?’ on 27 May 2024. The presentation was based on findings from PISA 2022 results and the webinar helped launch the PISA in Focus ‘Managing screen time: How to protect and equip students against distraction’ https://www.oecd-ilibrary.org/education/managing-screen-time_7c225af4-en and the OECD Education Policy Perspective ‘Students, digital devices and success’ can be found here - https://oe.cd/il/5yV
Instructions for Submissions thorugh G- Classroom.pptxJheel Barad
This presentation provides a briefing on how to upload submissions and documents in Google Classroom. It was prepared as part of an orientation for new Sainik School in-service teacher trainees. As a training officer, my goal is to ensure that you are comfortable and proficient with this essential tool for managing assignments and fostering student engagement.
The French Revolution, which began in 1789, was a period of radical social and political upheaval in France. It marked the decline of absolute monarchies, the rise of secular and democratic republics, and the eventual rise of Napoleon Bonaparte. This revolutionary period is crucial in understanding the transition from feudalism to modernity in Europe.
For more information, visit-www.vavaclasses.com
How to Create Map Views in the Odoo 17 ERPCeline George
The map views are useful for providing a geographical representation of data. They allow users to visualize and analyze the data in a more intuitive manner.
Ethnobotany and Ethnopharmacology:
Ethnobotany in herbal drug evaluation,
Impact of Ethnobotany in traditional medicine,
New development in herbals,
Bio-prospecting tools for drug discovery,
Role of Ethnopharmacology in drug evaluation,
Reverse Pharmacology.
Model Attribute Check Company Auto PropertyCeline George
In Odoo, the multi-company feature allows you to manage multiple companies within a single Odoo database instance. Each company can have its own configurations while still sharing common resources such as products, customers, and suppliers.
How to Make a Field invisible in Odoo 17Celine George
It is possible to hide or invisible some fields in odoo. Commonly using “invisible” attribute in the field definition to invisible the fields. This slide will show how to make a field invisible in odoo 17.
Operation “Blue Star” is the only event in the history of Independent India where the state went into war with its own people. Even after about 40 years it is not clear if it was culmination of states anger over people of the region, a political game of power or start of dictatorial chapter in the democratic setup.
The people of Punjab felt alienated from main stream due to denial of their just demands during a long democratic struggle since independence. As it happen all over the word, it led to militant struggle with great loss of lives of military, police and civilian personnel. Killing of Indira Gandhi and massacre of innocent Sikhs in Delhi and other India cities was also associated with this movement.
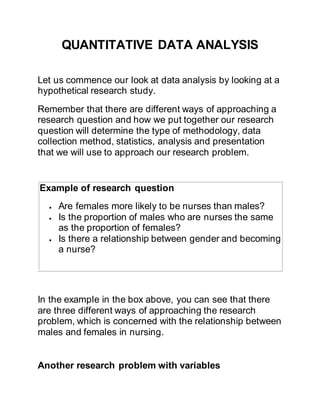
1. QUANTITATIVE DATA ANALYSIS
Let us commence our look at data analysis by looking at a
hypothetical research study.
Remember that there are different ways of approaching a
research question and how we put together our research
question will determine the type of methodology, data
collection method, statistics, analysis and presentation
that we will use to approach our research problem.
Example of research question
Are females more likely to be nurses than males?
Is the proportion of males who are nurses the same
as the proportion of females?
Is there a relationship between gender and becoming
a nurse?
In the example in the box above, you can see that there
are three different ways of approaching the research
problem, which is concerned with the relationship between
males and females in nursing.
Another research problem with variables
2. In another research problem - the relationship between
gender and smoking, there are 2
categorical variables(gender & smoker), with two or more
categories in each, for example:
Gender (male/female)
Smoker (yes/no)
You are looking for whether or not there is any
significance in the results
Reflection
Before we proceed, you may want to briefly refresh your
knowledge and understanding of some basics, namely:
hypothesis
randomised controlled double-blind trial
variables
descriptive statistical analysis
inferential statistical analysis
To recap on statistics, read chapter 9 of the
accompanying book, and/or click on the hyperlink below:
statistics are fun
Now to return to statistical analysis
3. Alpha level (p level)
In statistical analysis we are looking to see if there is any
significance in the results. The acceptance or rejection of
a hypothesis is based upon a level of significance – the
alpha () level
This is usually set at the 5% (0.05) level, followed in
popularity by the 1% (0.01) level
We usually designate these as p, i.e. p =0.05 or p = 0.01
So, what do we mean by levels of significance that the 'p'
value can give us?
Statistical tests
There are many tests that we can use to analyse our data,
and which particular one we use to analyse our data
depends upon what we are looking for, and what data we
collected (and how we collected it).
Below are just a few of the more common ones that you
may come across in research papers.
Mann-Whitney U-test
This test is used to test for differences between 2
independent groups on a continuous measure, e.g. do
4. males and females differ in terms of their levels of self-
esteem.
This test requires two variables (e.g. male/female gender)
and one continuous variable (e.g. self-esteem).
It actually compares medians.
It converts the scores on the continuous variable
to ranks, across the two groups.
It then evaluates whether the medians for the two groups
differ significantly.
Spearman rank correlation test
This test is used to demonstrate the relationship between
two ranked variables
Frequently used to compare judgements by a group of
judges on two objects, or the scores of a group of
subjects on two measures.
This is a coefficient correlation based on ranks.
It shows the association between two variables (X and Y),
which are not normally distributed.
5. Don’t worry about the details – just remember that it is an
acceptable method for parametric data when there are
less than 30 but more than 9 paired variables.
Kruskal-Wallis test
This test is used to compare the means among more than
two samples, when either the data are ordinal or the
distribution is not normal.
If there are only two groups then it is the equivalent of the
Mann-Whitney U-test, so you may as well use that test.
This test would normally be used when you wanted to
determine the significance of difference among three or
more groups.
Below is a very brief look at other common tests - for more
information on statistical tests, read chapter 9 of the
accompanying book.
Other Common Statistical Tests/Procedures
6. t-test
The t-test assesses whether the means of two groups
are statisticallydifferent from each other. This analysis is appropriate
whenever you want to compare the means of two groups.
Pearson Correlation
We use the Pearson's correlation in order to find a correlation
between at least two continuous variables. The value for such a
correlation lies between 0.00 (no correlation) and 1.00 (perfect
correlation).
ANOVA (Analysis of Variance)
ANOVA is one of a number of tests (ANCOVA - analysis of
covariance - and MANOVA - multivariate analysis of variance) that
are used to describe/compare the relationship among a number of
groups.
7. Chi-square test
There are two different types of chi-square tests - but both involve
categorical data (Pallant 2001).
One type of chi-square test compares the frequency count of what is
expected in theory against what is actually observed.
The second type of chi-square test is known as a chi-square test
with two variables or the chi-square test for independence.
Wilcoxon signed-rank test
This is the most common nonparametric test for the two-sampled
repeated measures design of research study, and is also known as
the Wilcoxon matched-pairs test.
This has just been a very brief look at some of the more
common statistical tests for the analysis of data obtained
from quantitative research - more details are given in
chapter 9 of the accompanying book. There are, of course,
many others, and any good statistics book will have details
of them.
Selecting your statistical test
8. When it comes to the selection of the appropriate test for
your research in order to determine the p-value, you need
to base the selection of four major factors, namely:
The level of data (nominal, ordinal, ratio, or interval).
The number of groups/samples in your research study
(one, two, or more).
Were the data collected from independent
groups/samples or from related groups? Remember
that independent groups are two or more separated
groups of participants, whilst related groups are often
the same group, but at a different time in the study,
e.g. pre- and post-testing, or even a different
environment.
The characteristics of the data (i.e. the distribution of
the data).
Now all these statistical tests may look very complicated,
but if ever you are involved in quantitative research and
have to do statistical analysis, don't worry because help is
at hand.
There is a computer package for statistical analysis known
as SPSS
SPSS stands for:
Statistical Package for Social Sciences
9. SPSS is one of a number of computer packages that can
do just about any calculation that you want, using any
statistical test.
Before we finish this section, we just need to remind you
to be careful when you are looking at research that uses
statistics.
Limitations of research study/data/statistical tests
Always look for these – the researchers should reflect on
their study and discuss anything that did not make it
perfect, for example:
size of sample
tests used
initial question
It is easy to tie yourself up into knots when either doing
statistics as part of your research, or when reading
research papers, so remember two things:
1. Keep things simple
2. Statistics by themselves are meaningless, it is the
analysis and
discussion of statistics which makes them meaningful
and brings
them to life.
Finally
10. The time has come for you to decide which statistical test
you will be using for your own quantitative research. As we
keep mentioning, if all this is new to you, do not hesitate to
seek the advice of an experienced quantitative researcher
and/or a statistician - at as early a stage as possible.
TO DO
Click on to the icon below for the example of a
quantitative research study proposal:
When you are satisfied that you have the correct
statistical test(s), and you can justify it/them, then write
them into your research proposal.