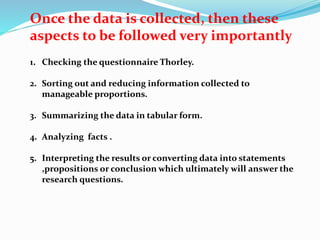
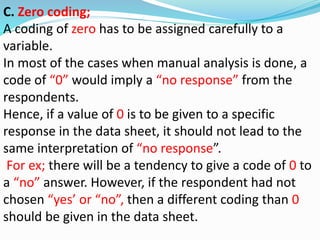
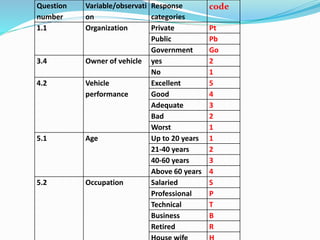
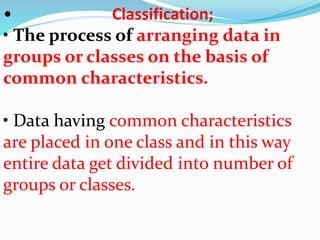
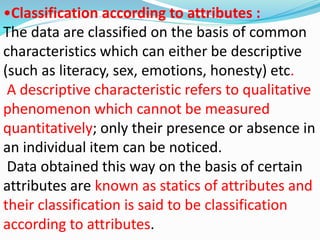
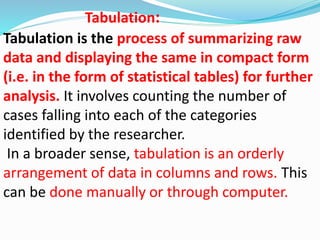
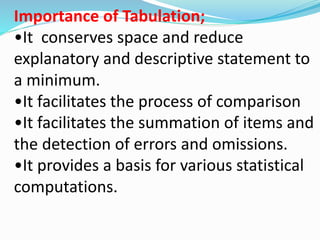
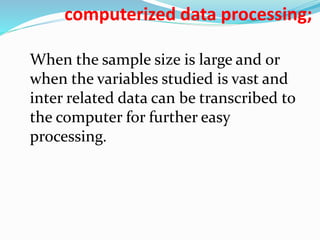
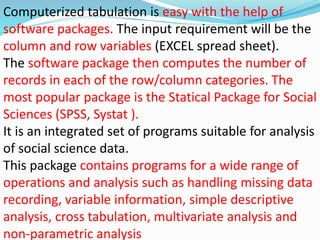
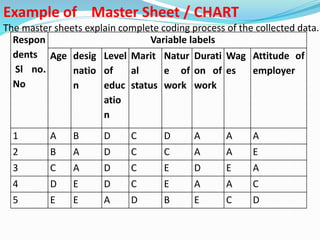
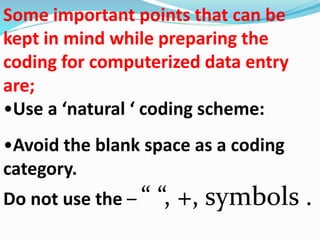
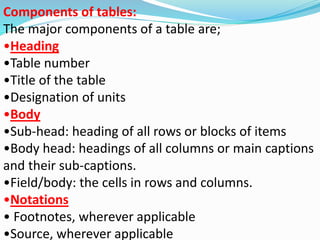
 DATA ANLYSIS 
 BY ; 
 Ms. KAVITHA. M. R
Introduction; 
Once the data are collected with the 
researcher turns his focus of attention on 
their processing. 
A researcher has to make his plan for each 
and every stage of the research process. 
As such, good researcher makes a perfect 
plan of processing and analysis of data. To 
some researchers data processing and 
analysis is not a very serious activity.
Introduction; 
Data process is an intermediary stage of work 
between data collection and data analysis. 
The collected data through various tools such 
as interview schedule, questionnaires, data 
sheets, and field notes contains a vast mass of 
data. 
And these collected information doesn’t gives 
straight away answers to research questions. 
The collected data is in raw materials, so it 
needs processing.
Data processing consists of a 
number of closely related 
operations; 
•Editing 
•Coding and Classification 
•Tabulation
Once the data is collected, then these 
aspects to be followed very importantly 
1. Checking the questionnaire Thorley. 
2. Sorting out and reducing information collected to 
manageable proportions. 
3. Summarizing the data in tabular form. 
4. Analyzing facts . 
5. Interpreting the results or converting data into statements 
,propositions or conclusion which ultimately will answer the 
research questions.
Editing: 
Editing of data is a process of examining the collected 
raw data to detect errors and omissions and to 
correct these when possible. 
• a careful scrutiny of the completed questionnaires 
and the schedule. 
• Editing is done to assure that the data are accurate, 
consistent with other facts gathered, uniformly 
entered, as completed as possible and have been well 
arranged to facilitate coding and tabulation.
The editing could be classified as; 
1. Field editing and 
2. central editing.
•Field Editing; 
Field editing consists in the review of the reporting 
forms by the investigator for completing (translating 
or rewriting) what the letter has written in 
abbreviated and or ill illegible form at the time of 
recording the respondent’s response. 
 it is done as soon as possible after the interview, 
preferably on the very day or on the next day. 
 field editing the investigator must restrain him and 
must not correct errors of omission by simply 
guessing what the informant would have said if the 
question had been asked.
•Central Editing; 
Central editing takes place when all forms or 
schedules have been completed and returned 
to the office. 
 This can be done by individual in case of 
small study, whereas in the larger studies a 
team of editors will do the editing.
The editors would edit the inappropriate 
on missing replies; the editor can 
sometimes determine the proper answer 
by reviewing the other information in the 
schedule. 
Sometimes the respondents can be 
contacted for the clarifications.
Important aspects in the editing process are; 
1. Completeness; 
2. Accuracy; 
3. Uniformity;
Coding ; 
Coding process assigns numerals or other 
symbols to the several responses of the 
data set. 
In simple coding is translating answers 
into numerical values or assigning 
symbols/ numbers to the various 
categories of variables to be used in 
data analysis.
Coding is necessary for efficient 
analysis and through it the several 
replies may be reduced to a small 
number of classes which contain 
the critical information required 
for analysis.
A. Numerical coding; 
Coding need not necessarily be 
numeric, it can also be alphabetic. 
Coding has to be compulsorily 
numeric, when the variable is to be 
subject to further parametric 
analysis
B. Alphabetic coding; 
A mere tabulation or 
frequency count or 
graphical representation of 
the variable may be given 
an alphabetic coding.
C. Zero coding; 
A coding of zero has to be assigned carefully to a 
variable. 
In most of the cases when manual analysis is done, a 
code of “0” would imply a “no response” from the 
respondents. 
Hence, if a value of 0 is to be given to a specific 
response in the data sheet, it should not lead to the 
same interpretation of “no response”. 
For ex; there will be a tendency to give a code of 0 to 
a “no” answer. However, if the respondent had not 
chosen “yes’ or “no”, then a different coding than 0 
should be given in the data sheet.
Question 
number 
Variable/observati 
on 
Response 
categories 
code 
1.1 Organization Private Pt 
Public Pb 
Government Go 
3.4 Owner of vehicle yes 2 
No 1 
4.2 Vehicle 
performance 
Excellent 5 
Good 4 
Adequate 3 
Bad 2 
Worst 1 
5.1 Age Up to 20 years 1 
21-40 years 2 
40-60 years 3 
Above 60 years 4 
5.2 Occupation Salaried S 
Professional P 
Technical T 
Business B 
Retired R 
House wife H
• Classification; 
• The process of arranging data in 
groups or classes on the basis of 
common characteristics. 
• Data having common characteristics 
are placed in one class and in this way 
entire data get divided into number of 
groups or classes.
•Classification according to attributes : 
The data are classified on the basis of common 
characteristics which can either be descriptive 
(such as literacy, sex, emotions, honesty) etc. 
A descriptive characteristic refers to qualitative 
phenomenon which cannot be measured 
quantitatively; only their presence or absence in 
an individual item can be noticed. 
Data obtained this way on the basis of certain 
attributes are known as statics of attributes and 
their classification is said to be classification 
according to attributes.
•Classification according to class-interval: 
The numerical characteristics refer to 
quantitative phenomenon which can be 
measured through some stastical units. 
Data retaining to income, production, age 
weight etc. 
Such data are called as stastics of variables and 
are classified on the basis of class intervals. 
For ex; persons whose income says are within 
Rs 202-Rs 400 can form one group, those whose 
incomes are within Rs 401- Rs 600 can another 
group.
In the case of open ended questions 
to classify responses the researcher 
looks for major characteristics of the 
responses and puts accordingly.
In case of attitude scales a researcher has to 
keep in mind the direction or weightage of 
responses. 
Forex; when responses “strongly agree” is 
coded as 5 the subsequent codes would be in 
order. 
Therefore, if there are responses like “agree” 
“undecided” , “ disagree” and “ strongly 
Disagree”, they have to be coded as 4,3,2, and 
1.
The matrix questions have to be coded taking 
into consideration each cell as one variable. 
For ex; if the column of matrix represents 
employment status, namely “permanent” and 
“temporary” and the row represents employers 
or type of employer, namely, government and 
private, the first cell would represent a variable 
“government permanent” . 
The second cell would represent “government 
temporary” and so on.
Tabulation: 
Tabulation is the process of summarizing raw 
data and displaying the same in compact form 
(i.e. in the form of statistical tables) for further 
analysis. It involves counting the number of 
cases falling into each of the categories 
identified by the researcher. 
In a broader sense, tabulation is an orderly 
arrangement of data in columns and rows. This 
can be done manually or through computer.
Importance of Tabulation; 
•It conserves space and reduce 
explanatory and descriptive statement to 
a minimum. 
•It facilitates the process of comparison 
•It facilitates the summation of items and 
the detection of errors and omissions. 
•It provides a basis for various statistical 
computations.
computerized data processing; 
When the sample size is large and or 
when the variables studied is vast and 
inter related data can be transcribed to 
the computer for further easy 
processing.
Computerized tabulation is easy with the help of 
software packages. The input requirement will be the 
column and row variables (EXCEL spread sheet). 
The software package then computes the number of 
records in each of the row/column categories. The 
most popular package is the Statical Package for Social 
Sciences (SPSS, Systat ). 
It is an integrated set of programs suitable for analysis 
of social science data. 
This package contains programs for a wide range of 
operations and analysis such as handling missing data 
recording, variable information, simple descriptive 
analysis, cross tabulation, multivariate analysis and 
non-parametric analysis
Example of Master Sheet / CHART 
The master sheets explain complete coding process of the collected data. 
Respon 
dents 
Sl no. 
No 
Variable labels 
Age desig 
natio 
n 
Level 
of 
educ 
atio 
n 
Marit 
al 
status 
Natur 
e of 
work 
Durati 
on of 
work 
Wag 
es 
Attitude of 
employer 
1 A B D C D A A A 
2 B A D C C A A E 
3 C A D C E D E A 
4 D E D C E A A C 
5 E E A D B E C D
Some important points that can be 
kept in mind while preparing the 
coding for computerized data entry 
are; 
•Use a ‘natural ‘ coding scheme: 
•Avoid the blank space as a coding 
category. 
Do not use the – “ “, +, symbols .
Presentation and 
Interpretation of 
Data. 
Construction of 
frequency table:
Components of tables: 
The major components of a table are; 
•Heading 
•Table number 
•Title of the table 
•Designation of units 
•Body 
•Sub-head: heading of all rows or blocks of items 
•Body head: headings of all columns or main captions 
and their sub-captions. 
•Field/body: the cells in rows and columns. 
•Notations 
• Footnotes, wherever applicable 
•Source, wherever applicable
Types of tables; 
•Uni-variate /One way tables 
Uni-variate analysis refers to tables, which give 
data relating to one variable. 
Uni-variate tables, which are more commonly 
known as frequency distribution tables, how 
frequently an item repeats. 
Further properties of distribution can be found 
out by various measures of central tendencies.
Example 
The below table showing awareness of the respondents 
Level of 
awareness 
Distribution of respondents 
Frequencies % 
High 110 39.3 
Medium 106 37.9 
Low 64 21.8 
Total 280 100.0
•Bi-variate /Two way table: 
Distribution in terms of two or more variables and the relationship 
between two variables are shown in two- way tables. 
Example: table showing levels of awareness towards the Act and wage Differentials 
of the Respondents. 
Awareness 
about the 
ACT 
Wage differentials 
High Medium l Low Total 
High 94(66.2) 99(10.5) 7(13.5) 110(39.3 
) 
Medium 37(26.1) 58 (67.4) 11(21.2) 106(37.9 
) 
Low 11(7.7) 86(30.7) 52(14.6) 280(100. 
0) 
Total 142 86 52 280(100. 
0)
•Multi-variate Analysis: 
If the researcher is interested in assessing the 
joint effect of three or more variables, he uses 
the techniques of multi-variate analysis. 
The most common stastical technique used for 
multi-variate analysis is regression analysis. 
In the first step of multi-variable analysis, the 
researcher has to obtain the correlation 
between the variables which are having 
stastically significant correlation. 
These variables are put in the regression 
analysis.
Diagrammatic Representation: 
A diagram helps to understand the data easily. All stastical packages, MS 
Excel and Open Office offer a wide range of graphs. In case of qualitative 
data most common graphs are bar charts and pie charts. 
The most commonly used graphic forms may be grouped into the 
following categories; 
Graphs 
Histogram & Bar charts 
Pie chart 
Pictogram 
Pyramid Diagram
• Graph: 
The graph offers a visual presentation 
of the results. 
The line graph can also provide 
markers for each data point marker for 
each variable can be different to 
distinguish it from other variables. The 
marker also highlights the value at any 
specific point
14 
12 
10 
8 
6 
4 
2 
0 
Category 1 Category 2 Category 3 Category 4 
Series 3 
Series 2 
Series 1
•Histograms 
Histograms and bar charts have two axes that intersect at right angles. 
One axis (horizontal one) is divided into intervals representing the 
various possible values of the variables. The other axis (vertical one) is 
divided into intervals representing frequencies. Histogram depicts the 
data graphically with vertical bars adjacent to each others. 
6 
5 
4 
3 
2 
1 
0 
2 4 6 8 10
Bar chart: 
Bar charts are similar to histograms except that 
the bars are separated. Bar charts can be used 
for nominal level data to show different 
variables. Ex, diagram; 
7 
6 
5 
4 
3 
2 
1 
0 
1 2 3 4 
Series 3 
Series 2 
Series 1
Pie charts: 
Pie charts are circular charts divided into slices. Each slice 
represents a possible score and its size is proportional to 
occurrence of those scores in the sample. The component 
parts from the segments of the circle. The circle chart is 
usually a percentage chart. The data are converted to 
percentage of the total and the proportional segments; 
therefore give a clear picture of the relationship among the 
components. 
1.4 
1.2 
3.2 8.2 
1st Qtr 
2nd Qtr 
3rd Qtr 
4th Qtr
• Pictogram: 
Each picture represents (man, animal, vehicles, crops,) a 
certain number and total number of pictures gives the total 
number of events/ elements. Pictograms are an exciting way 
to summaries data and are often used in newspapers. 
Examples for pictogram;
•Pyramid diagram; 
Pyramid consists of many levels and presents one or two 
variables.
RESEARCH REPORT 
The final and very important step in a research study is to 
write its report. The research report is a means for 
communication our research experiences to others and 
adding them to the fund of knowledge.
Functions of research report; 
•It serve as a means for presenting the problem studied, 
methods and techniques used for collecting and analyzing 
data, the findings , conclusions and recommendations in an 
organized manner. 
•It serves as a basic reference material for future use in 
developing research proposal in the same or related area. 
•A report serves as a means for judging the quality of the 
completed research project. 
•It is a means for evaluating the researcher’s ability and 
competence to do research. 
•It provides factual base for formulating policies and 
strategies relating to the subject matter studied. 
•It provides systematic knowledge on problems and issues 
analyzed.
Different steps in writing report: 
•Logical analysis of the subject matter; 
•Preparation of the final out line 
•Preparation of the rough draft 
•Rewriting and polishing of the rough 
draft 
•Preparation of the final bibliography 
•Writing the final draft
Planning report writing; 
•The target audience 
•The communication characteristic of 
audience. 
•The intended purposes of the report 
•The type of report 
•The scope of the report 
•The style of reporting 
•The format of report 
•Outline/time table of the report
BIBILOGRAPHY; 
•Methodology of research in social sciences – 
Dr.O.R. Krishnaswami, Himalayan publishing house, 
1999. 
•Research for social workers ,An introduction to 
methods, 2nd edition 
Margaret Alston , Wendy Bowles 
•Research Methodology Methods and techniques 
(Second Revised Edition 2004) & third edition 2014. 
C. R. Kothari, New Age International Publishers. 
•Practice of social research – social work perspective 
D.K.Lal Das 
Rawat publication, 2004.
THANK YOU

Data analysis copy

  • 1.
     DATA ANLYSIS  BY ;  Ms. KAVITHA. M. R
  • 2.
    Introduction; Once thedata are collected with the researcher turns his focus of attention on their processing. A researcher has to make his plan for each and every stage of the research process. As such, good researcher makes a perfect plan of processing and analysis of data. To some researchers data processing and analysis is not a very serious activity.
  • 3.
    Introduction; Data processis an intermediary stage of work between data collection and data analysis. The collected data through various tools such as interview schedule, questionnaires, data sheets, and field notes contains a vast mass of data. And these collected information doesn’t gives straight away answers to research questions. The collected data is in raw materials, so it needs processing.
  • 4.
    Data processing consistsof a number of closely related operations; •Editing •Coding and Classification •Tabulation
  • 5.
    Once the datais collected, then these aspects to be followed very importantly 1. Checking the questionnaire Thorley. 2. Sorting out and reducing information collected to manageable proportions. 3. Summarizing the data in tabular form. 4. Analyzing facts . 5. Interpreting the results or converting data into statements ,propositions or conclusion which ultimately will answer the research questions.
  • 6.
    Editing: Editing ofdata is a process of examining the collected raw data to detect errors and omissions and to correct these when possible. • a careful scrutiny of the completed questionnaires and the schedule. • Editing is done to assure that the data are accurate, consistent with other facts gathered, uniformly entered, as completed as possible and have been well arranged to facilitate coding and tabulation.
  • 7.
    The editing couldbe classified as; 1. Field editing and 2. central editing.
  • 8.
    •Field Editing; Fieldediting consists in the review of the reporting forms by the investigator for completing (translating or rewriting) what the letter has written in abbreviated and or ill illegible form at the time of recording the respondent’s response.  it is done as soon as possible after the interview, preferably on the very day or on the next day.  field editing the investigator must restrain him and must not correct errors of omission by simply guessing what the informant would have said if the question had been asked.
  • 9.
    •Central Editing; Centralediting takes place when all forms or schedules have been completed and returned to the office.  This can be done by individual in case of small study, whereas in the larger studies a team of editors will do the editing.
  • 10.
    The editors wouldedit the inappropriate on missing replies; the editor can sometimes determine the proper answer by reviewing the other information in the schedule. Sometimes the respondents can be contacted for the clarifications.
  • 11.
    Important aspects inthe editing process are; 1. Completeness; 2. Accuracy; 3. Uniformity;
  • 12.
    Coding ; Codingprocess assigns numerals or other symbols to the several responses of the data set. In simple coding is translating answers into numerical values or assigning symbols/ numbers to the various categories of variables to be used in data analysis.
  • 13.
    Coding is necessaryfor efficient analysis and through it the several replies may be reduced to a small number of classes which contain the critical information required for analysis.
  • 14.
    A. Numerical coding; Coding need not necessarily be numeric, it can also be alphabetic. Coding has to be compulsorily numeric, when the variable is to be subject to further parametric analysis
  • 15.
    B. Alphabetic coding; A mere tabulation or frequency count or graphical representation of the variable may be given an alphabetic coding.
  • 16.
    C. Zero coding; A coding of zero has to be assigned carefully to a variable. In most of the cases when manual analysis is done, a code of “0” would imply a “no response” from the respondents. Hence, if a value of 0 is to be given to a specific response in the data sheet, it should not lead to the same interpretation of “no response”. For ex; there will be a tendency to give a code of 0 to a “no” answer. However, if the respondent had not chosen “yes’ or “no”, then a different coding than 0 should be given in the data sheet.
  • 17.
    Question number Variable/observati on Response categories code 1.1 Organization Private Pt Public Pb Government Go 3.4 Owner of vehicle yes 2 No 1 4.2 Vehicle performance Excellent 5 Good 4 Adequate 3 Bad 2 Worst 1 5.1 Age Up to 20 years 1 21-40 years 2 40-60 years 3 Above 60 years 4 5.2 Occupation Salaried S Professional P Technical T Business B Retired R House wife H
  • 18.
    • Classification; •The process of arranging data in groups or classes on the basis of common characteristics. • Data having common characteristics are placed in one class and in this way entire data get divided into number of groups or classes.
  • 19.
    •Classification according toattributes : The data are classified on the basis of common characteristics which can either be descriptive (such as literacy, sex, emotions, honesty) etc. A descriptive characteristic refers to qualitative phenomenon which cannot be measured quantitatively; only their presence or absence in an individual item can be noticed. Data obtained this way on the basis of certain attributes are known as statics of attributes and their classification is said to be classification according to attributes.
  • 20.
    •Classification according toclass-interval: The numerical characteristics refer to quantitative phenomenon which can be measured through some stastical units. Data retaining to income, production, age weight etc. Such data are called as stastics of variables and are classified on the basis of class intervals. For ex; persons whose income says are within Rs 202-Rs 400 can form one group, those whose incomes are within Rs 401- Rs 600 can another group.
  • 21.
    In the caseof open ended questions to classify responses the researcher looks for major characteristics of the responses and puts accordingly.
  • 22.
    In case ofattitude scales a researcher has to keep in mind the direction or weightage of responses. Forex; when responses “strongly agree” is coded as 5 the subsequent codes would be in order. Therefore, if there are responses like “agree” “undecided” , “ disagree” and “ strongly Disagree”, they have to be coded as 4,3,2, and 1.
  • 23.
    The matrix questionshave to be coded taking into consideration each cell as one variable. For ex; if the column of matrix represents employment status, namely “permanent” and “temporary” and the row represents employers or type of employer, namely, government and private, the first cell would represent a variable “government permanent” . The second cell would represent “government temporary” and so on.
  • 24.
    Tabulation: Tabulation isthe process of summarizing raw data and displaying the same in compact form (i.e. in the form of statistical tables) for further analysis. It involves counting the number of cases falling into each of the categories identified by the researcher. In a broader sense, tabulation is an orderly arrangement of data in columns and rows. This can be done manually or through computer.
  • 25.
    Importance of Tabulation; •It conserves space and reduce explanatory and descriptive statement to a minimum. •It facilitates the process of comparison •It facilitates the summation of items and the detection of errors and omissions. •It provides a basis for various statistical computations.
  • 26.
    computerized data processing; When the sample size is large and or when the variables studied is vast and inter related data can be transcribed to the computer for further easy processing.
  • 27.
    Computerized tabulation iseasy with the help of software packages. The input requirement will be the column and row variables (EXCEL spread sheet). The software package then computes the number of records in each of the row/column categories. The most popular package is the Statical Package for Social Sciences (SPSS, Systat ). It is an integrated set of programs suitable for analysis of social science data. This package contains programs for a wide range of operations and analysis such as handling missing data recording, variable information, simple descriptive analysis, cross tabulation, multivariate analysis and non-parametric analysis
  • 28.
    Example of MasterSheet / CHART The master sheets explain complete coding process of the collected data. Respon dents Sl no. No Variable labels Age desig natio n Level of educ atio n Marit al status Natur e of work Durati on of work Wag es Attitude of employer 1 A B D C D A A A 2 B A D C C A A E 3 C A D C E D E A 4 D E D C E A A C 5 E E A D B E C D
  • 29.
    Some important pointsthat can be kept in mind while preparing the coding for computerized data entry are; •Use a ‘natural ‘ coding scheme: •Avoid the blank space as a coding category. Do not use the – “ “, +, symbols .
  • 30.
    Presentation and Interpretationof Data. Construction of frequency table:
  • 31.
    Components of tables: The major components of a table are; •Heading •Table number •Title of the table •Designation of units •Body •Sub-head: heading of all rows or blocks of items •Body head: headings of all columns or main captions and their sub-captions. •Field/body: the cells in rows and columns. •Notations • Footnotes, wherever applicable •Source, wherever applicable
  • 32.
    Types of tables; •Uni-variate /One way tables Uni-variate analysis refers to tables, which give data relating to one variable. Uni-variate tables, which are more commonly known as frequency distribution tables, how frequently an item repeats. Further properties of distribution can be found out by various measures of central tendencies.
  • 33.
    Example The belowtable showing awareness of the respondents Level of awareness Distribution of respondents Frequencies % High 110 39.3 Medium 106 37.9 Low 64 21.8 Total 280 100.0
  • 34.
    •Bi-variate /Two waytable: Distribution in terms of two or more variables and the relationship between two variables are shown in two- way tables. Example: table showing levels of awareness towards the Act and wage Differentials of the Respondents. Awareness about the ACT Wage differentials High Medium l Low Total High 94(66.2) 99(10.5) 7(13.5) 110(39.3 ) Medium 37(26.1) 58 (67.4) 11(21.2) 106(37.9 ) Low 11(7.7) 86(30.7) 52(14.6) 280(100. 0) Total 142 86 52 280(100. 0)
  • 35.
    •Multi-variate Analysis: Ifthe researcher is interested in assessing the joint effect of three or more variables, he uses the techniques of multi-variate analysis. The most common stastical technique used for multi-variate analysis is regression analysis. In the first step of multi-variable analysis, the researcher has to obtain the correlation between the variables which are having stastically significant correlation. These variables are put in the regression analysis.
  • 36.
    Diagrammatic Representation: Adiagram helps to understand the data easily. All stastical packages, MS Excel and Open Office offer a wide range of graphs. In case of qualitative data most common graphs are bar charts and pie charts. The most commonly used graphic forms may be grouped into the following categories; Graphs Histogram & Bar charts Pie chart Pictogram Pyramid Diagram
  • 37.
    • Graph: Thegraph offers a visual presentation of the results. The line graph can also provide markers for each data point marker for each variable can be different to distinguish it from other variables. The marker also highlights the value at any specific point
  • 38.
    14 12 10 8 6 4 2 0 Category 1 Category 2 Category 3 Category 4 Series 3 Series 2 Series 1
  • 39.
    •Histograms Histograms andbar charts have two axes that intersect at right angles. One axis (horizontal one) is divided into intervals representing the various possible values of the variables. The other axis (vertical one) is divided into intervals representing frequencies. Histogram depicts the data graphically with vertical bars adjacent to each others. 6 5 4 3 2 1 0 2 4 6 8 10
  • 40.
    Bar chart: Barcharts are similar to histograms except that the bars are separated. Bar charts can be used for nominal level data to show different variables. Ex, diagram; 7 6 5 4 3 2 1 0 1 2 3 4 Series 3 Series 2 Series 1
  • 41.
    Pie charts: Piecharts are circular charts divided into slices. Each slice represents a possible score and its size is proportional to occurrence of those scores in the sample. The component parts from the segments of the circle. The circle chart is usually a percentage chart. The data are converted to percentage of the total and the proportional segments; therefore give a clear picture of the relationship among the components. 1.4 1.2 3.2 8.2 1st Qtr 2nd Qtr 3rd Qtr 4th Qtr
  • 42.
    • Pictogram: Eachpicture represents (man, animal, vehicles, crops,) a certain number and total number of pictures gives the total number of events/ elements. Pictograms are an exciting way to summaries data and are often used in newspapers. Examples for pictogram;
  • 44.
    •Pyramid diagram; Pyramidconsists of many levels and presents one or two variables.
  • 45.
    RESEARCH REPORT Thefinal and very important step in a research study is to write its report. The research report is a means for communication our research experiences to others and adding them to the fund of knowledge.
  • 46.
    Functions of researchreport; •It serve as a means for presenting the problem studied, methods and techniques used for collecting and analyzing data, the findings , conclusions and recommendations in an organized manner. •It serves as a basic reference material for future use in developing research proposal in the same or related area. •A report serves as a means for judging the quality of the completed research project. •It is a means for evaluating the researcher’s ability and competence to do research. •It provides factual base for formulating policies and strategies relating to the subject matter studied. •It provides systematic knowledge on problems and issues analyzed.
  • 47.
    Different steps inwriting report: •Logical analysis of the subject matter; •Preparation of the final out line •Preparation of the rough draft •Rewriting and polishing of the rough draft •Preparation of the final bibliography •Writing the final draft
  • 48.
    Planning report writing; •The target audience •The communication characteristic of audience. •The intended purposes of the report •The type of report •The scope of the report •The style of reporting •The format of report •Outline/time table of the report
  • 49.
    BIBILOGRAPHY; •Methodology ofresearch in social sciences – Dr.O.R. Krishnaswami, Himalayan publishing house, 1999. •Research for social workers ,An introduction to methods, 2nd edition Margaret Alston , Wendy Bowles •Research Methodology Methods and techniques (Second Revised Edition 2004) & third edition 2014. C. R. Kothari, New Age International Publishers. •Practice of social research – social work perspective D.K.Lal Das Rawat publication, 2004.
  • 50.

Editor's Notes

  • #6 Once the data is collected, then these six aspects to be followed very importantl
  • #51 THANK YOU