Downloaded 1,408 times
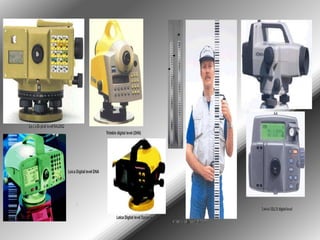
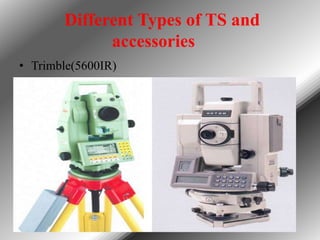
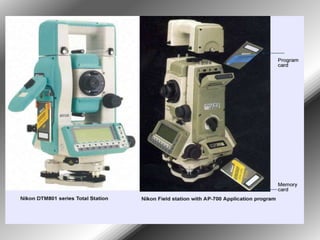
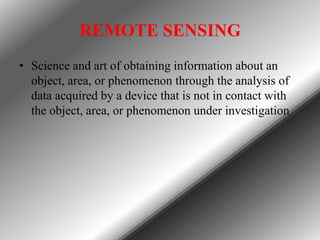
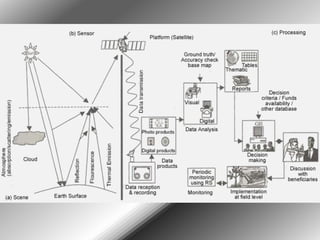
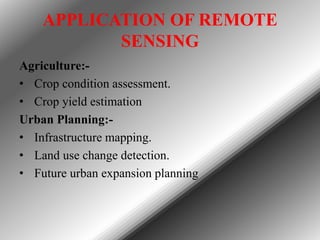
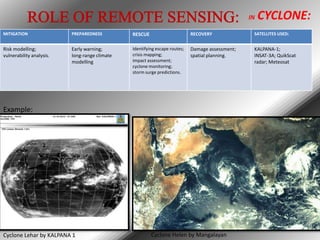
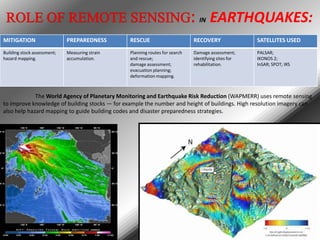
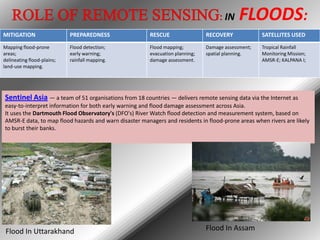
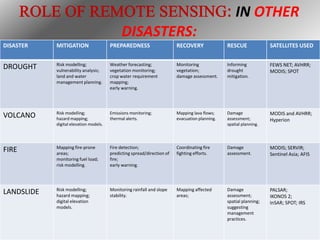

Modern surveying techniques utilizes advanced electronic equipment for measuring distances, angles, and elevations. This includes digital levels that use electronic image processing of barcoded staff readings, total stations that integrate distance and angle measurements, and electromagnetic distance measurement instruments. Remote sensing involves analyzing sensor data such as satellite imagery to obtain information about areas without direct contact. It has various applications including agriculture, urban planning, hydrology, and disaster management by aiding tasks such as early warning, damage assessment, and recovery efforts.


