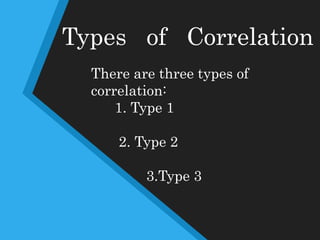
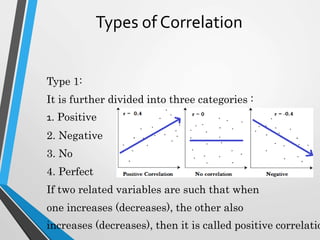
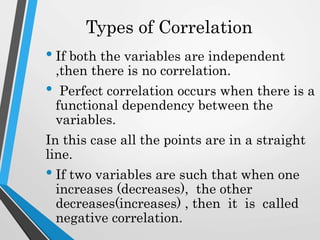
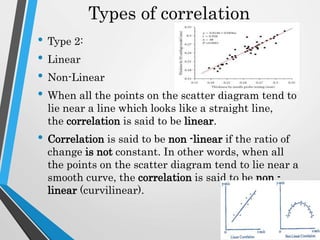
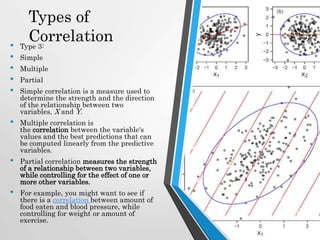
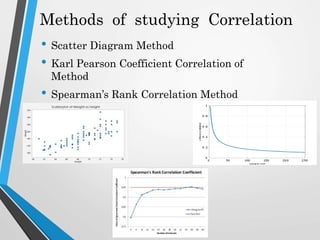
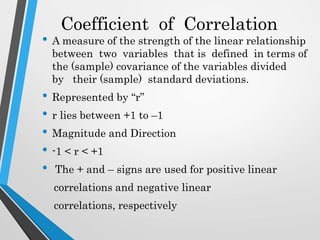
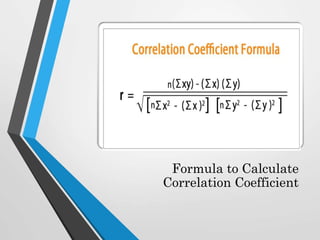
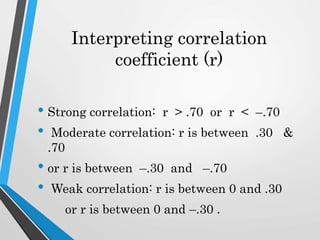
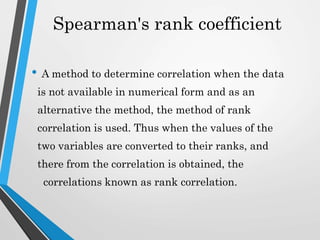
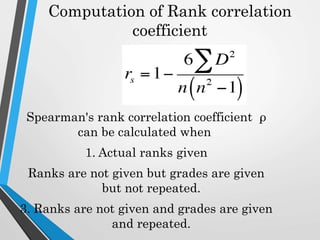
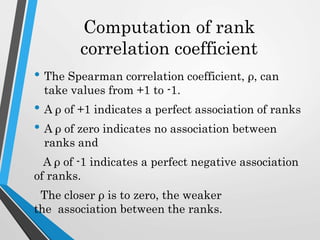
CORRELATION
ANALYSIS
SUDHAKAR.K.
18951A0399
MECHANICAL DEPARTMENT
IARE.
OVERVIEW:
Introduction
Types of Correlation
Methods of studying correlation
Coefficient of Correlation
Interpreting Correlation coefficient
Spearman’s Rank coefficient
Computation of Rank correlation
Introduction
• Definition:
• Correlation is the relationship which can reveal whether the
change in one variable would cause change in the
other or not.
• Such relationship between the two sets of charac-
ters or variables can be expressed quantitatively by the
degree of relationship, called Correlation Coefficient.
• Correlation is a LINEAR association between two random
variables.
• Correlation analysis show us how to determine both the nature and
strength of relationship between two variables.
• When variables are dependent on time correlation is applied.
Introduction • Correlation lies between +1 to -1.
• A zero correlation indicates that
there is no
• relationship between the
variables.
• A correlation of –1 indicates a
perfect negative correlation.
• A correlation of +1 indicates a
perfect positive
correlation.
Types of Correlation
There are three types of
correlation:
1. Type 1
2. Type 2
3.Type 3
Types of Correlation
Type 1:
It is further divided into three categories :
1. Positive
2. Negative
3. No
4. Perfect
If two related variables are such that when
one increases (decreases), the other also
increases (decreases), then it is called positive correlatio
Types of Correlation
• If both the variables are independent
,then there is no correlation.
• Perfect correlation occurs when there is a
functional dependency between the
variables.
In this case all the points are in a straight
line.
• If two variables are such that when one
increases (decreases), the other
decreases(increases) , then it is called
negative correlation.
Types of correlation
• Type 2:
• Linear
• Non-Linear
• When all the points on the scatter diagram tend to
lie near a line which looks like a straight line,
the correlation is said to be linear.
• Correlation is said to be non -linear if the ratio of
change is not constant. In other words, when all
the points on the scatter diagram tend to lie near a
smooth curve, the correlation is said to be non -
linear (curvilinear).
Types of
Correlation• Type 3:
• Simple
• Multiple
• Partial
• Simple correlation is a measure used to
determine the strength and the direction
of the relationship between two
variables, X and Y.
• Multiple correlation is
the correlation between the variable's
values and the best predictions that can
be computed linearly from the predictive
variables.
• Partial correlation measures the strength
of a relationship between two variables,
while controlling for the effect of one or
more other variables.
• For example, you might want to see if
there is a correlation between amount of
food eaten and blood pressure, while
controlling for weight or amount of
exercise.
Methods of studying Correlation
• Scatter Diagram Method
• Karl Pearson Coefficient Correlation of
Method
• Spearman’s Rank Correlation Method
Coefficient of Correlation
• A measure of the strength of the linear relationship
between two variables that is defined in terms of
the (sample) covariance of the variables divided
by their (sample) standard deviations.
• Represented by “r”
• r lies between +1 to –1
• Magnitude and Direction
• -1 < r < +1
• The + and – signs are used for positive linear
correlations and negative linear
correlations, respectively
Formula to Calculate
Correlation Coefficient
Interpreting correlation
coefficient (r)
• Strong correlation: r > .70 or r < –.70
• Moderate correlation: r is between .30 &
.70
• or r is between –.30 and –.70
• Weak correlation: r is between 0 and .30
or r is between 0 and –.30 .
Spearman's rank coefficient
• A method to determine correlation when the data
is not available in numerical form and as an
alternative the method, the method of rank
correlation is used. Thus when the values of the
two variables are converted to their ranks, and
there from the correlation is obtained, the
correlations known as rank correlation.
Computation of Rank correlation
coefficient
Spearman's rank correlation coefficient ρ
can be calculated when
1. Actual ranks given
Ranks are not given but grades are given
but not repeated.
3. Ranks are not given and grades are given
and repeated.
Computation of rank
correlation coefficient
• The Spearman correlation coefficient, ρ, can
take values from +1 to -1.
• A ρ of +1 indicates a perfect association of ranks
• A ρ of zero indicates no association between
ranks and
A ρ of -1 indicates a perfect negative association
of ranks.
The closer ρ is to zero, the weaker
the association between the ranks.
Thank You

Correlation (1)

  • 1.
  • 2.
    OVERVIEW: Introduction Types of Correlation Methodsof studying correlation Coefficient of Correlation Interpreting Correlation coefficient Spearman’s Rank coefficient Computation of Rank correlation
  • 3.
    Introduction • Definition: • Correlationis the relationship which can reveal whether the change in one variable would cause change in the other or not. • Such relationship between the two sets of charac- ters or variables can be expressed quantitatively by the degree of relationship, called Correlation Coefficient. • Correlation is a LINEAR association between two random variables. • Correlation analysis show us how to determine both the nature and strength of relationship between two variables. • When variables are dependent on time correlation is applied.
  • 4.
    Introduction • Correlationlies between +1 to -1. • A zero correlation indicates that there is no • relationship between the variables. • A correlation of –1 indicates a perfect negative correlation. • A correlation of +1 indicates a perfect positive correlation.
  • 5.
    Types of Correlation Thereare three types of correlation: 1. Type 1 2. Type 2 3.Type 3
  • 6.
    Types of Correlation Type1: It is further divided into three categories : 1. Positive 2. Negative 3. No 4. Perfect If two related variables are such that when one increases (decreases), the other also increases (decreases), then it is called positive correlatio
  • 7.
    Types of Correlation •If both the variables are independent ,then there is no correlation. • Perfect correlation occurs when there is a functional dependency between the variables. In this case all the points are in a straight line. • If two variables are such that when one increases (decreases), the other decreases(increases) , then it is called negative correlation.
  • 8.
    Types of correlation •Type 2: • Linear • Non-Linear • When all the points on the scatter diagram tend to lie near a line which looks like a straight line, the correlation is said to be linear. • Correlation is said to be non -linear if the ratio of change is not constant. In other words, when all the points on the scatter diagram tend to lie near a smooth curve, the correlation is said to be non - linear (curvilinear).
  • 9.
    Types of Correlation• Type3: • Simple • Multiple • Partial • Simple correlation is a measure used to determine the strength and the direction of the relationship between two variables, X and Y. • Multiple correlation is the correlation between the variable's values and the best predictions that can be computed linearly from the predictive variables. • Partial correlation measures the strength of a relationship between two variables, while controlling for the effect of one or more other variables. • For example, you might want to see if there is a correlation between amount of food eaten and blood pressure, while controlling for weight or amount of exercise.
  • 10.
    Methods of studyingCorrelation • Scatter Diagram Method • Karl Pearson Coefficient Correlation of Method • Spearman’s Rank Correlation Method
  • 11.
    Coefficient of Correlation •A measure of the strength of the linear relationship between two variables that is defined in terms of the (sample) covariance of the variables divided by their (sample) standard deviations. • Represented by “r” • r lies between +1 to –1 • Magnitude and Direction • -1 < r < +1 • The + and – signs are used for positive linear correlations and negative linear correlations, respectively
  • 12.
  • 13.
    Interpreting correlation coefficient (r) •Strong correlation: r > .70 or r < –.70 • Moderate correlation: r is between .30 & .70 • or r is between –.30 and –.70 • Weak correlation: r is between 0 and .30 or r is between 0 and –.30 .
  • 14.
    Spearman's rank coefficient •A method to determine correlation when the data is not available in numerical form and as an alternative the method, the method of rank correlation is used. Thus when the values of the two variables are converted to their ranks, and there from the correlation is obtained, the correlations known as rank correlation.
  • 15.
    Computation of Rankcorrelation coefficient Spearman's rank correlation coefficient ρ can be calculated when 1. Actual ranks given Ranks are not given but grades are given but not repeated. 3. Ranks are not given and grades are given and repeated.
  • 16.
    Computation of rank correlationcoefficient • The Spearman correlation coefficient, ρ, can take values from +1 to -1. • A ρ of +1 indicates a perfect association of ranks • A ρ of zero indicates no association between ranks and A ρ of -1 indicates a perfect negative association of ranks. The closer ρ is to zero, the weaker the association between the ranks.
  • 17.