Download to read offline
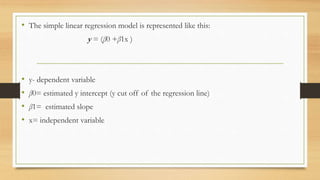

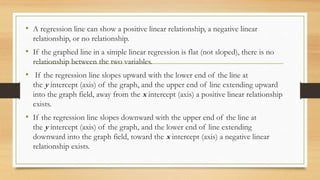

Simple linear regression models the relationship between a dependent variable (y) and independent variable (x) using an equation y = (β0 +β1x). It shows whether the relationship is positive, negative, or no relationship based on the slope and position of the regression line graphed between the variables. Simple linear regression is used to forecast future opportunities and risks by predicting values like price, quantity, demand, and supply.