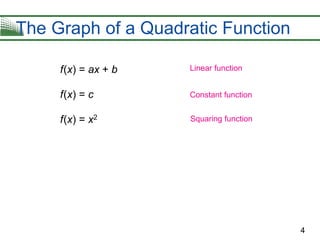
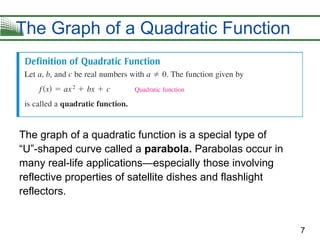
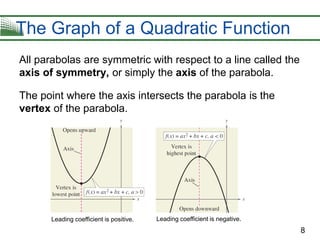
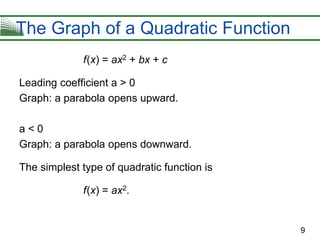
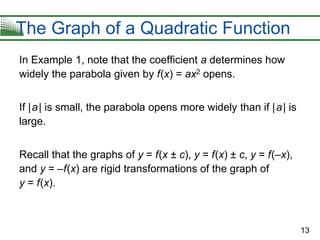
- The document discusses quadratic functions and their graphs. It explains that the graph of a quadratic function is a parabola, which is a U-shaped curve.
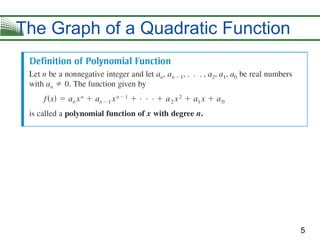
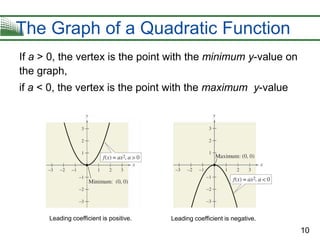
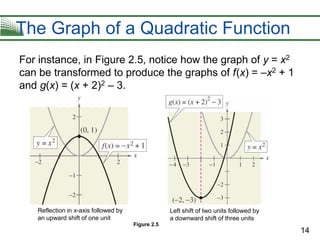
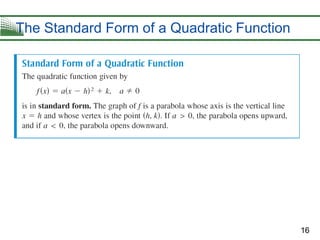
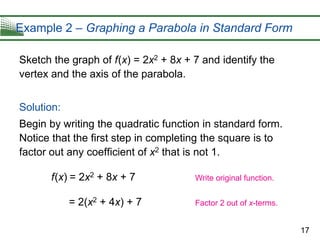
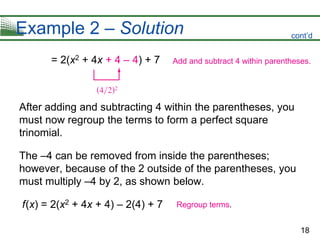
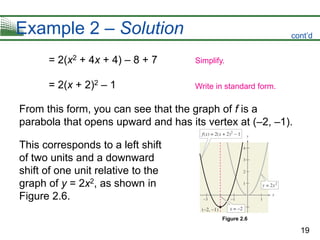
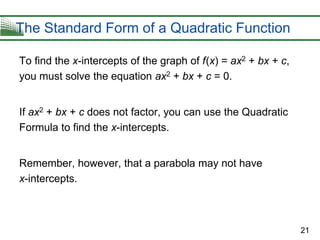
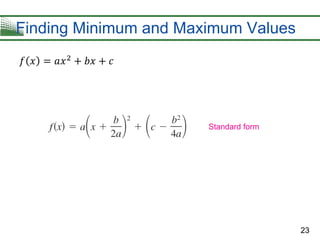
- It describes how to write quadratic functions in standard form and use that form to sketch the graph and find features like the vertex and axis of symmetry.
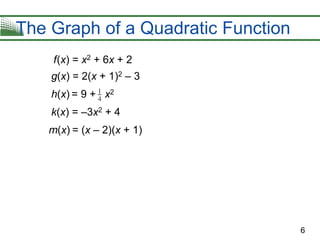
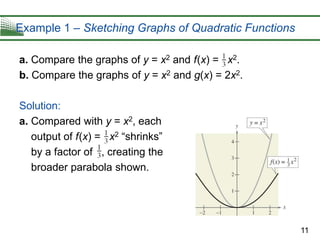
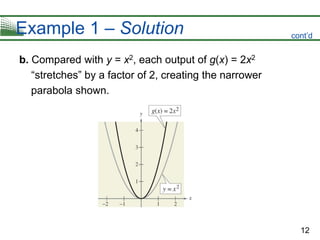
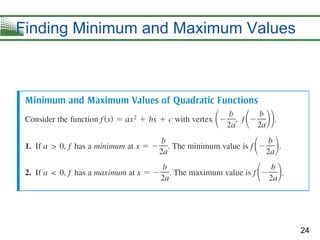
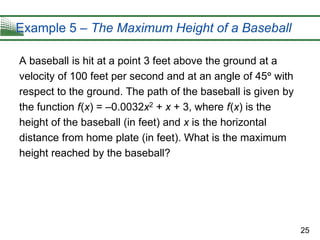
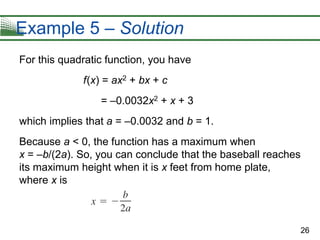
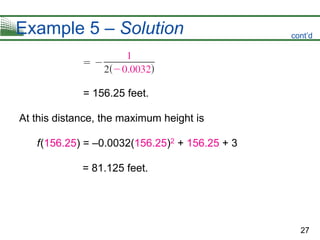
- Examples are provided to demonstrate how to graph quadratic functions in standard form and how to find the minimum or maximum value of a quadratic function by setting its derivative equal to zero.