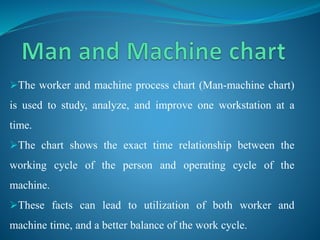
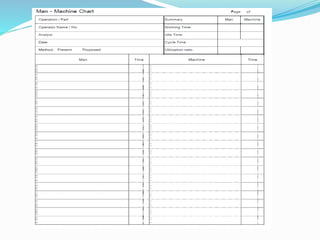
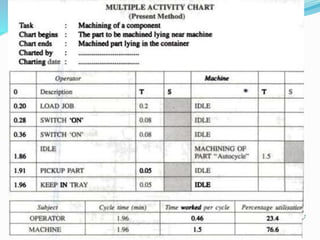
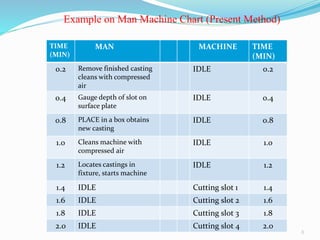
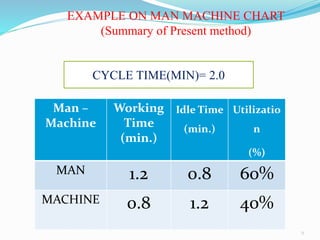
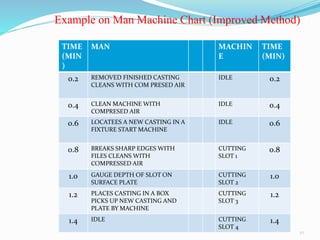
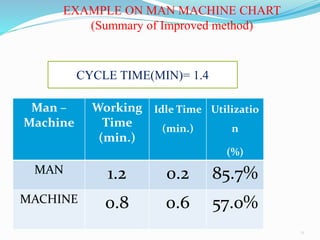
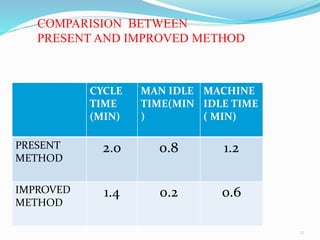
2. The worker and machine process chart (Man-machine chart)
is used to study, analyze, and improve one workstation at a
time.
The chart shows the exact time relationship between the
working cycle of the person and operating cycle of the
machine.
These facts can lead to utilization of both worker and
machine time, and a better balance of the work cycle.
3. To detect the idle time on machine and workers
To optimize work distribution between workers and
machines.
To decide no. of workers in a group.
To balance the work team
To examine the activities.
It is used for recording the complex movements of
material or men.
To organize teams of workers on mass production
work.
4. Plant repair & maintenance.
Job construction.
Planning team work.
It is used to check whether the
work station is correctly located.
10. TIME
(MIN
)
MAN MACHIN
E
TIME
(MIN)
0.2 REMOVED FINISHED CASTING
CLEANS WITH COM PRESED AIR
IDLE 0.2
0.4 CLEAN MACHINE WITH
COMPRESED AIR
IDLE 0.4
0.6 LOCATEES A NEW CASTING IN A
FIXTURE START MACHINE
IDLE 0.6
0.8 BREAKS SHARP EDGES WITH
FILES CLEANS WITH
COMPRESSED AIR
CUTTING
SLOT 1
0.8
1.0 GAUGE DEPTH OF SLOT ON
SURFACE PLATE
CUTTING
SLOT 2
1.0
1.2 PLACES CASTING IN A BOX
PICKS UP NEW CASTING AND
PLATE BY MACHINE
CUTTING
SLOT 3
1.2
1.4 IDLE CUTTING
SLOT 4
1.4
10
Example on Man Machine Chart (Improved Method)
11. EXAMPLE ON MAN MACHINE CHART
(Summary of Improved method)
CYCLE TIME(MIN)= 1.4
Man –
Machine
Working
Time
(min.)
Idle Time
(min.)
Utilizatio
n
(%)
MAN 1.2 0.2 85.7%
MACHINE 0.8 0.6 57.0%
11
12. COMPARISION BETWEEN
PRESENT AND IMPROVED METHOD
CYCLE
TIME
(MIN)
MAN IDLE
TIME(MIN
)
MACHINE
IDLE TIME
( MIN)
PRESENT
METHOD
2.0 0.8 1.2
IMPROVED
METHOD
1.4 0.2 0.6
12