This document provides an overview of key concepts in statistics, including:
- Statistics is the science of collecting, organizing, analyzing, and interpreting quantitative data.
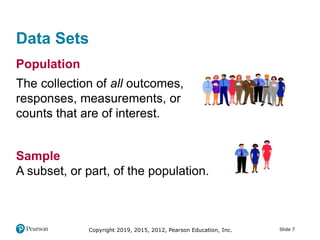
- A population is the total set of data, while a sample is a subset of the population.
- Descriptive statistics summarize and organize sample data, while inferential statistics make generalizations from samples to populations.
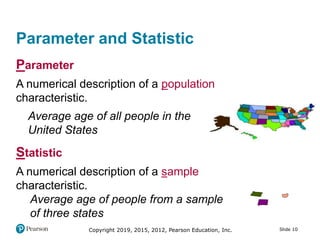
- Parameters describe populations and statistics describe samples.


![Copyright 2019, 2015, 2012, Pearson Education, Inc. Slide 16
Solution: Descriptive and Inferential
Statistics (1 of 2)
Solution:
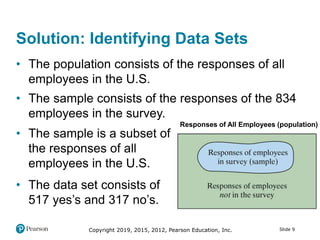
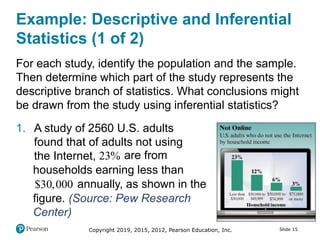
1. The population consists of the responses of all U.S.
adults, and the sample consists of the responses of
the 2560 U.S. adults in the study. The descriptive
branch of statistics involves the statement “23 [of
U.S. adults not using the Internet]
are from households earning less
than$30 000 annually.” A possible
inference drawn from the study is
that lower-income households
cannot afford access to the Internet.](https://image.slidesharecdn.com/les7epptada0101-180829232908/85/Les7e-ppt-ada_0101-16-320.jpg)
![Copyright 2019, 2015, 2012, Pearson Education, Inc. Slide 18
Solution: Descriptive and Inferential
Statistics (2 of 2)
Solution:
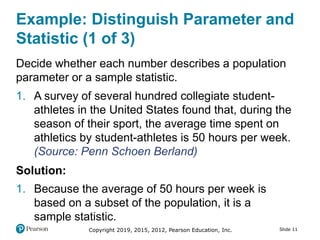
2. The population consists of the high-tech earnings
forecasts of all Wall Street analysts, and the sample
consists of the forecasts of the 300 Wall Street
analysts in the study. The part of this study that
represents the descriptive branch of statistics
involves the statement “the percentage [of Wall
Street analysts] who incorrectly forecasted high-tech
earnings in a recent year was 44.” A possible
inference drawn from the study is that the stock
market is difficult to forecast, even for professionals.](https://image.slidesharecdn.com/les7epptada0101-180829232908/85/Les7e-ppt-ada_0101-18-320.jpg)