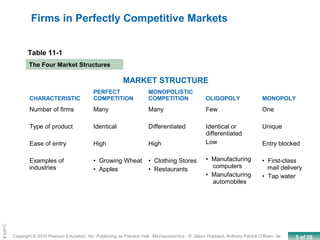
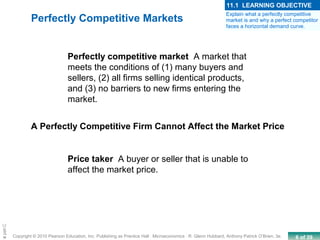
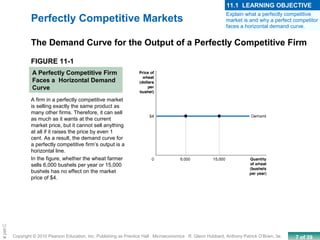
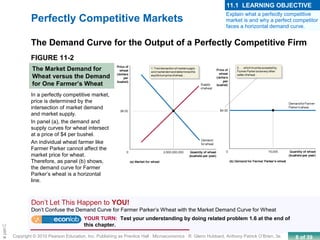
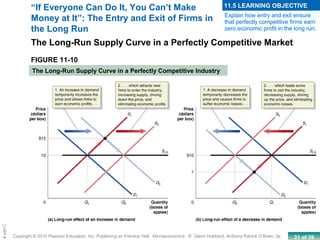
SlideShare a Scribd company logo
1 of 39Copyright © 2010 Pearson Education, Inc. Publishing as Prentice Hall · Microeconomics · R. Glenn Hubbard, Anthony Patrick O’Brien, 3e.
Chapte
2 of 39Copyright © 2010 Pearson Education, Inc. Publishing as Prentice Hall · Microeconomics · R. Glenn Hubbard, Anthony Patrick O’Brien, 3e.
Chapte
3 of 39Copyright © 2010 Pearson Education, Inc. Publishing as Prentice Hall · Microeconomics · R. Glenn Hubbard, Anthony Patrick O’Brien, 3e.
Chapte
CHAPTER
11
Firms in Perfectly
Competitive Markets
Fernando Quijano
Prepared by:
The market for
organically grown
food has expanded
rapidly in the
United States.
4 of 39Copyright © 2010 Pearson Education, Inc. Publishing as Prentice Hall · Microeconomics · R. Glenn Hubbard, Anthony Patrick O’Brien, 3e.
Chapte
11.1 Perfectly Competitive Market
Explain what a perfectly competitive market is and
why a perfect competitor faces a horizontal demand
curve.
11.2 How a Firm Maximizes Profit in a Perfectly
Competitive Market.
Explain how a firm maximizes profit in a perfectly
competitive market.
11.3 Illustrating Profit or Loss on the Cost Curve Graph
Use graphs to show a firm’s profit or loss.
11.4 Deciding Whether to Produce or to Shut Down in
the Short Run
Explain why firms may shut down temporarily.
11.5 “If Everyone Can Do It, You Can’t Make Money at
It”: The Entry and Exit of Firms in the Long Run
Explain how entry and exit ensure that perfectly
competitive firms earn zero economic profit in the long
run.
11.6 Perfect Competition and Efficiency
Explain how perfect competition leads to economic
efficiency.
CHAPTER
11
Chapter Outline and
Learning Objectives
Firms in Perfectly
Competitive Markets
5 of 39Copyright © 2010 Pearson Education, Inc. Publishing as Prentice Hall · Microeconomics · R. Glenn Hubbard, Anthony Patrick O’Brien, 3e.
Chapte
Firms in Perfectly Competitive Markets
MARKET STRUCTURE
CHARACTERISTIC
PERFECT
COMPETITION
MONOPOLISTIC
COMPETITION OLIGOPOLY MONOPOLY
Number of firms
Type of product
Ease of entry
Examples of
industries
Many
Identical
High
• Growing Wheat
• Apples
Many
Differentiated
High
• Clothing Stores
• Restaurants
Few
Identical or
differentiated
Low
• Manufacturing
computers
• Manufacturing
automobiles
One
Unique
Entry blocked
• First-class
mail delivery
• Tap water
Table 11-1
The Four Market Structures
6 of 39Copyright © 2010 Pearson Education, Inc. Publishing as Prentice Hall · Microeconomics · R. Glenn Hubbard, Anthony Patrick O’Brien, 3e.
Chapte
Perfectly competitive market A market that
meets the conditions of (1) many buyers and
sellers, (2) all firms selling identical products,
and (3) no barriers to new firms entering the
market.
Price taker A buyer or seller that is unable to
affect the market price.
A Perfectly Competitive Firm Cannot Affect the Market Price
Perfectly Competitive Markets
Explain what a perfectly competitive
market is and why a perfect competitor
faces a horizontal demand curve.
11.1 LEARNING OBJECTIVE
7 of 39Copyright © 2010 Pearson Education, Inc. Publishing as Prentice Hall · Microeconomics · R. Glenn Hubbard, Anthony Patrick O’Brien, 3e.
Chapte
FIGURE 11-1
A Perfectly Competitive Firm
Faces a Horizontal Demand
Curve
Perfectly Competitive Markets
The Demand Curve for the Output of a Perfectly Competitive Firm
A firm in a perfectly competitive market
is selling exactly the same product as
many other firms. Therefore, it can sell
as much as it wants at the current
market price, but it cannot sell anything
at all if it raises the price by even 1
cent. As a result, the demand curve for
a perfectly competitive firm’s output is a
horizontal line.
In the figure, whether the wheat farmer
sells 6,000 bushels per year or 15,000
bushels has no effect on the market
price of $4.
Explain what a perfectly competitive
market is and why a perfect competitor
faces a horizontal demand curve.
11.1 LEARNING OBJECTIVE
8 of 39Copyright © 2010 Pearson Education, Inc. Publishing as Prentice Hall · Microeconomics · R. Glenn Hubbard, Anthony Patrick O’Brien, 3e.
Chapte
FIGURE 11-2
The Market Demand for
Wheat versus the Demand
for One Farmer’s Wheat
Perfectly Competitive Markets
The Demand Curve for the Output of a Perfectly Competitive Firm
In a perfectly competitive market,
price is determined by the
intersection of market demand
and market supply.
In panel (a), the demand and
supply curves for wheat intersect
at a price of $4 per bushel.
An individual wheat farmer like
Farmer Parker cannot affect the
market price for wheat.
Therefore, as panel (b) shows,
the demand curve for Farmer
Parker’s wheat is a horizontal
line.
Don’t Let This Happen to YOU!
Don’t Confuse the Demand Curve for Farmer Parker’s Wheat with the Market Demand Curve for Wheat
YOUR TURN: Test your understanding by doing related problem 1.6 at the end of
this chapter.
Explain what a perfectly competitive
market is and why a perfect competitor
faces a horizontal demand curve.
11.1 LEARNING OBJECTIVE
9 of 39Copyright © 2010 Pearson Education, Inc. Publishing as Prentice Hall · Microeconomics · R. Glenn Hubbard, Anthony Patrick O’Brien, 3e.
Chapte
How a Firm Maximizes Profit
in a Perfectly Competitive Market
Profit Total revenue minus total cost.
Profit = TR – TC
Revenue for a Firm in a Perfectly Competitive Market
Average revenue (AR) Total revenue
divided by the quantity of the product sold.
Marginal revenue (MR) The change in
total revenue from selling one more unit of
a product.
or,
quantityinChange
revenuein totalChange
RevenueMarginal
Q
TR
MR
∆
∆
==
Explain how a firm maximizes profit
in a perfectly competitive market.
11.2 LEARNING OBJECTIVE
10 of 39Copyright © 2010 Pearson Education, Inc. Publishing as Prentice Hall · Microeconomics · R. Glenn Hubbard, Anthony Patrick O’Brien, 3e.
Chapte
How a Firm Maximizes Profit
in a Perfectly Competitive Market
NUMBER OF
BUSHELS
(Q)
MARKET PRICE
(PER BUSHEL)
(P)
TOTAL
REVENUE
(TR)
AVERAGE
REVENUE
(AR)
MARGINAL
REVENUE
(MR)
0
1
2
3
4
5
6
7
8
9
10
$4
4
4
4
4
4
4
4
4
4
4
$0
4
8
12
16
20
24
28
32
36
40
-
$4
4
4
4
4
4
4
4
4
4
-
$4
4
4
4
4
4
4
4
4
4
Table 11-2
Farmer Parker’s Revenue from Wheat Farming
Revenue for a Firm in a Perfectly Competitive Market
Explain how a firm maximizes profit
in a perfectly competitive market.
11.2 LEARNING OBJECTIVE
11 of 39Copyright © 2010 Pearson Education, Inc. Publishing as Prentice Hall · Microeconomics · R. Glenn Hubbard, Anthony Patrick O’Brien, 3e.
Chapte
How a Firm Maximizes Profit
in a Perfectly Competitive Market
QUANTITY
(BUSHELS)
(Q)
TOTAL
REVENUE
(TR)
TOTAL
COST
(TC)
PROFIT
(TR-TC)
MARGINAL
REVENUE
(MR)
MARGINAL
COST
(MC)
0
1
2
3
4
5
6
7
8
9
10
$0.00
4.00
8.00
12.00
16.00
20.00
24.00
28.00
32.00
36.00
40.00
$2.00
5.00
7.00
8.50
10.50
13.00
16.50
21.50
28.50
38.00
50.50
-$2.00
-1.00
1.00
3.50
5.50
7.00
7.50
6.50
3.50
-2.00
-10.50
—
$4.00
4.00
4.00
4.00
4.00
4.00
4.00
4.00
4.00
4.00
—
$3.00
2.00
1.50
2.00
2.50
3.50
5.00
7.00
9.50
12.50
Determining the Profit-Maximizing Level of Output
Table 11-3
Farmer Parker’s Profits from Wheat Farming
Explain how a firm maximizes profit
in a perfectly competitive market.
11.2 LEARNING OBJECTIVE
12 of 39Copyright © 2010 Pearson Education, Inc. Publishing as Prentice Hall · Microeconomics · R. Glenn Hubbard, Anthony Patrick O’Brien, 3e.
Chapte
How a Firm Maximizes Profit
in a Perfectly Competitive Market
Determining the Profit-Maximizing Level of Output
FIGURE 11-3
The Profit-Maximizing Level of Output
In panel (a), Farmer Parker maximizes his
profit where the vertical distance between
total revenue and total cost is the largest.
Panel (b) shows that Farmer Parker’s marginal revenue
(MR) is equal to a constant $4 per bushel.
Farmer Parker maximizes profits by producing wheat up to
the point where the marginal revenue of the last bushel
produced is equal to its marginal cost, or MR = MC.
Explain how a firm maximizes profit
in a perfectly competitive market.
11.2 LEARNING OBJECTIVE
13 of 39Copyright © 2010 Pearson Education, Inc. Publishing as Prentice Hall · Microeconomics · R. Glenn Hubbard, Anthony Patrick O’Brien, 3e.
Chapte
How a Firm Maximizes Profit
in a Perfectly Competitive Market
Determining the Profit-Maximizing Level of Output
1. The profit-maximizing level of output is where
the difference between total revenue and total
cost is the greatest.
2. The profit-maximizing level of output is also
where marginal revenue equals marginal cost,
or MR = MC.
From the information in Table 11-3 and Figure 11-3, we
can draw the following conclusions:
Explain how a firm maximizes profit
in a perfectly competitive market.
11.2 LEARNING OBJECTIVE
14 of 39Copyright © 2010 Pearson Education, Inc. Publishing as Prentice Hall · Microeconomics · R. Glenn Hubbard, Anthony Patrick O’Brien, 3e.
Chapte
Illustrating Profit or Loss on
the Cost Curve Graph
Profit = (P x Q) − TC
−
×
Q
QP )(
=
Q
Profit
Q
TC
P ATC
Q
= −
Profit
Profit = (P − ATC) x Q
or
Use graphs to show a firm’s profit
or loss.
11.3 LEARNING OBJECTIVE
15 of 39Copyright © 2010 Pearson Education, Inc. Publishing as Prentice Hall · Microeconomics · R. Glenn Hubbard, Anthony Patrick O’Brien, 3e.
Chapte
Showing a Profit on the Graph
FIGURE 11-4
The Area of Maximum
Profit
Illustrating Profit or Loss on
the Cost Curve Graph
A firm maximizes profit at the
level of output at which
marginal revenue equals
marginal cost.
The difference between price
and average total cost equals
profit per unit of output.
Total profit equals profit per
unit multiplied by the number
of units produced. Total profit
is represented by the area of
the green-shaded rectangle,
which has a height equal to
(P - ATC) and a width equal
to Q.
Use graphs to show a firm’s profit
or loss.
11.3 LEARNING OBJECTIVE
16 of 39Copyright © 2010 Pearson Education, Inc. Publishing as Prentice Hall · Microeconomics · R. Glenn Hubbard, Anthony Patrick O’Brien, 3e.
Chapte
Solved Problem 11-3
Determining Profit-Maximizing
Price and Quantity
OUTPUT
PER DAY
TOTAL
COST
0 $10.00
1 20.50
2 24.50
3 28.50
4 34.00
5 43.00
6 55.50
7 72.00
8 93.00
9 119.00
YOUR TURN: For more practice, do related problems 3.3 and 3.4 at the end of this chapter.
Use graphs to show a firm’s profit
or loss.
11.3 LEARNING OBJECTIVE
17 of 39Copyright © 2010 Pearson Education, Inc. Publishing as Prentice Hall · Microeconomics · R. Glenn Hubbard, Anthony Patrick O’Brien, 3e.
Chapte
Illustrating Profit or Loss
on the Cost Curve Graph
Don’t Let This Happen to YOU!
Remember That Firms Maximize Their Total Profits, Not Their Profits per Unit
YOUR TURN: Test your understanding by doing related problem 3.5 at the end of this
chapter.
Use graphs to show a firm’s profit
or loss.
11.3 LEARNING OBJECTIVE
18 of 39Copyright © 2010 Pearson Education, Inc. Publishing as Prentice Hall · Microeconomics · R. Glenn Hubbard, Anthony Patrick O’Brien, 3e.
Chapte
1. P > ATC, which means the firm makes a profit.
2. P = ATC, which means the firm breaks even (its
total cost equals its total revenue).
3. P < ATC, which means the firm experiences
losses.
Illustrating When a Firm Is Breaking Even or Operating at a Loss
Illustrating Profit or Loss
on the Cost Curve Graph
Use graphs to show a firm’s profit
or loss.
11.3 LEARNING OBJECTIVE
19 of 39Copyright © 2010 Pearson Education, Inc. Publishing as Prentice Hall · Microeconomics · R. Glenn Hubbard, Anthony Patrick O’Brien, 3e.
Chapte
FIGURE 11-5
A Firm Breaking Even and a Firm Experiencing Losses
Illustrating When a Firm Is Breaking Even or Operating at a Loss
Illustrating Profit or Loss
on the Cost Curve Graph
In panel (b), price is below average total cost, and the firm
experiences a loss. The loss is represented by the area of
the red-shaded rectangle, which has a height equal to
(ATC - P) and a width equal to Q.
In panel (a), price equals average total cost, and
the firm breaks even because its total revenue will
be equal to its total cost. In this situation, the firm
makes zero economic profit.
Use graphs to show a firm’s profit
or loss.
11.3 LEARNING OBJECTIVE
20 of 39Copyright © 2010 Pearson Education, Inc. Publishing as Prentice Hall · Microeconomics · R. Glenn Hubbard, Anthony Patrick O’Brien, 3e.
Chapte
Losing Money in the
Medical Screening Industry
Making
the
Connection
YOUR TURN: Test your understanding by doing related problem 3.8 at the end of
this chapter.
Use graphs to show a firm’s profit
or loss.
11.3 LEARNING OBJECTIVE
21 of 39Copyright © 2010 Pearson Education, Inc. Publishing as Prentice Hall · Microeconomics · R. Glenn Hubbard, Anthony Patrick O’Brien, 3e.
Chapte
Deciding Whether to Produce
or to Shut Down in the Short Run
1. Continue to produce
2. Stop production by shutting
down temporarily
Sunk cost A cost that has already been
paid and that cannot be recovered.
In the short run, a firm experiencing losses
has two choices:
Explain why firms may shut down
temporarily.
11.4 LEARNING OBJECTIVE
22 of 39Copyright © 2010 Pearson Education, Inc. Publishing as Prentice Hall · Microeconomics · R. Glenn Hubbard, Anthony Patrick O’Brien, 3e.
Chapte
When to Close a Laundry
Making
the
Connection
Keeping a business open
even when suffering
losses can sometimes be
the best decision for an
entrepreneur in the short
run.
YOUR TURN: Test your understanding by doing related problems 4.5 and 4.6 at
the end of this chapter.
Explain why firms may shut down
temporarily.
11.4 LEARNING OBJECTIVE
23 of 39Copyright © 2010 Pearson Education, Inc. Publishing as Prentice Hall · Microeconomics · R. Glenn Hubbard, Anthony Patrick O’Brien, 3e.
Chapte
Deciding Whether to Produce
or to Shut Down in the Short Run
Shutdown point The minimum point on a firm’s
average variable cost curve; if the price falls below
this point, the firm shuts down production in the short
run.
The Supply Curve of a Firm in the Short Run
Total revenue < Variable cost,
(P × Q) < VC
P < AVC
or, in symbols:
If we divide both sides by Q, we have the result that
the firm will shut down if:
Explain why firms may shut down
temporarily.
11.4 LEARNING OBJECTIVE
24 of 39Copyright © 2010 Pearson Education, Inc. Publishing as Prentice Hall · Microeconomics · R. Glenn Hubbard, Anthony Patrick O’Brien, 3e.
Chapte
FIGURE 11-6
The Firm’s Short-Run
Supply Curve
Deciding Whether to Produce
or to Shut Down in the Short Run
The Supply Curve of a Firm in the Short Run
For any given price, we can
determine the quantity of output
the firm will supply from the
marginal cost curve. In other
words, the marginal cost curve is
the firm’s supply curve.
The firm will shut down if the price
falls below average variable cost.
The marginal cost curve crosses
the average variable cost at the
firm’s shutdown point. This point
occurs at output level QSD.
For prices below PMIN, the supply
curve is a vertical line along the
price axis, which shows that the
firm will supply zero output at
those prices. The red line in the
figure is the firm’s short-run supply
curve.
Explain why firms may shut down
temporarily.
11.4 LEARNING OBJECTIVE
25 of 39Copyright © 2010 Pearson Education, Inc. Publishing as Prentice Hall · Microeconomics · R. Glenn Hubbard, Anthony Patrick O’Brien, 3e.
Chapte
FIGURE 11-7
Firm Supply and Market Supply
Deciding Whether to Produce
or to Shut Down in the Short Run
The Market Supply Curve in a Perfectly Competitive Industry
We can derive the market supply curve by adding up the quantity that each firm in the market is
willing to supply at each price. In panel (a), one wheat farmer is willing to supply 15,000
bushels of wheat at a price of $4 per bushel.
If every wheat farmer supplies the same amount of wheat at this price and if there are 167,000
wheat farmers, the total amount of wheat supplied at a price of $4 will equal 15,000 bushels
per farmer × 167,000 farmers = 2.5 billion bushels of wheat.
Explain why firms may shut down
temporarily.
11.4 LEARNING OBJECTIVE
26 of 39Copyright © 2010 Pearson Education, Inc. Publishing as Prentice Hall · Microeconomics · R. Glenn Hubbard, Anthony Patrick O’Brien, 3e.
Chapte
“If Everyone Can Do It, You Can’t Make
Money at It”: The Entry and Exit of Firms in
the Long Run
EXPLICIT COSTS
Water
Wages
Organic fertilizer
Electricity
Payment on bank loan
$10,000
$15,000
$10,000
$5,000
$45,000
IMPLICIT COSTS
Foregone salary
Opportunity cost of the $100,000 she has invested in her farm
$30,000
$10,000
Total cost $125,000
Economic Profit and the Entry or Exit Decision
Table 11- 4
Farmer Moreno’s Costs per Year
Economic profit A firm’s revenues
minus all its costs, implicit and explicit.
Explain how entry and exit ensure
that perfectly competitive firms earn
zero economic profit in the long run.
11.5 LEARNING OBJECTIVE
27 of 39Copyright © 2010 Pearson Education, Inc. Publishing as Prentice Hall · Microeconomics · R. Glenn Hubbard, Anthony Patrick O’Brien, 3e.
Chapte
Economic Profit Leads to Entry of New Firms
FIGURE 11-8
The Effect of Entry on Economic Profits
Economic Profit and the Entry or Exit Decision
“If Everyone Can Do It, You Can’t Make
Money at It”: The Entry and Exit of Firms in
the Long Run
Explain how entry and exit ensure
that perfectly competitive firms earn
zero economic profit in the long run.
11.5 LEARNING OBJECTIVE
28 of 39Copyright © 2010 Pearson Education, Inc. Publishing as Prentice Hall · Microeconomics · R. Glenn Hubbard, Anthony Patrick O’Brien, 3e.
Chapte
FIGURE 11-9
The Effect of Exit on Economic Losses
Economic Losses Lead to Exit of Firms
Economic Profit and the Entry or Exit Decision
“If Everyone Can Do It, You Can’t Make
Money at It”: The Entry and Exit of Firms in
the Long Run
29 of 39Copyright © 2010 Pearson Education, Inc. Publishing as Prentice Hall · Microeconomics · R. Glenn Hubbard, Anthony Patrick O’Brien, 3e.
Chapte
The Effect of Exit on Economic Losses
FIGURE 11-9
The Effect of Exit on Economic Losses (continued)
Economic Losses Lead to Exit of Firms
Economic Profit and the Entry or Exit Decision
“If Everyone Can Do It, You Can’t Make
Money at It”: The Entry and Exit of Firms in
the Long Run
Explain how entry and exit ensure
that perfectly competitive firms earn
zero economic profit in the long run.
11.5 LEARNING OBJECTIVE
30 of 39Copyright © 2010 Pearson Education, Inc. Publishing as Prentice Hall · Microeconomics · R. Glenn Hubbard, Anthony Patrick O’Brien, 3e.
Chapte
Economic loss The situation in which
a firm’s total revenue is less than its
total cost, including all implicit costs.
Long-Run Equilibrium in a Perfectly Competitive Market
Long-run competitive equilibrium
The situation in which the entry and exit
of firms has resulted in the typical firm
breaking even.
Economic Losses Lead to Exit of Firms
Economic Profit and the Entry or Exit Decision
“If Everyone Can Do It, You Can’t Make
Money at It”: The Entry and Exit of Firms in
the Long Run
Explain how entry and exit ensure
that perfectly competitive firms earn
zero economic profit in the long run.
11.5 LEARNING OBJECTIVE
31 of 39Copyright © 2010 Pearson Education, Inc. Publishing as Prentice Hall · Microeconomics · R. Glenn Hubbard, Anthony Patrick O’Brien, 3e.
Chapte
FIGURE 11-10
The Long-Run Supply Curve in a Perfectly Competitive Industry
The Long-Run Supply Curve in a Perfectly Competitive Market
“If Everyone Can Do It, You Can’t Make
Money at It”: The Entry and Exit of Firms in
the Long Run
Explain how entry and exit ensure
that perfectly competitive firms earn
zero economic profit in the long run.
11.5 LEARNING OBJECTIVE
32 of 39Copyright © 2010 Pearson Education, Inc. Publishing as Prentice Hall · Microeconomics · R. Glenn Hubbard, Anthony Patrick O’Brien, 3e.
Chapte
Long-run supply curve A curve that
shows the relationship in the long run
between market price and the quantity
supplied.
Increasing-Cost and Decreasing-Cost Industries
Industries with upward-sloping long-
run supply curves are called
increasing-cost industries.
Industries with downward-sloping long-
run supply curves are called
decreasing-cost industries.
The Long-Run Supply Curve in a Perfectly Competitive Market
“If Everyone Can Do It, You Can’t Make
Money at It”: The Entry and Exit of Firms in
the Long Run
Explain how entry and exit ensure
that perfectly competitive firms earn
zero economic profit in the long run.
11.5 LEARNING OBJECTIVE
33 of 39Copyright © 2010 Pearson Education, Inc. Publishing as Prentice Hall · Microeconomics · R. Glenn Hubbard, Anthony Patrick O’Brien, 3e.
Chapte
Easy Entry Makes the Long Run
Pretty Short in the Apple iPhone
Apps Store
Making
the
Connection
Economic profits are rapidly competed away in
the iPhone apps store.
YOUR TURN: Test your understanding by doing related problem 6.7 at the end of this
chapter.
In a competitive market,
earning an economic
profit in the long run is
extremely difficult. And
the ease of entering the
market for iPhone apps
has made the long run
pretty short.
Explain how entry and exit ensure
that perfectly competitive firms earn
zero economic profit in the long run.
11.5 LEARNING OBJECTIVE
34 of 39Copyright © 2010 Pearson Education, Inc. Publishing as Prentice Hall · Microeconomics · R. Glenn Hubbard, Anthony Patrick O’Brien, 3e.
Chapte
Perfect Competition and Efficiency
Productive efficiency The
situation in which a good or service
is produced at the lowest possible
cost.
Productive Efficiency
Explain how perfect competition
leads to economic efficiency.
11.6 LEARNING OBJECTIVE
35 of 39Copyright © 2010 Pearson Education, Inc. Publishing as Prentice Hall · Microeconomics · R. Glenn Hubbard, Anthony Patrick O’Brien, 3e.
Chapte
How Productive Efficiency Benefits Consumers
Solved Problem 11-6
YOUR TURN: For more practice, do related problems 6.4, 6.5, and 6.6 at the end of this
chapter.
In the long run, firms only break even on their investment in producing high-technology goods.
That result implies that investors in these firms are also unlikely to earn an economic profit in the long
run.
Explain how perfect competition
leads to economic efficiency.
11.6 LEARNING OBJECTIVE
36 of 39Copyright © 2010 Pearson Education, Inc. Publishing as Prentice Hall · Microeconomics · R. Glenn Hubbard, Anthony Patrick O’Brien, 3e.
Chapte
Perfect Competition and Efficiency
1. The price of a good represents the marginal
benefit consumers receive from consuming the last
unit of the good sold.
2. Perfectly competitive firms produce up to the point
where the price of the good equals the marginal
cost of producing the last unit.
3. Therefore, firms produce up to the point where the
last unit provides a marginal benefit to consumers
equal to the marginal cost of producing it.
Allocative Efficiency
Firms will supply all those goods that provide consumers with
a marginal benefit at least as great as the marginal cost of
producing them.
Explain how perfect competition
leads to economic efficiency.
11.6 LEARNING OBJECTIVE
37 of 39Copyright © 2010 Pearson Education, Inc. Publishing as Prentice Hall · Microeconomics · R. Glenn Hubbard, Anthony Patrick O’Brien, 3e.
Chapte
Perfect Competition and Efficiency
Allocative efficiency A state of the
economy in which production represents
consumer preferences; in particular,
every good or service is produced up to
the point where the last unit provides a
marginal benefit to consumers equal to
the marginal cost of producing it.
Allocative Efficiency
Explain how perfect competition
leads to economic efficiency.
11.6 LEARNING OBJECTIVE
38 of 39Copyright © 2010 Pearson Education, Inc. Publishing as Prentice Hall · Microeconomics · R. Glenn Hubbard, Anthony Patrick O’Brien, 3e.
Chapte
AN INSIDE LOOK
Figure 1
The demand for a product increases after it is
“green certified.” The graph assumes that the
firm did not spend money to acquire
certification for its product.
It Isn’t Easy—or Cheap—to Be Green>>
Figure 2
The demand for a product increases after it is
“green certified.” The marginal cost and
average total cost curves shift up due to the
cost of certification.
39 of 39Copyright © 2010 Pearson Education, Inc. Publishing as Prentice Hall · Microeconomics · R. Glenn Hubbard, Anthony Patrick O’Brien, 3e.
Chapte
Allocative efficiency
Average revenue (AR)
Economic loss
Economic profit
Long-run competitive equilibrium
Long-run supply curve
Marginal revenue (MR)
Perfectly competitive market
Price taker
Productive efficiency
Profit
Shutdown point
Sunk cost
KEY TERMS

More Related Content

Similar to Ge273.u8.pp1

Ge273.u10.pp1
Ge273.u10.pp1Ge273.u10.pp1
Ge273.u10.pp1
Subas Nandy
 
Ppt econ 9e_one_click_ch15
Ppt econ 9e_one_click_ch15Ppt econ 9e_one_click_ch15
Ppt econ 9e_one_click_ch15
Muhammad Attique Shah
 
Ppt econ 9e_one_click_ch06
Ppt econ 9e_one_click_ch06Ppt econ 9e_one_click_ch06
Ppt econ 9e_one_click_ch06
Muhammad Attique Shah
 
Ppt econ 9e_one_click_ch12
Ppt econ 9e_one_click_ch12Ppt econ 9e_one_click_ch12
Ppt econ 9e_one_click_ch12
Muhammad Attique Shah
 
HOch12_instructor monopolistic competition.ppt
HOch12_instructor monopolistic competition.pptHOch12_instructor monopolistic competition.ppt
HOch12_instructor monopolistic competition.ppt
RichaGoel44
 
Micro ch4 ppt
Micro ch4 pptMicro ch4 ppt
Micro ch4 ppt
Aron Dotson
 
Econ 204 week 10 outline
Econ 204 week 10 outlineEcon 204 week 10 outline
Econ 204 week 10 outline
BHUOnlineDepartment
 
Ekonomi mikro ch08-2.ppt
Ekonomi mikro ch08-2.pptEkonomi mikro ch08-2.ppt
Ekonomi mikro ch08-2.ppt
BagasMikolaAnelka1
 
Agri 2312 chapter 9 market equilibrium and product price imperfect competition
Agri 2312 chapter 9  market equilibrium and product price imperfect competitionAgri 2312 chapter 9  market equilibrium and product price imperfect competition
Agri 2312 chapter 9 market equilibrium and product price imperfect competition
Rita Conley
 
Agri 2312 chapter 9 market equilibrium and product price imperfect competition
Agri 2312 chapter 9  market equilibrium and product price imperfect competitionAgri 2312 chapter 9  market equilibrium and product price imperfect competition
Agri 2312 chapter 9 market equilibrium and product price imperfect competition
Rita Conley
 
hubbard01_instructorppt02.ppt comparativ
hubbard01_instructorppt02.ppt comparativhubbard01_instructorppt02.ppt comparativ
hubbard01_instructorppt02.ppt comparativ
RichaGoel44
 
Monopolistic Competition and Oligopoly
Monopolistic Competition and OligopolyMonopolistic Competition and Oligopoly
Monopolistic Competition and Oligopoly
Hannah Rain
 
Monopoly
Monopoly Monopoly
Monopoly
Vibhor Agarwal
 
Micro ch9 ppt
Micro ch9 pptMicro ch9 ppt
Micro ch9 ppt
Aron Dotson
 
Monopoly market
Monopoly marketMonopoly market
Monopoly market
Dr. Shweta Uppadhyay
 
[MT445 Managerial Economics] .docx
[MT445  Managerial Economics]                                .docx[MT445  Managerial Economics]                                .docx
[MT445 Managerial Economics] .docx
danielfoster65629
 
Perfect Competition
Perfect CompetitionPerfect Competition
Perfect Competition
Hannah Rain
 
Ge273.u3.pp2
Ge273.u3.pp2Ge273.u3.pp2
Ge273.u3.pp2
Subas Nandy
 

Similar to Ge273.u8.pp1 (20)

Ge273.u10.pp1
Ge273.u10.pp1Ge273.u10.pp1
Ge273.u10.pp1
 
Ppt econ 9e_one_click_ch15
Ppt econ 9e_one_click_ch15Ppt econ 9e_one_click_ch15
Ppt econ 9e_one_click_ch15
 
Ppt econ 9e_one_click_ch06
Ppt econ 9e_one_click_ch06Ppt econ 9e_one_click_ch06
Ppt econ 9e_one_click_ch06
 
Ppt econ 9e_one_click_ch12
Ppt econ 9e_one_click_ch12Ppt econ 9e_one_click_ch12
Ppt econ 9e_one_click_ch12
 
HOch12_instructor monopolistic competition.ppt
HOch12_instructor monopolistic competition.pptHOch12_instructor monopolistic competition.ppt
HOch12_instructor monopolistic competition.ppt
 
Micro ch4 ppt
Micro ch4 pptMicro ch4 ppt
Micro ch4 ppt
 
Econ 204 week 10 outline
Econ 204 week 10 outlineEcon 204 week 10 outline
Econ 204 week 10 outline
 
Ekonomi mikro ch08-2.ppt
Ekonomi mikro ch08-2.pptEkonomi mikro ch08-2.ppt
Ekonomi mikro ch08-2.ppt
 
Agri 2312 chapter 9 market equilibrium and product price imperfect competition
Agri 2312 chapter 9  market equilibrium and product price imperfect competitionAgri 2312 chapter 9  market equilibrium and product price imperfect competition
Agri 2312 chapter 9 market equilibrium and product price imperfect competition
 
Agri 2312 chapter 9 market equilibrium and product price imperfect competition
Agri 2312 chapter 9  market equilibrium and product price imperfect competitionAgri 2312 chapter 9  market equilibrium and product price imperfect competition
Agri 2312 chapter 9 market equilibrium and product price imperfect competition
 
hubbard01_instructorppt02.ppt comparativ
hubbard01_instructorppt02.ppt comparativhubbard01_instructorppt02.ppt comparativ
hubbard01_instructorppt02.ppt comparativ
 
Monopolistic Competition and Oligopoly
Monopolistic Competition and OligopolyMonopolistic Competition and Oligopoly
Monopolistic Competition and Oligopoly
 
Monopoly
Monopoly Monopoly
Monopoly
 
Micro ch9 ppt
Micro ch9 pptMicro ch9 ppt
Micro ch9 ppt
 
Monopoly market
Monopoly marketMonopoly market
Monopoly market
 
[MT445 Managerial Economics] .docx
[MT445  Managerial Economics]                                .docx[MT445  Managerial Economics]                                .docx
[MT445 Managerial Economics] .docx
 
Perfect Competition
Perfect CompetitionPerfect Competition
Perfect Competition
 
Chap07
Chap07Chap07
Chap07
 
Monopoly
MonopolyMonopoly
Monopoly
 
Ge273.u3.pp2
Ge273.u3.pp2Ge273.u3.pp2
Ge273.u3.pp2
 

More from Subas Nandy

Les7e ppt ada_0103
Les7e ppt ada_0103Les7e ppt ada_0103
Les7e ppt ada_0103
Subas Nandy
 
Les7e ppt ada_0102
Les7e ppt ada_0102Les7e ppt ada_0102
Les7e ppt ada_0102
Subas Nandy
 
Les7e ppt ada_0101
Les7e ppt ada_0101Les7e ppt ada_0101
Les7e ppt ada_0101
Subas Nandy
 
Week1 newtons laws_of_motion
Week1 newtons laws_of_motionWeek1 newtons laws_of_motion
Week1 newtons laws_of_motion
Subas Nandy
 
Les5e ppt 05
Les5e ppt 05Les5e ppt 05
Les5e ppt 05
Subas Nandy
 
052516 week11 quantum computers
052516 week11 quantum computers052516 week11 quantum computers
052516 week11 quantum computers
Subas Nandy
 
052516 week11 quantum3
052516 week11 quantum3052516 week11 quantum3
052516 week11 quantum3
Subas Nandy
 
052516 week11 quantum2
052516 week11 quantum2052516 week11 quantum2
052516 week11 quantum2
Subas Nandy
 
052516 week11 quantum1
052516 week11 quantum1052516 week11 quantum1
052516 week11 quantum1
Subas Nandy
 
0511 week10 resonance
0511 week10 resonance0511 week10 resonance
0511 week10 resonance
Subas Nandy
 
0511 week10 second_reflection
0511 week10 second_reflection0511 week10 second_reflection
0511 week10 second_reflection
Subas Nandy
 
0511 week10 reflection and refraction
0511 week10  reflection and refraction0511 week10  reflection and refraction
0511 week10 reflection and refraction
Subas Nandy
 
Sound&amp;resonance
Sound&amp;resonanceSound&amp;resonance
Sound&amp;resonance
Subas Nandy
 
051116 week9 waves
051116 week9 waves051116 week9 waves
051116 week9 waves
Subas Nandy
 
050316 week8 c12-electromagnetic_waves
050316 week8 c12-electromagnetic_waves050316 week8 c12-electromagnetic_waves
050316 week8 c12-electromagnetic_waves
Subas Nandy
 
050316 week 8_electromagnetism (1)
050316 week 8_electromagnetism (1)050316 week 8_electromagnetism (1)
050316 week 8_electromagnetism (1)
Subas Nandy
 
0503 week8 electromagnetism
0503 week8 electromagnetism0503 week8 electromagnetism
0503 week8 electromagnetism
Subas Nandy
 
Ge273.u7 ho4e micro_ch11_1click
Ge273.u7 ho4e micro_ch11_1clickGe273.u7 ho4e micro_ch11_1click
Ge273.u7 ho4e micro_ch11_1click
Subas Nandy
 
042416 week7 powerpoint elec_mag (1)
042416 week7 powerpoint elec_mag (1)042416 week7 powerpoint elec_mag (1)
042416 week7 powerpoint elec_mag (1)
Subas Nandy
 
042416 week7 elec_magnet
042416 week7 elec_magnet042416 week7 elec_magnet
042416 week7 elec_magnet
Subas Nandy
 

More from Subas Nandy (20)

Les7e ppt ada_0103
Les7e ppt ada_0103Les7e ppt ada_0103
Les7e ppt ada_0103
 
Les7e ppt ada_0102
Les7e ppt ada_0102Les7e ppt ada_0102
Les7e ppt ada_0102
 
Les7e ppt ada_0101
Les7e ppt ada_0101Les7e ppt ada_0101
Les7e ppt ada_0101
 
Week1 newtons laws_of_motion
Week1 newtons laws_of_motionWeek1 newtons laws_of_motion
Week1 newtons laws_of_motion
 
Les5e ppt 05
Les5e ppt 05Les5e ppt 05
Les5e ppt 05
 
052516 week11 quantum computers
052516 week11 quantum computers052516 week11 quantum computers
052516 week11 quantum computers
 
052516 week11 quantum3
052516 week11 quantum3052516 week11 quantum3
052516 week11 quantum3
 
052516 week11 quantum2
052516 week11 quantum2052516 week11 quantum2
052516 week11 quantum2
 
052516 week11 quantum1
052516 week11 quantum1052516 week11 quantum1
052516 week11 quantum1
 
0511 week10 resonance
0511 week10 resonance0511 week10 resonance
0511 week10 resonance
 
0511 week10 second_reflection
0511 week10 second_reflection0511 week10 second_reflection
0511 week10 second_reflection
 
0511 week10 reflection and refraction
0511 week10  reflection and refraction0511 week10  reflection and refraction
0511 week10 reflection and refraction
 
Sound&amp;resonance
Sound&amp;resonanceSound&amp;resonance
Sound&amp;resonance
 
051116 week9 waves
051116 week9 waves051116 week9 waves
051116 week9 waves
 
050316 week8 c12-electromagnetic_waves
050316 week8 c12-electromagnetic_waves050316 week8 c12-electromagnetic_waves
050316 week8 c12-electromagnetic_waves
 
050316 week 8_electromagnetism (1)
050316 week 8_electromagnetism (1)050316 week 8_electromagnetism (1)
050316 week 8_electromagnetism (1)
 
0503 week8 electromagnetism
0503 week8 electromagnetism0503 week8 electromagnetism
0503 week8 electromagnetism
 
Ge273.u7 ho4e micro_ch11_1click
Ge273.u7 ho4e micro_ch11_1clickGe273.u7 ho4e micro_ch11_1click
Ge273.u7 ho4e micro_ch11_1click
 
042416 week7 powerpoint elec_mag (1)
042416 week7 powerpoint elec_mag (1)042416 week7 powerpoint elec_mag (1)
042416 week7 powerpoint elec_mag (1)
 
042416 week7 elec_magnet
042416 week7 elec_magnet042416 week7 elec_magnet
042416 week7 elec_magnet
 

Recently uploaded

Landownership in the Philippines under the Americans-2-pptx.pptx
Landownership in the Philippines under the Americans-2-pptx.pptxLandownership in the Philippines under the Americans-2-pptx.pptx
Landownership in the Philippines under the Americans-2-pptx.pptx
JezreelCabil2
 
Pride Month Slides 2024 David Douglas School District
Pride Month Slides 2024 David Douglas School DistrictPride Month Slides 2024 David Douglas School District
Pride Month Slides 2024 David Douglas School District
David Douglas School District
 
Digital Artifact 1 - 10VCD Environments Unit
Digital Artifact 1 - 10VCD Environments UnitDigital Artifact 1 - 10VCD Environments Unit
Digital Artifact 1 - 10VCD Environments Unit
chanes7
 
ANATOMY AND BIOMECHANICS OF HIP JOINT.pdf
ANATOMY AND BIOMECHANICS OF HIP JOINT.pdfANATOMY AND BIOMECHANICS OF HIP JOINT.pdf
ANATOMY AND BIOMECHANICS OF HIP JOINT.pdf
Priyankaranawat4
 
S1-Introduction-Biopesticides in ICM.pptx
S1-Introduction-Biopesticides in ICM.pptxS1-Introduction-Biopesticides in ICM.pptx
S1-Introduction-Biopesticides in ICM.pptx
tarandeep35
 
RPMS TEMPLATE FOR SCHOOL YEAR 2023-2024 FOR TEACHER 1 TO TEACHER 3
RPMS TEMPLATE FOR SCHOOL YEAR 2023-2024 FOR TEACHER 1 TO TEACHER 3RPMS TEMPLATE FOR SCHOOL YEAR 2023-2024 FOR TEACHER 1 TO TEACHER 3
RPMS TEMPLATE FOR SCHOOL YEAR 2023-2024 FOR TEACHER 1 TO TEACHER 3
IreneSebastianRueco1
 
Thesis Statement for students diagnonsed withADHD.ppt
Thesis Statement for students diagnonsed withADHD.pptThesis Statement for students diagnonsed withADHD.ppt
Thesis Statement for students diagnonsed withADHD.ppt
EverAndrsGuerraGuerr
 
Executive Directors Chat Leveraging AI for Diversity, Equity, and Inclusion
Executive Directors Chat  Leveraging AI for Diversity, Equity, and InclusionExecutive Directors Chat  Leveraging AI for Diversity, Equity, and Inclusion
Executive Directors Chat Leveraging AI for Diversity, Equity, and Inclusion
TechSoup
 
Natural birth techniques - Mrs.Akanksha Trivedi Rama University
Natural birth techniques - Mrs.Akanksha Trivedi Rama UniversityNatural birth techniques - Mrs.Akanksha Trivedi Rama University
Natural birth techniques - Mrs.Akanksha Trivedi Rama University
Akanksha trivedi rama nursing college kanpur.
 
MASS MEDIA STUDIES-835-CLASS XI Resource Material.pdf
MASS MEDIA STUDIES-835-CLASS XI Resource Material.pdfMASS MEDIA STUDIES-835-CLASS XI Resource Material.pdf
MASS MEDIA STUDIES-835-CLASS XI Resource Material.pdf
goswamiyash170123
 
Best Digital Marketing Institute In NOIDA
Best Digital Marketing Institute In NOIDABest Digital Marketing Institute In NOIDA
Best Digital Marketing Institute In NOIDA
deeptiverma2406
 
PIMS Job Advertisement 2024.pdf Islamabad
PIMS Job Advertisement 2024.pdf IslamabadPIMS Job Advertisement 2024.pdf Islamabad
PIMS Job Advertisement 2024.pdf Islamabad
AyyanKhan40
 
Top five deadliest dog breeds in America
Top five deadliest dog breeds in AmericaTop five deadliest dog breeds in America
Top five deadliest dog breeds in America
Bisnar Chase Personal Injury Attorneys
 
Digital Artifact 2 - Investigating Pavilion Designs
Digital Artifact 2 - Investigating Pavilion DesignsDigital Artifact 2 - Investigating Pavilion Designs
Digital Artifact 2 - Investigating Pavilion Designs
chanes7
 
World environment day ppt For 5 June 2024
World environment day ppt For 5 June 2024World environment day ppt For 5 June 2024
World environment day ppt For 5 June 2024
ak6969907
 
Normal Labour/ Stages of Labour/ Mechanism of Labour
Normal Labour/ Stages of Labour/ Mechanism of LabourNormal Labour/ Stages of Labour/ Mechanism of Labour
Normal Labour/ Stages of Labour/ Mechanism of Labour
Wasim Ak
 
South African Journal of Science: Writing with integrity workshop (2024)
South African Journal of Science: Writing with integrity workshop (2024)South African Journal of Science: Writing with integrity workshop (2024)
South African Journal of Science: Writing with integrity workshop (2024)
Academy of Science of South Africa
 
Acetabularia Information For Class 9 .docx
Acetabularia Information For Class 9  .docxAcetabularia Information For Class 9  .docx
Acetabularia Information For Class 9 .docx
vaibhavrinwa19
 
How to Add Chatter in the odoo 17 ERP Module
How to Add Chatter in the odoo 17 ERP ModuleHow to Add Chatter in the odoo 17 ERP Module
How to Add Chatter in the odoo 17 ERP Module
Celine George
 
CACJapan - GROUP Presentation 1- Wk 4.pdf
CACJapan - GROUP Presentation 1- Wk 4.pdfCACJapan - GROUP Presentation 1- Wk 4.pdf
CACJapan - GROUP Presentation 1- Wk 4.pdf
camakaiclarkmusic
 

Recently uploaded (20)

Landownership in the Philippines under the Americans-2-pptx.pptx
Landownership in the Philippines under the Americans-2-pptx.pptxLandownership in the Philippines under the Americans-2-pptx.pptx
Landownership in the Philippines under the Americans-2-pptx.pptx
 
Pride Month Slides 2024 David Douglas School District
Pride Month Slides 2024 David Douglas School DistrictPride Month Slides 2024 David Douglas School District
Pride Month Slides 2024 David Douglas School District
 
Digital Artifact 1 - 10VCD Environments Unit
Digital Artifact 1 - 10VCD Environments UnitDigital Artifact 1 - 10VCD Environments Unit
Digital Artifact 1 - 10VCD Environments Unit
 
ANATOMY AND BIOMECHANICS OF HIP JOINT.pdf
ANATOMY AND BIOMECHANICS OF HIP JOINT.pdfANATOMY AND BIOMECHANICS OF HIP JOINT.pdf
ANATOMY AND BIOMECHANICS OF HIP JOINT.pdf
 
S1-Introduction-Biopesticides in ICM.pptx
S1-Introduction-Biopesticides in ICM.pptxS1-Introduction-Biopesticides in ICM.pptx
S1-Introduction-Biopesticides in ICM.pptx
 
RPMS TEMPLATE FOR SCHOOL YEAR 2023-2024 FOR TEACHER 1 TO TEACHER 3
RPMS TEMPLATE FOR SCHOOL YEAR 2023-2024 FOR TEACHER 1 TO TEACHER 3RPMS TEMPLATE FOR SCHOOL YEAR 2023-2024 FOR TEACHER 1 TO TEACHER 3
RPMS TEMPLATE FOR SCHOOL YEAR 2023-2024 FOR TEACHER 1 TO TEACHER 3
 
Thesis Statement for students diagnonsed withADHD.ppt
Thesis Statement for students diagnonsed withADHD.pptThesis Statement for students diagnonsed withADHD.ppt
Thesis Statement for students diagnonsed withADHD.ppt
 
Executive Directors Chat Leveraging AI for Diversity, Equity, and Inclusion
Executive Directors Chat  Leveraging AI for Diversity, Equity, and InclusionExecutive Directors Chat  Leveraging AI for Diversity, Equity, and Inclusion
Executive Directors Chat Leveraging AI for Diversity, Equity, and Inclusion
 
Natural birth techniques - Mrs.Akanksha Trivedi Rama University
Natural birth techniques - Mrs.Akanksha Trivedi Rama UniversityNatural birth techniques - Mrs.Akanksha Trivedi Rama University
Natural birth techniques - Mrs.Akanksha Trivedi Rama University
 
MASS MEDIA STUDIES-835-CLASS XI Resource Material.pdf
MASS MEDIA STUDIES-835-CLASS XI Resource Material.pdfMASS MEDIA STUDIES-835-CLASS XI Resource Material.pdf
MASS MEDIA STUDIES-835-CLASS XI Resource Material.pdf
 
Best Digital Marketing Institute In NOIDA
Best Digital Marketing Institute In NOIDABest Digital Marketing Institute In NOIDA
Best Digital Marketing Institute In NOIDA
 
PIMS Job Advertisement 2024.pdf Islamabad
PIMS Job Advertisement 2024.pdf IslamabadPIMS Job Advertisement 2024.pdf Islamabad
PIMS Job Advertisement 2024.pdf Islamabad
 
Top five deadliest dog breeds in America
Top five deadliest dog breeds in AmericaTop five deadliest dog breeds in America
Top five deadliest dog breeds in America
 
Digital Artifact 2 - Investigating Pavilion Designs
Digital Artifact 2 - Investigating Pavilion DesignsDigital Artifact 2 - Investigating Pavilion Designs
Digital Artifact 2 - Investigating Pavilion Designs
 
World environment day ppt For 5 June 2024
World environment day ppt For 5 June 2024World environment day ppt For 5 June 2024
World environment day ppt For 5 June 2024
 
Normal Labour/ Stages of Labour/ Mechanism of Labour
Normal Labour/ Stages of Labour/ Mechanism of LabourNormal Labour/ Stages of Labour/ Mechanism of Labour
Normal Labour/ Stages of Labour/ Mechanism of Labour
 
South African Journal of Science: Writing with integrity workshop (2024)
South African Journal of Science: Writing with integrity workshop (2024)South African Journal of Science: Writing with integrity workshop (2024)
South African Journal of Science: Writing with integrity workshop (2024)
 
Acetabularia Information For Class 9 .docx
Acetabularia Information For Class 9  .docxAcetabularia Information For Class 9  .docx
Acetabularia Information For Class 9 .docx
 
How to Add Chatter in the odoo 17 ERP Module
How to Add Chatter in the odoo 17 ERP ModuleHow to Add Chatter in the odoo 17 ERP Module
How to Add Chatter in the odoo 17 ERP Module
 
CACJapan - GROUP Presentation 1- Wk 4.pdf
CACJapan - GROUP Presentation 1- Wk 4.pdfCACJapan - GROUP Presentation 1- Wk 4.pdf
CACJapan - GROUP Presentation 1- Wk 4.pdf
 

Ge273.u8.pp1

  • 1. 1 of 39Copyright © 2010 Pearson Education, Inc. Publishing as Prentice Hall · Microeconomics · R. Glenn Hubbard, Anthony Patrick O’Brien, 3e. Chapte
  • 2. 2 of 39Copyright © 2010 Pearson Education, Inc. Publishing as Prentice Hall · Microeconomics · R. Glenn Hubbard, Anthony Patrick O’Brien, 3e. Chapte
  • 3. 3 of 39Copyright © 2010 Pearson Education, Inc. Publishing as Prentice Hall · Microeconomics · R. Glenn Hubbard, Anthony Patrick O’Brien, 3e. Chapte CHAPTER 11 Firms in Perfectly Competitive Markets Fernando Quijano Prepared by: The market for organically grown food has expanded rapidly in the United States.
  • 4. 4 of 39Copyright © 2010 Pearson Education, Inc. Publishing as Prentice Hall · Microeconomics · R. Glenn Hubbard, Anthony Patrick O’Brien, 3e. Chapte 11.1 Perfectly Competitive Market Explain what a perfectly competitive market is and why a perfect competitor faces a horizontal demand curve. 11.2 How a Firm Maximizes Profit in a Perfectly Competitive Market. Explain how a firm maximizes profit in a perfectly competitive market. 11.3 Illustrating Profit or Loss on the Cost Curve Graph Use graphs to show a firm’s profit or loss. 11.4 Deciding Whether to Produce or to Shut Down in the Short Run Explain why firms may shut down temporarily. 11.5 “If Everyone Can Do It, You Can’t Make Money at It”: The Entry and Exit of Firms in the Long Run Explain how entry and exit ensure that perfectly competitive firms earn zero economic profit in the long run. 11.6 Perfect Competition and Efficiency Explain how perfect competition leads to economic efficiency. CHAPTER 11 Chapter Outline and Learning Objectives Firms in Perfectly Competitive Markets
  • 5. 5 of 39Copyright © 2010 Pearson Education, Inc. Publishing as Prentice Hall · Microeconomics · R. Glenn Hubbard, Anthony Patrick O’Brien, 3e. Chapte Firms in Perfectly Competitive Markets MARKET STRUCTURE CHARACTERISTIC PERFECT COMPETITION MONOPOLISTIC COMPETITION OLIGOPOLY MONOPOLY Number of firms Type of product Ease of entry Examples of industries Many Identical High • Growing Wheat • Apples Many Differentiated High • Clothing Stores • Restaurants Few Identical or differentiated Low • Manufacturing computers • Manufacturing automobiles One Unique Entry blocked • First-class mail delivery • Tap water Table 11-1 The Four Market Structures
  • 6. 6 of 39Copyright © 2010 Pearson Education, Inc. Publishing as Prentice Hall · Microeconomics · R. Glenn Hubbard, Anthony Patrick O’Brien, 3e. Chapte Perfectly competitive market A market that meets the conditions of (1) many buyers and sellers, (2) all firms selling identical products, and (3) no barriers to new firms entering the market. Price taker A buyer or seller that is unable to affect the market price. A Perfectly Competitive Firm Cannot Affect the Market Price Perfectly Competitive Markets Explain what a perfectly competitive market is and why a perfect competitor faces a horizontal demand curve. 11.1 LEARNING OBJECTIVE
  • 7. 7 of 39Copyright © 2010 Pearson Education, Inc. Publishing as Prentice Hall · Microeconomics · R. Glenn Hubbard, Anthony Patrick O’Brien, 3e. Chapte FIGURE 11-1 A Perfectly Competitive Firm Faces a Horizontal Demand Curve Perfectly Competitive Markets The Demand Curve for the Output of a Perfectly Competitive Firm A firm in a perfectly competitive market is selling exactly the same product as many other firms. Therefore, it can sell as much as it wants at the current market price, but it cannot sell anything at all if it raises the price by even 1 cent. As a result, the demand curve for a perfectly competitive firm’s output is a horizontal line. In the figure, whether the wheat farmer sells 6,000 bushels per year or 15,000 bushels has no effect on the market price of $4. Explain what a perfectly competitive market is and why a perfect competitor faces a horizontal demand curve. 11.1 LEARNING OBJECTIVE
  • 8. 8 of 39Copyright © 2010 Pearson Education, Inc. Publishing as Prentice Hall · Microeconomics · R. Glenn Hubbard, Anthony Patrick O’Brien, 3e. Chapte FIGURE 11-2 The Market Demand for Wheat versus the Demand for One Farmer’s Wheat Perfectly Competitive Markets The Demand Curve for the Output of a Perfectly Competitive Firm In a perfectly competitive market, price is determined by the intersection of market demand and market supply. In panel (a), the demand and supply curves for wheat intersect at a price of $4 per bushel. An individual wheat farmer like Farmer Parker cannot affect the market price for wheat. Therefore, as panel (b) shows, the demand curve for Farmer Parker’s wheat is a horizontal line. Don’t Let This Happen to YOU! Don’t Confuse the Demand Curve for Farmer Parker’s Wheat with the Market Demand Curve for Wheat YOUR TURN: Test your understanding by doing related problem 1.6 at the end of this chapter. Explain what a perfectly competitive market is and why a perfect competitor faces a horizontal demand curve. 11.1 LEARNING OBJECTIVE
  • 9. 9 of 39Copyright © 2010 Pearson Education, Inc. Publishing as Prentice Hall · Microeconomics · R. Glenn Hubbard, Anthony Patrick O’Brien, 3e. Chapte How a Firm Maximizes Profit in a Perfectly Competitive Market Profit Total revenue minus total cost. Profit = TR – TC Revenue for a Firm in a Perfectly Competitive Market Average revenue (AR) Total revenue divided by the quantity of the product sold. Marginal revenue (MR) The change in total revenue from selling one more unit of a product. or, quantityinChange revenuein totalChange RevenueMarginal Q TR MR ∆ ∆ == Explain how a firm maximizes profit in a perfectly competitive market. 11.2 LEARNING OBJECTIVE
  • 10. 10 of 39Copyright © 2010 Pearson Education, Inc. Publishing as Prentice Hall · Microeconomics · R. Glenn Hubbard, Anthony Patrick O’Brien, 3e. Chapte How a Firm Maximizes Profit in a Perfectly Competitive Market NUMBER OF BUSHELS (Q) MARKET PRICE (PER BUSHEL) (P) TOTAL REVENUE (TR) AVERAGE REVENUE (AR) MARGINAL REVENUE (MR) 0 1 2 3 4 5 6 7 8 9 10 $4 4 4 4 4 4 4 4 4 4 4 $0 4 8 12 16 20 24 28 32 36 40 - $4 4 4 4 4 4 4 4 4 4 - $4 4 4 4 4 4 4 4 4 4 Table 11-2 Farmer Parker’s Revenue from Wheat Farming Revenue for a Firm in a Perfectly Competitive Market Explain how a firm maximizes profit in a perfectly competitive market. 11.2 LEARNING OBJECTIVE
  • 11. 11 of 39Copyright © 2010 Pearson Education, Inc. Publishing as Prentice Hall · Microeconomics · R. Glenn Hubbard, Anthony Patrick O’Brien, 3e. Chapte How a Firm Maximizes Profit in a Perfectly Competitive Market QUANTITY (BUSHELS) (Q) TOTAL REVENUE (TR) TOTAL COST (TC) PROFIT (TR-TC) MARGINAL REVENUE (MR) MARGINAL COST (MC) 0 1 2 3 4 5 6 7 8 9 10 $0.00 4.00 8.00 12.00 16.00 20.00 24.00 28.00 32.00 36.00 40.00 $2.00 5.00 7.00 8.50 10.50 13.00 16.50 21.50 28.50 38.00 50.50 -$2.00 -1.00 1.00 3.50 5.50 7.00 7.50 6.50 3.50 -2.00 -10.50 — $4.00 4.00 4.00 4.00 4.00 4.00 4.00 4.00 4.00 4.00 — $3.00 2.00 1.50 2.00 2.50 3.50 5.00 7.00 9.50 12.50 Determining the Profit-Maximizing Level of Output Table 11-3 Farmer Parker’s Profits from Wheat Farming Explain how a firm maximizes profit in a perfectly competitive market. 11.2 LEARNING OBJECTIVE
  • 12. 12 of 39Copyright © 2010 Pearson Education, Inc. Publishing as Prentice Hall · Microeconomics · R. Glenn Hubbard, Anthony Patrick O’Brien, 3e. Chapte How a Firm Maximizes Profit in a Perfectly Competitive Market Determining the Profit-Maximizing Level of Output FIGURE 11-3 The Profit-Maximizing Level of Output In panel (a), Farmer Parker maximizes his profit where the vertical distance between total revenue and total cost is the largest. Panel (b) shows that Farmer Parker’s marginal revenue (MR) is equal to a constant $4 per bushel. Farmer Parker maximizes profits by producing wheat up to the point where the marginal revenue of the last bushel produced is equal to its marginal cost, or MR = MC. Explain how a firm maximizes profit in a perfectly competitive market. 11.2 LEARNING OBJECTIVE
  • 13. 13 of 39Copyright © 2010 Pearson Education, Inc. Publishing as Prentice Hall · Microeconomics · R. Glenn Hubbard, Anthony Patrick O’Brien, 3e. Chapte How a Firm Maximizes Profit in a Perfectly Competitive Market Determining the Profit-Maximizing Level of Output 1. The profit-maximizing level of output is where the difference between total revenue and total cost is the greatest. 2. The profit-maximizing level of output is also where marginal revenue equals marginal cost, or MR = MC. From the information in Table 11-3 and Figure 11-3, we can draw the following conclusions: Explain how a firm maximizes profit in a perfectly competitive market. 11.2 LEARNING OBJECTIVE
  • 14. 14 of 39Copyright © 2010 Pearson Education, Inc. Publishing as Prentice Hall · Microeconomics · R. Glenn Hubbard, Anthony Patrick O’Brien, 3e. Chapte Illustrating Profit or Loss on the Cost Curve Graph Profit = (P x Q) − TC − × Q QP )( = Q Profit Q TC P ATC Q = − Profit Profit = (P − ATC) x Q or Use graphs to show a firm’s profit or loss. 11.3 LEARNING OBJECTIVE
  • 15. 15 of 39Copyright © 2010 Pearson Education, Inc. Publishing as Prentice Hall · Microeconomics · R. Glenn Hubbard, Anthony Patrick O’Brien, 3e. Chapte Showing a Profit on the Graph FIGURE 11-4 The Area of Maximum Profit Illustrating Profit or Loss on the Cost Curve Graph A firm maximizes profit at the level of output at which marginal revenue equals marginal cost. The difference between price and average total cost equals profit per unit of output. Total profit equals profit per unit multiplied by the number of units produced. Total profit is represented by the area of the green-shaded rectangle, which has a height equal to (P - ATC) and a width equal to Q. Use graphs to show a firm’s profit or loss. 11.3 LEARNING OBJECTIVE
  • 16. 16 of 39Copyright © 2010 Pearson Education, Inc. Publishing as Prentice Hall · Microeconomics · R. Glenn Hubbard, Anthony Patrick O’Brien, 3e. Chapte Solved Problem 11-3 Determining Profit-Maximizing Price and Quantity OUTPUT PER DAY TOTAL COST 0 $10.00 1 20.50 2 24.50 3 28.50 4 34.00 5 43.00 6 55.50 7 72.00 8 93.00 9 119.00 YOUR TURN: For more practice, do related problems 3.3 and 3.4 at the end of this chapter. Use graphs to show a firm’s profit or loss. 11.3 LEARNING OBJECTIVE
  • 17. 17 of 39Copyright © 2010 Pearson Education, Inc. Publishing as Prentice Hall · Microeconomics · R. Glenn Hubbard, Anthony Patrick O’Brien, 3e. Chapte Illustrating Profit or Loss on the Cost Curve Graph Don’t Let This Happen to YOU! Remember That Firms Maximize Their Total Profits, Not Their Profits per Unit YOUR TURN: Test your understanding by doing related problem 3.5 at the end of this chapter. Use graphs to show a firm’s profit or loss. 11.3 LEARNING OBJECTIVE
  • 18. 18 of 39Copyright © 2010 Pearson Education, Inc. Publishing as Prentice Hall · Microeconomics · R. Glenn Hubbard, Anthony Patrick O’Brien, 3e. Chapte 1. P > ATC, which means the firm makes a profit. 2. P = ATC, which means the firm breaks even (its total cost equals its total revenue). 3. P < ATC, which means the firm experiences losses. Illustrating When a Firm Is Breaking Even or Operating at a Loss Illustrating Profit or Loss on the Cost Curve Graph Use graphs to show a firm’s profit or loss. 11.3 LEARNING OBJECTIVE
  • 19. 19 of 39Copyright © 2010 Pearson Education, Inc. Publishing as Prentice Hall · Microeconomics · R. Glenn Hubbard, Anthony Patrick O’Brien, 3e. Chapte FIGURE 11-5 A Firm Breaking Even and a Firm Experiencing Losses Illustrating When a Firm Is Breaking Even or Operating at a Loss Illustrating Profit or Loss on the Cost Curve Graph In panel (b), price is below average total cost, and the firm experiences a loss. The loss is represented by the area of the red-shaded rectangle, which has a height equal to (ATC - P) and a width equal to Q. In panel (a), price equals average total cost, and the firm breaks even because its total revenue will be equal to its total cost. In this situation, the firm makes zero economic profit. Use graphs to show a firm’s profit or loss. 11.3 LEARNING OBJECTIVE
  • 20. 20 of 39Copyright © 2010 Pearson Education, Inc. Publishing as Prentice Hall · Microeconomics · R. Glenn Hubbard, Anthony Patrick O’Brien, 3e. Chapte Losing Money in the Medical Screening Industry Making the Connection YOUR TURN: Test your understanding by doing related problem 3.8 at the end of this chapter. Use graphs to show a firm’s profit or loss. 11.3 LEARNING OBJECTIVE
  • 21. 21 of 39Copyright © 2010 Pearson Education, Inc. Publishing as Prentice Hall · Microeconomics · R. Glenn Hubbard, Anthony Patrick O’Brien, 3e. Chapte Deciding Whether to Produce or to Shut Down in the Short Run 1. Continue to produce 2. Stop production by shutting down temporarily Sunk cost A cost that has already been paid and that cannot be recovered. In the short run, a firm experiencing losses has two choices: Explain why firms may shut down temporarily. 11.4 LEARNING OBJECTIVE
  • 22. 22 of 39Copyright © 2010 Pearson Education, Inc. Publishing as Prentice Hall · Microeconomics · R. Glenn Hubbard, Anthony Patrick O’Brien, 3e. Chapte When to Close a Laundry Making the Connection Keeping a business open even when suffering losses can sometimes be the best decision for an entrepreneur in the short run. YOUR TURN: Test your understanding by doing related problems 4.5 and 4.6 at the end of this chapter. Explain why firms may shut down temporarily. 11.4 LEARNING OBJECTIVE
  • 23. 23 of 39Copyright © 2010 Pearson Education, Inc. Publishing as Prentice Hall · Microeconomics · R. Glenn Hubbard, Anthony Patrick O’Brien, 3e. Chapte Deciding Whether to Produce or to Shut Down in the Short Run Shutdown point The minimum point on a firm’s average variable cost curve; if the price falls below this point, the firm shuts down production in the short run. The Supply Curve of a Firm in the Short Run Total revenue < Variable cost, (P × Q) < VC P < AVC or, in symbols: If we divide both sides by Q, we have the result that the firm will shut down if: Explain why firms may shut down temporarily. 11.4 LEARNING OBJECTIVE
  • 24. 24 of 39Copyright © 2010 Pearson Education, Inc. Publishing as Prentice Hall · Microeconomics · R. Glenn Hubbard, Anthony Patrick O’Brien, 3e. Chapte FIGURE 11-6 The Firm’s Short-Run Supply Curve Deciding Whether to Produce or to Shut Down in the Short Run The Supply Curve of a Firm in the Short Run For any given price, we can determine the quantity of output the firm will supply from the marginal cost curve. In other words, the marginal cost curve is the firm’s supply curve. The firm will shut down if the price falls below average variable cost. The marginal cost curve crosses the average variable cost at the firm’s shutdown point. This point occurs at output level QSD. For prices below PMIN, the supply curve is a vertical line along the price axis, which shows that the firm will supply zero output at those prices. The red line in the figure is the firm’s short-run supply curve. Explain why firms may shut down temporarily. 11.4 LEARNING OBJECTIVE
  • 25. 25 of 39Copyright © 2010 Pearson Education, Inc. Publishing as Prentice Hall · Microeconomics · R. Glenn Hubbard, Anthony Patrick O’Brien, 3e. Chapte FIGURE 11-7 Firm Supply and Market Supply Deciding Whether to Produce or to Shut Down in the Short Run The Market Supply Curve in a Perfectly Competitive Industry We can derive the market supply curve by adding up the quantity that each firm in the market is willing to supply at each price. In panel (a), one wheat farmer is willing to supply 15,000 bushels of wheat at a price of $4 per bushel. If every wheat farmer supplies the same amount of wheat at this price and if there are 167,000 wheat farmers, the total amount of wheat supplied at a price of $4 will equal 15,000 bushels per farmer × 167,000 farmers = 2.5 billion bushels of wheat. Explain why firms may shut down temporarily. 11.4 LEARNING OBJECTIVE
  • 26. 26 of 39Copyright © 2010 Pearson Education, Inc. Publishing as Prentice Hall · Microeconomics · R. Glenn Hubbard, Anthony Patrick O’Brien, 3e. Chapte “If Everyone Can Do It, You Can’t Make Money at It”: The Entry and Exit of Firms in the Long Run EXPLICIT COSTS Water Wages Organic fertilizer Electricity Payment on bank loan $10,000 $15,000 $10,000 $5,000 $45,000 IMPLICIT COSTS Foregone salary Opportunity cost of the $100,000 she has invested in her farm $30,000 $10,000 Total cost $125,000 Economic Profit and the Entry or Exit Decision Table 11- 4 Farmer Moreno’s Costs per Year Economic profit A firm’s revenues minus all its costs, implicit and explicit. Explain how entry and exit ensure that perfectly competitive firms earn zero economic profit in the long run. 11.5 LEARNING OBJECTIVE
  • 27. 27 of 39Copyright © 2010 Pearson Education, Inc. Publishing as Prentice Hall · Microeconomics · R. Glenn Hubbard, Anthony Patrick O’Brien, 3e. Chapte Economic Profit Leads to Entry of New Firms FIGURE 11-8 The Effect of Entry on Economic Profits Economic Profit and the Entry or Exit Decision “If Everyone Can Do It, You Can’t Make Money at It”: The Entry and Exit of Firms in the Long Run Explain how entry and exit ensure that perfectly competitive firms earn zero economic profit in the long run. 11.5 LEARNING OBJECTIVE
  • 28. 28 of 39Copyright © 2010 Pearson Education, Inc. Publishing as Prentice Hall · Microeconomics · R. Glenn Hubbard, Anthony Patrick O’Brien, 3e. Chapte FIGURE 11-9 The Effect of Exit on Economic Losses Economic Losses Lead to Exit of Firms Economic Profit and the Entry or Exit Decision “If Everyone Can Do It, You Can’t Make Money at It”: The Entry and Exit of Firms in the Long Run
  • 29. 29 of 39Copyright © 2010 Pearson Education, Inc. Publishing as Prentice Hall · Microeconomics · R. Glenn Hubbard, Anthony Patrick O’Brien, 3e. Chapte The Effect of Exit on Economic Losses FIGURE 11-9 The Effect of Exit on Economic Losses (continued) Economic Losses Lead to Exit of Firms Economic Profit and the Entry or Exit Decision “If Everyone Can Do It, You Can’t Make Money at It”: The Entry and Exit of Firms in the Long Run Explain how entry and exit ensure that perfectly competitive firms earn zero economic profit in the long run. 11.5 LEARNING OBJECTIVE
  • 30. 30 of 39Copyright © 2010 Pearson Education, Inc. Publishing as Prentice Hall · Microeconomics · R. Glenn Hubbard, Anthony Patrick O’Brien, 3e. Chapte Economic loss The situation in which a firm’s total revenue is less than its total cost, including all implicit costs. Long-Run Equilibrium in a Perfectly Competitive Market Long-run competitive equilibrium The situation in which the entry and exit of firms has resulted in the typical firm breaking even. Economic Losses Lead to Exit of Firms Economic Profit and the Entry or Exit Decision “If Everyone Can Do It, You Can’t Make Money at It”: The Entry and Exit of Firms in the Long Run Explain how entry and exit ensure that perfectly competitive firms earn zero economic profit in the long run. 11.5 LEARNING OBJECTIVE
  • 31. 31 of 39Copyright © 2010 Pearson Education, Inc. Publishing as Prentice Hall · Microeconomics · R. Glenn Hubbard, Anthony Patrick O’Brien, 3e. Chapte FIGURE 11-10 The Long-Run Supply Curve in a Perfectly Competitive Industry The Long-Run Supply Curve in a Perfectly Competitive Market “If Everyone Can Do It, You Can’t Make Money at It”: The Entry and Exit of Firms in the Long Run Explain how entry and exit ensure that perfectly competitive firms earn zero economic profit in the long run. 11.5 LEARNING OBJECTIVE
  • 32. 32 of 39Copyright © 2010 Pearson Education, Inc. Publishing as Prentice Hall · Microeconomics · R. Glenn Hubbard, Anthony Patrick O’Brien, 3e. Chapte Long-run supply curve A curve that shows the relationship in the long run between market price and the quantity supplied. Increasing-Cost and Decreasing-Cost Industries Industries with upward-sloping long- run supply curves are called increasing-cost industries. Industries with downward-sloping long- run supply curves are called decreasing-cost industries. The Long-Run Supply Curve in a Perfectly Competitive Market “If Everyone Can Do It, You Can’t Make Money at It”: The Entry and Exit of Firms in the Long Run Explain how entry and exit ensure that perfectly competitive firms earn zero economic profit in the long run. 11.5 LEARNING OBJECTIVE
  • 33. 33 of 39Copyright © 2010 Pearson Education, Inc. Publishing as Prentice Hall · Microeconomics · R. Glenn Hubbard, Anthony Patrick O’Brien, 3e. Chapte Easy Entry Makes the Long Run Pretty Short in the Apple iPhone Apps Store Making the Connection Economic profits are rapidly competed away in the iPhone apps store. YOUR TURN: Test your understanding by doing related problem 6.7 at the end of this chapter. In a competitive market, earning an economic profit in the long run is extremely difficult. And the ease of entering the market for iPhone apps has made the long run pretty short. Explain how entry and exit ensure that perfectly competitive firms earn zero economic profit in the long run. 11.5 LEARNING OBJECTIVE
  • 34. 34 of 39Copyright © 2010 Pearson Education, Inc. Publishing as Prentice Hall · Microeconomics · R. Glenn Hubbard, Anthony Patrick O’Brien, 3e. Chapte Perfect Competition and Efficiency Productive efficiency The situation in which a good or service is produced at the lowest possible cost. Productive Efficiency Explain how perfect competition leads to economic efficiency. 11.6 LEARNING OBJECTIVE
  • 35. 35 of 39Copyright © 2010 Pearson Education, Inc. Publishing as Prentice Hall · Microeconomics · R. Glenn Hubbard, Anthony Patrick O’Brien, 3e. Chapte How Productive Efficiency Benefits Consumers Solved Problem 11-6 YOUR TURN: For more practice, do related problems 6.4, 6.5, and 6.6 at the end of this chapter. In the long run, firms only break even on their investment in producing high-technology goods. That result implies that investors in these firms are also unlikely to earn an economic profit in the long run. Explain how perfect competition leads to economic efficiency. 11.6 LEARNING OBJECTIVE
  • 36. 36 of 39Copyright © 2010 Pearson Education, Inc. Publishing as Prentice Hall · Microeconomics · R. Glenn Hubbard, Anthony Patrick O’Brien, 3e. Chapte Perfect Competition and Efficiency 1. The price of a good represents the marginal benefit consumers receive from consuming the last unit of the good sold. 2. Perfectly competitive firms produce up to the point where the price of the good equals the marginal cost of producing the last unit. 3. Therefore, firms produce up to the point where the last unit provides a marginal benefit to consumers equal to the marginal cost of producing it. Allocative Efficiency Firms will supply all those goods that provide consumers with a marginal benefit at least as great as the marginal cost of producing them. Explain how perfect competition leads to economic efficiency. 11.6 LEARNING OBJECTIVE
  • 37. 37 of 39Copyright © 2010 Pearson Education, Inc. Publishing as Prentice Hall · Microeconomics · R. Glenn Hubbard, Anthony Patrick O’Brien, 3e. Chapte Perfect Competition and Efficiency Allocative efficiency A state of the economy in which production represents consumer preferences; in particular, every good or service is produced up to the point where the last unit provides a marginal benefit to consumers equal to the marginal cost of producing it. Allocative Efficiency Explain how perfect competition leads to economic efficiency. 11.6 LEARNING OBJECTIVE
  • 38. 38 of 39Copyright © 2010 Pearson Education, Inc. Publishing as Prentice Hall · Microeconomics · R. Glenn Hubbard, Anthony Patrick O’Brien, 3e. Chapte AN INSIDE LOOK Figure 1 The demand for a product increases after it is “green certified.” The graph assumes that the firm did not spend money to acquire certification for its product. It Isn’t Easy—or Cheap—to Be Green>> Figure 2 The demand for a product increases after it is “green certified.” The marginal cost and average total cost curves shift up due to the cost of certification.
  • 39. 39 of 39Copyright © 2010 Pearson Education, Inc. Publishing as Prentice Hall · Microeconomics · R. Glenn Hubbard, Anthony Patrick O’Brien, 3e. Chapte Allocative efficiency Average revenue (AR) Economic loss Economic profit Long-run competitive equilibrium Long-run supply curve Marginal revenue (MR) Perfectly competitive market Price taker Productive efficiency Profit Shutdown point Sunk cost KEY TERMS