INTRODUCTION ACTIVITY
• Geta number from your teacher
• Open your google classroom and the Survey Activity - Using your
number fill in the description given on the top (don’t create your
own copy) – You should type only in your row number
• After everybody‘s done, make your own copy and rename it by
your own title.
3.
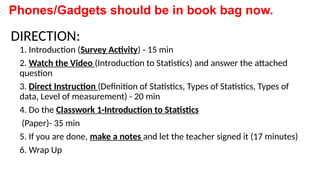
DIRECTION:
1. Introduction (SurveyActivity) - 15 min
2. Watch the Video (Introduction to Statistics) and answer the attached
question
3. Direct Instruction (Definition of Statistics, Types of Statistics, Types of
data, Level of measurement) - 20 min
4. Do the Classwork 1-Introduction to Statistics
(Paper)- 35 min
5. If you are done, make a notes and let the teacher signed it (17 minutes)
6. Wrap Up
Phones/Gadgets should be in book bag now.
4.
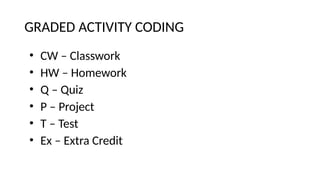
GRADED ACTIVITY CODING
•CW – Classwork
• HW – Homework
• Q – Quiz
• P – Project
• T – Test
• Ex – Extra Credit
5.
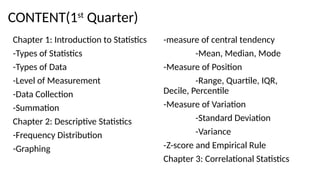
CONTENT(1st
Quarter)
Chapter 1: Introductionto Statistics
-Types of Statistics
-Types of Data
-Level of Measurement
-Data Collection
-Summation
Chapter 2: Descriptive Statistics
-Frequency Distribution
-Graphing
-measure of central tendency
-Mean, Median, Mode
-Measure of Position
-Range, Quartile, IQR,
Decile, Percentile
-Measure of Variation
-Standard Deviation
-Variance
-Z-score and Empirical Rule
Chapter 3: Correlational Statistics
6.
P
R
O
B
&
S
T
A
T
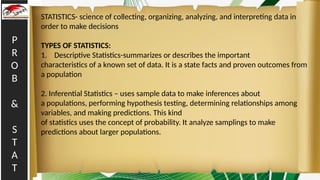
STATISTICS- science ofcollecting, organizing, analyzing, and interpreting data in
order to make decisions
TYPES OF STATISTICS:
1. Descriptive Statistics-summarizes or describes the important
characteristics of a known set of data. It is a state facts and proven outcomes from
a population
2. Inferential Statistics – uses sample data to make inferences about
a populations, performing hypothesis testing, determining relationships among
variables, and making predictions. This kind
of statistics uses the concept of probability. It analyze samplings to make
predictions about larger populations.
7.
P
R
O
B
&
S
T
A
T
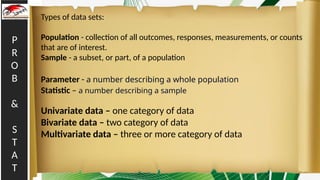
Types of datasets:
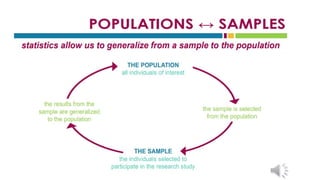
Population - collection of all outcomes, responses, measurements, or counts
that are of interest.
Sample - a subset, or part, of a population
Parameter - a number describing a whole population
Statistic – a number describing a sample
Univariate data – one category of data
Bivariate data – two category of data
Multivariate data – three or more category of data
9.
P
R
O
B
&
S
T
A
T
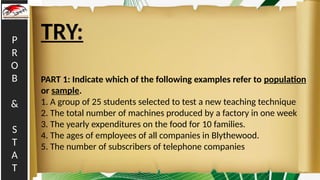
TRY:
PART 1: Indicatewhich of the following examples refer to population
or sample.
1. A group of 25 students selected to test a new teaching technique
2. The total number of machines produced by a factory in one week
3. The yearly expenditures on the food for 10 families.
4. The ages of employees of all companies in Blythewood.
5. The number of subscribers of telephone companies
10.
P
R
O
B
&
S
T
A
T
PART 2: Indicatewhether each of the following statements
is a descriptive or inferential statistics.
6. Last semester, ages of the students at a certain college ranged from
16 to 25 years old.
7. Based on the survey conducted by the Bureau of Statistics, it is
estimated that 24% of unemployed people are women.
8. A survey says that 3 out of 10 Americans is a member of a fitness
center
9. Cigarettes were associated with 31% of the 4700 civilian fire death in
2020.
10. A recent study showed that eating garlic can lower blood pressure
11.
P
R
O
B
&
S
T
A
T
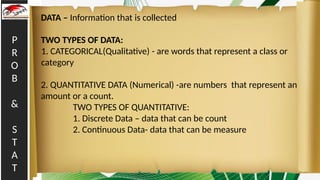
DATA – Informationthat is collected
TWO TYPES OF DATA:
1. CATEGORICAL(Qualitative) - are words that represent a class or
category
2. QUANTITATIVE DATA (Numerical) -are numbers that represent an
amount or a count.
TWO TYPES OF QUANTITATIVE:
1. Discrete Data – data that can be count
2. Continuous Data- data that can be measure
12.
P
R
O
B
&
S
T
A
T
TRY:
PART 3: Classifyeach variable as Quantitative or Qualitative
11. The height of giraffe living in India
12. The religious affiliation of the people in the USA
13. Favorite Movie
14. The number of houses owned
15. Nationality
13.
P
R
O
B
&
S
T
A
T
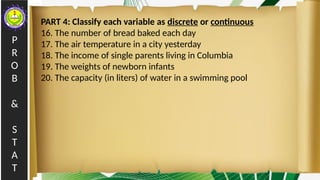
PART 4: Classifyeach variable as discrete or continuous
16. The number of bread baked each day
17. The air temperature in a city yesterday
18. The income of single parents living in Columbia
19. The weights of newborn infants
20. The capacity (in liters) of water in a swimming pool
14.
P
R
O
B
&
S
T
A
T
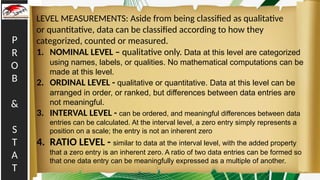
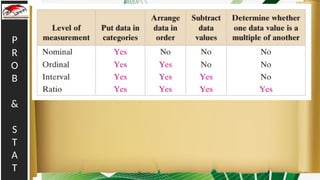
LEVEL MEASUREMENTS: Asidefrom being classified as qualitative
or quantitative, data can be classified according to how they
categorized, counted or measured.
1. NOMINAL LEVEL – qualitative only. Data at this level are categorized
using names, labels, or qualities. No mathematical computations can be
made at this level.
2. ORDINAL LEVEL - qualitative or quantitative. Data at this level can be
arranged in order, or ranked, but differences between data entries are
not meaningful.
3. INTERVAL LEVEL - can be ordered, and meaningful differences between data
entries can be calculated. At the interval level, a zero entry simply represents a
position on a scale; the entry is not an inherent zero
4. RATIO LEVEL - similar to data at the interval level, with the added property
that a zero entry is an inherent zero. A ratio of two data entries can be formed so
that one data entry can be meaningfully expressed as a multiple of another.
P
R
O
B
&
S
T
A
T
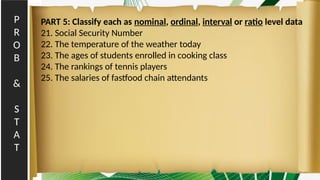
PART 5: Classifyeach as nominal, ordinal, interval or ratio level data
21. Social Security Number
22. The temperature of the weather today
23. The ages of students enrolled in cooking class
24. The rankings of tennis players
25. The salaries of fastfood chain attendants
17.
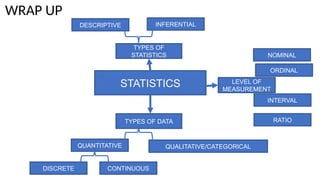
WRAP UP
STATISTICS
TYPES OF
STATISTICS
TYPESOF DATA
QUANTITATIVE QUALITATIVE/CATEGORICAL
DISCRETE CONTINUOUS
DESCRIPTIVE INFERENTIAL
LEVEL OF
MEASUREMENT
NOMINAL
ORDINAL
INTERVAL
RATIO