Downloaded 363 times

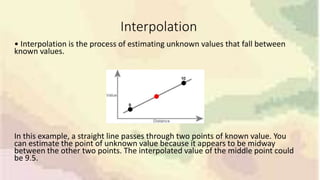
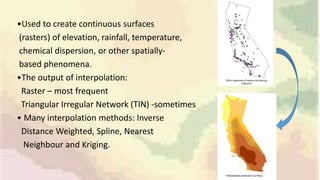
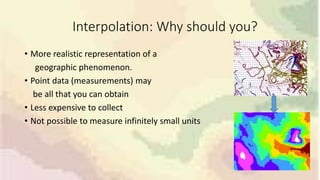
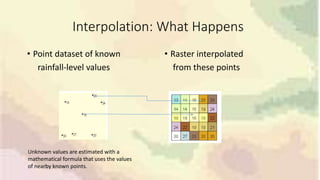


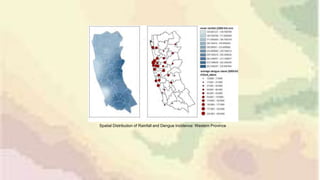


This document discusses inverse distance weighting (IDW) interpolation, which is a technique used to estimate unknown values between known data points. IDW assumes that points closer to one another are more alike than distant points. The interpolated value is a weighted average of known points, with the weights being inversely proportional to the distances. This allows for the creation of continuous surfaces like elevation or temperature from point data. A case study examines the relationship between weekly rainfall patterns and dengue outbreaks in Sri Lanka using IDW and GIS tools to model spatial and temporal associations and identify potential risk areas.