Downloaded 406 times
![Stratified Sample Size (1)
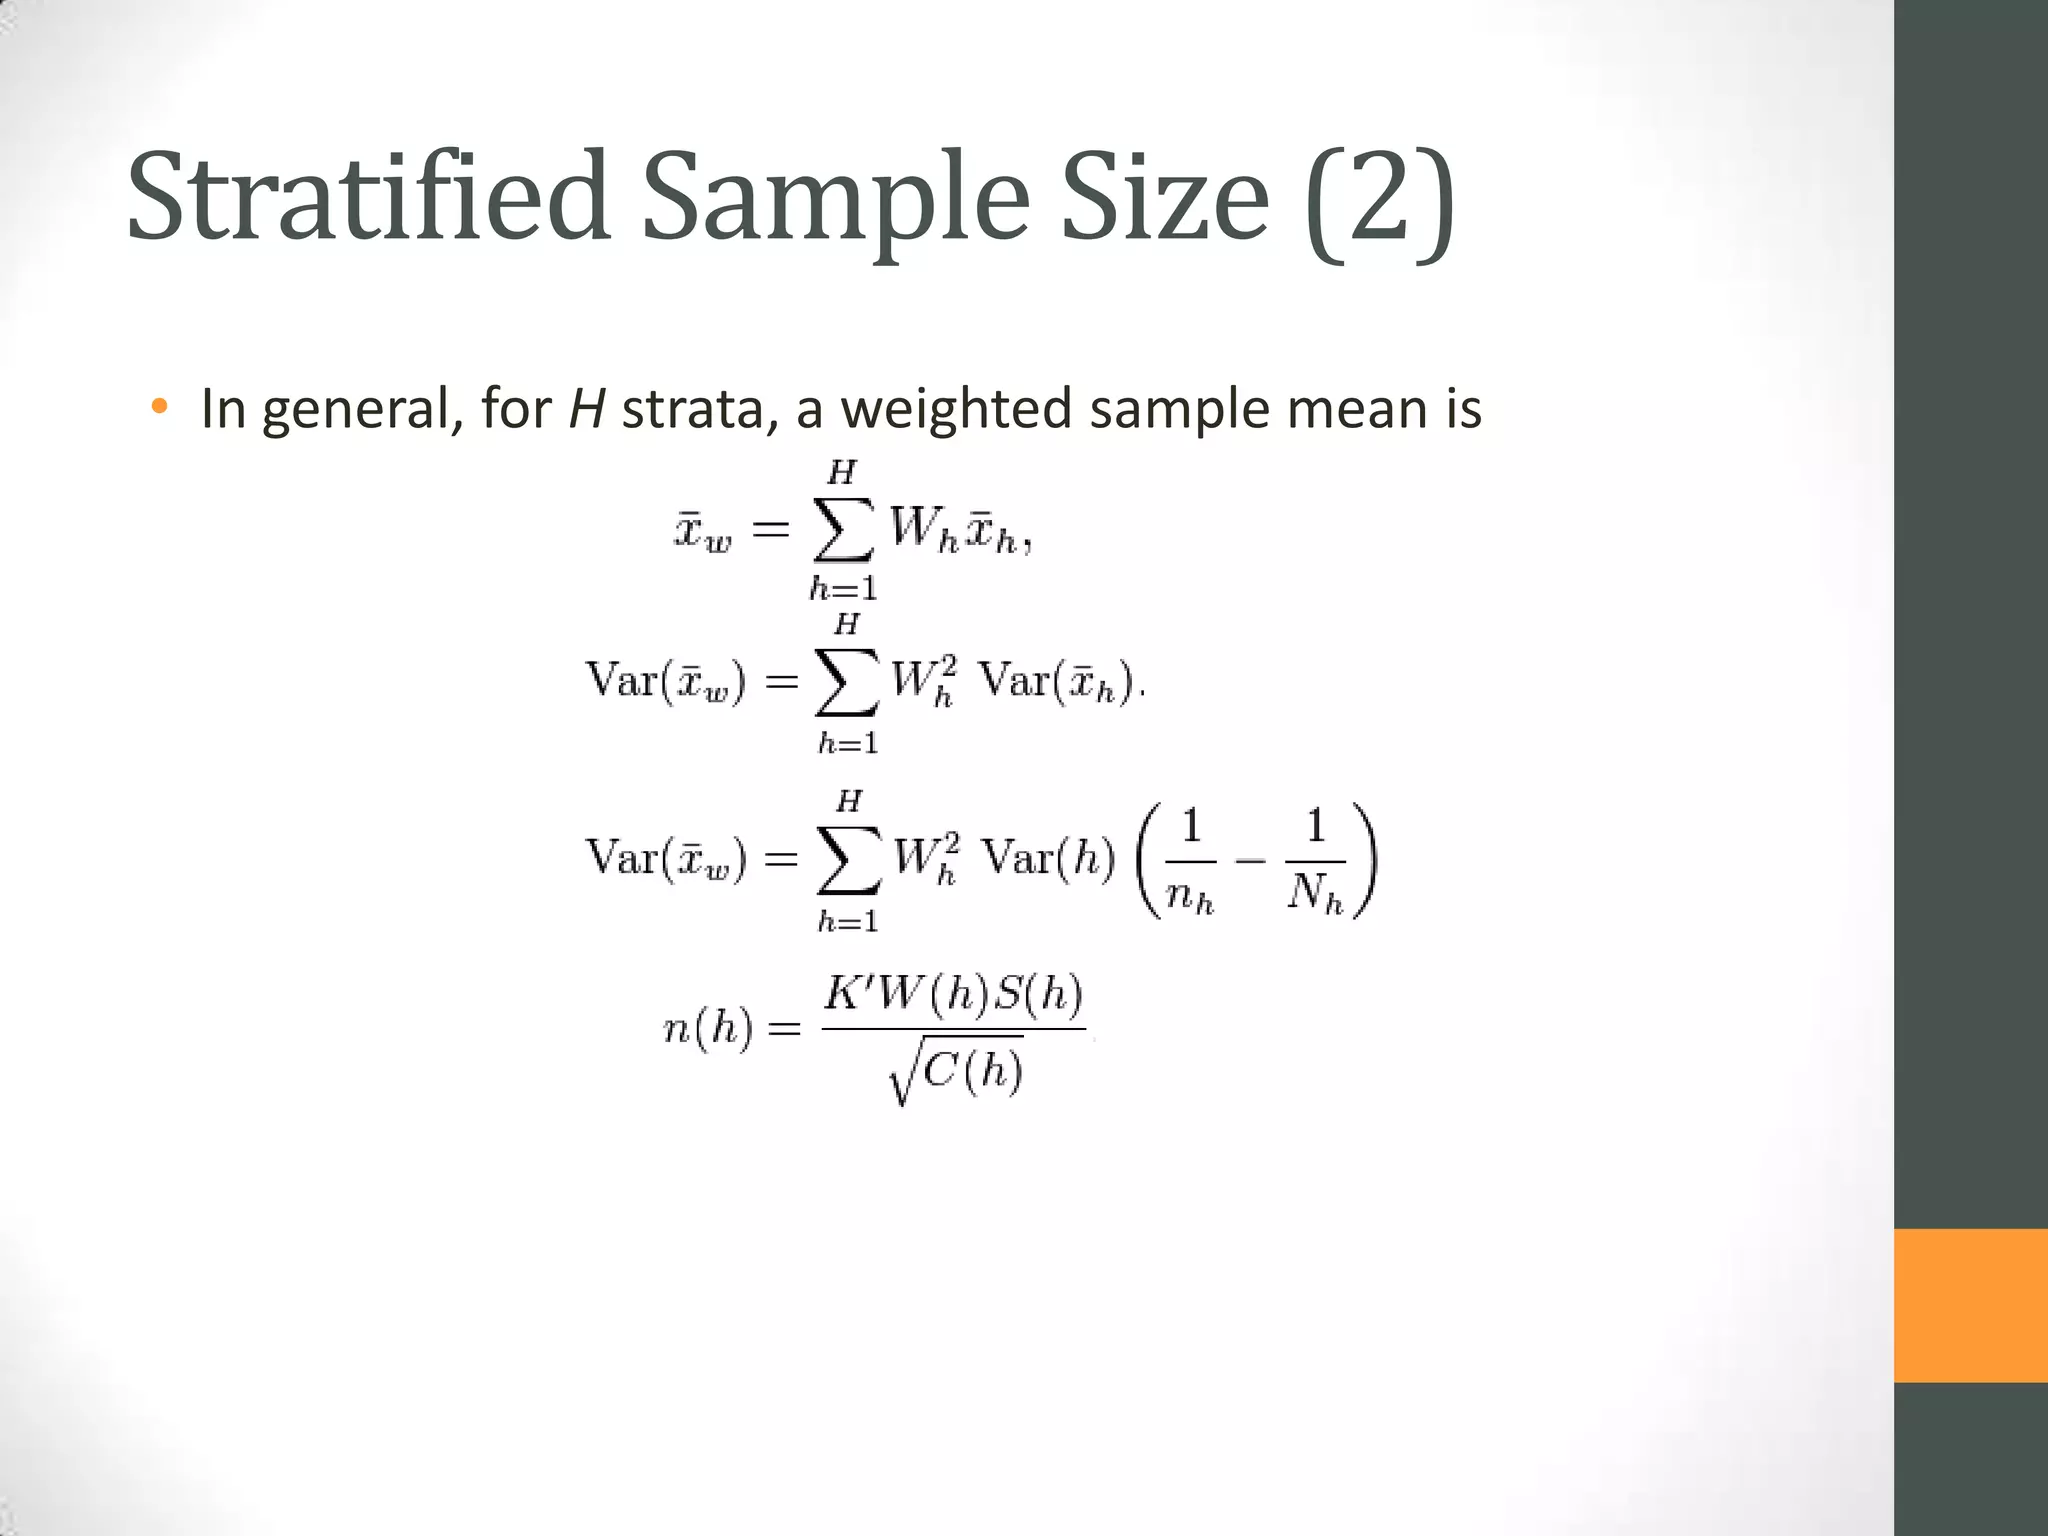
• The sample can often be split up into sub-samples. Typically, if
there are k such sub-samples (from k different strata) then
each of them will have a sample size ni, i = 1, 2, ..., k. These ni
must conform to the rule that n1 + n2 + ... + nk = n (i.e. that
the total sample size is given by the sum of the sub-sample
sizes). Selecting these ni optimally can be done in various
ways, using (for example) Neyman's optimal allocation.
• There are many reasons to use stratified sampling:[7] to
decrease variances of sample estimates, to use partly nonrandom methods, or to study strata individually. A
useful, partly non-random method would be to sample
individuals where easily accessible, but, where not, sample
clusters to save travel costs.](https://image.slidesharecdn.com/introductiontosampling-131029161007-phpapp02/75/Introduction-to-sampling-20-2048.jpg)


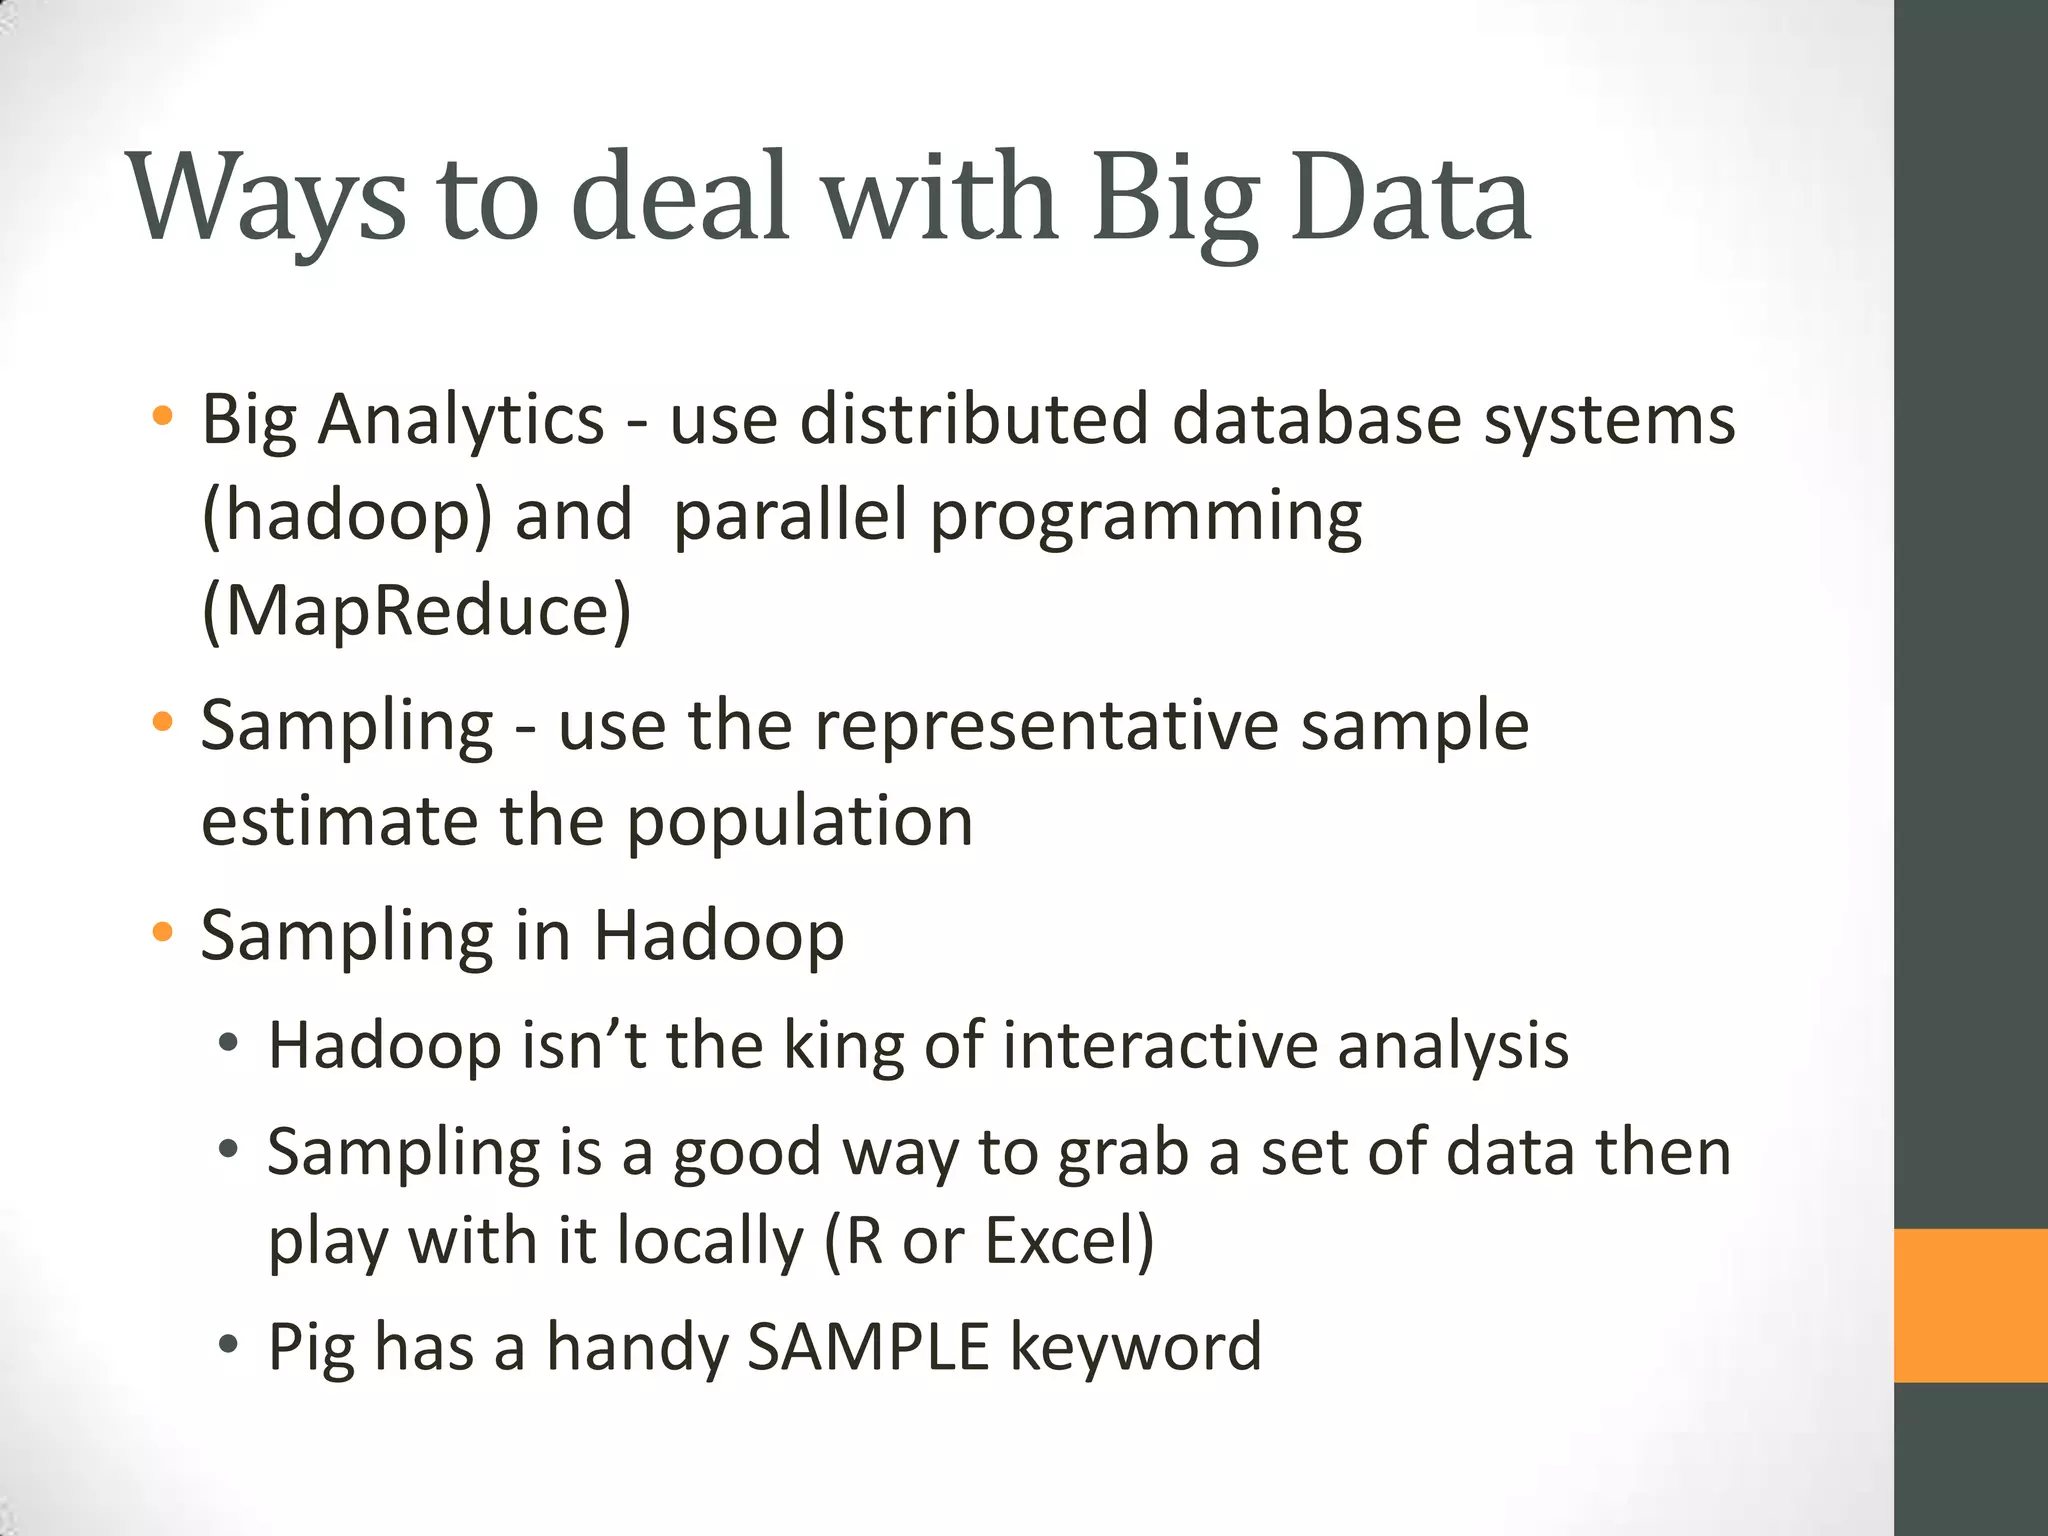
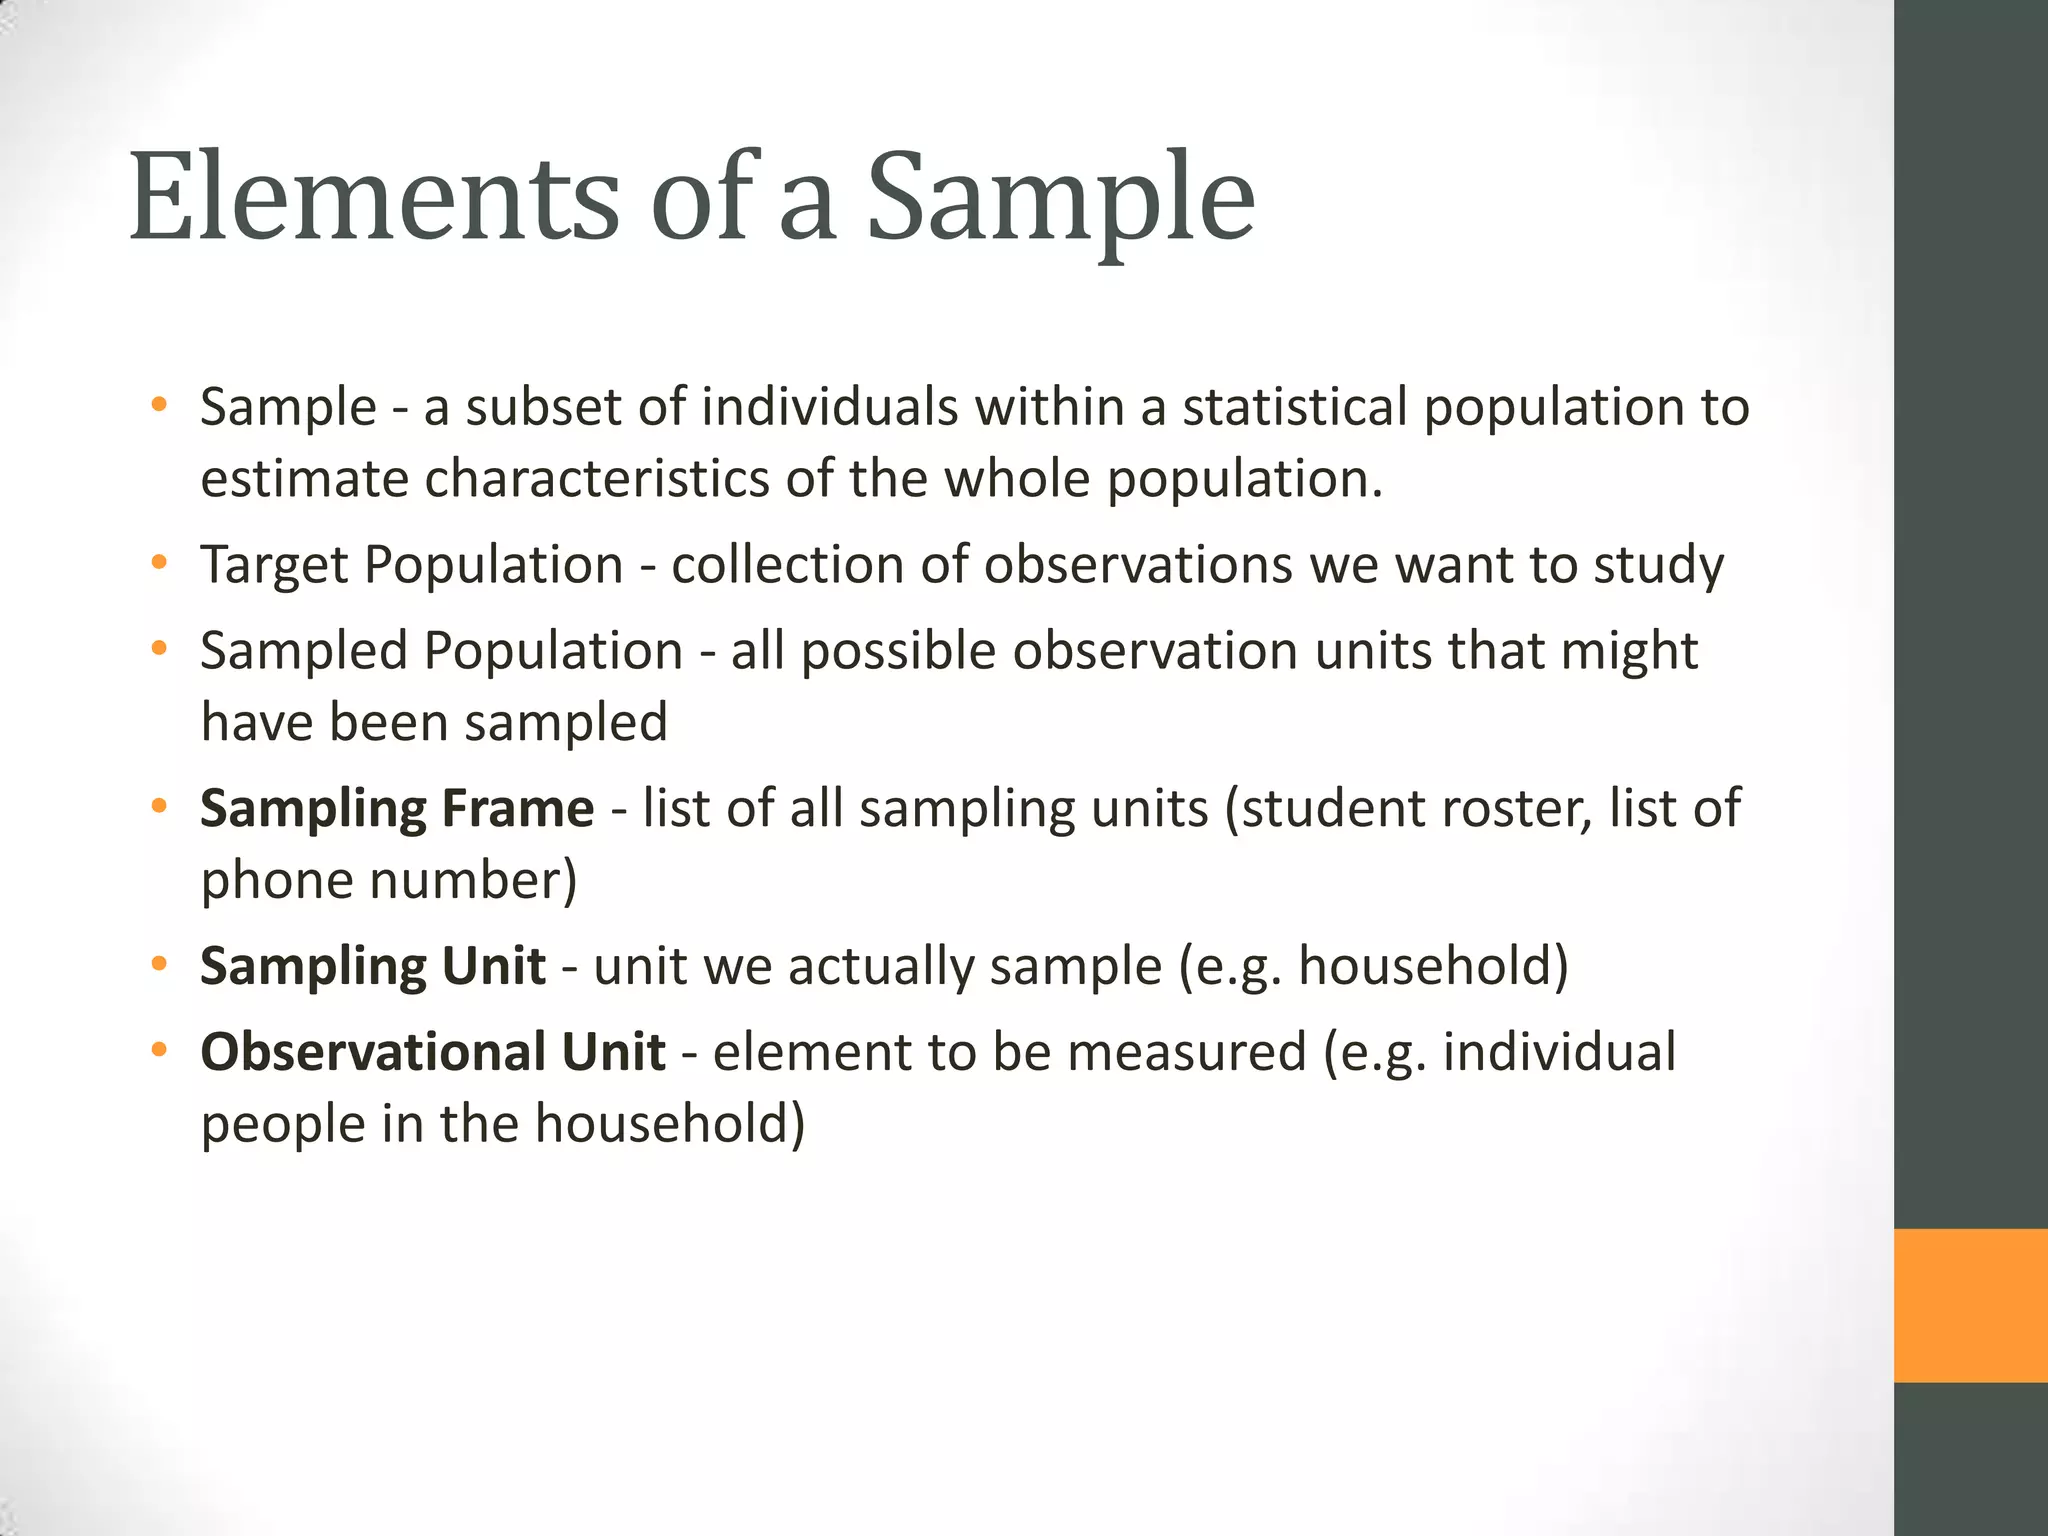
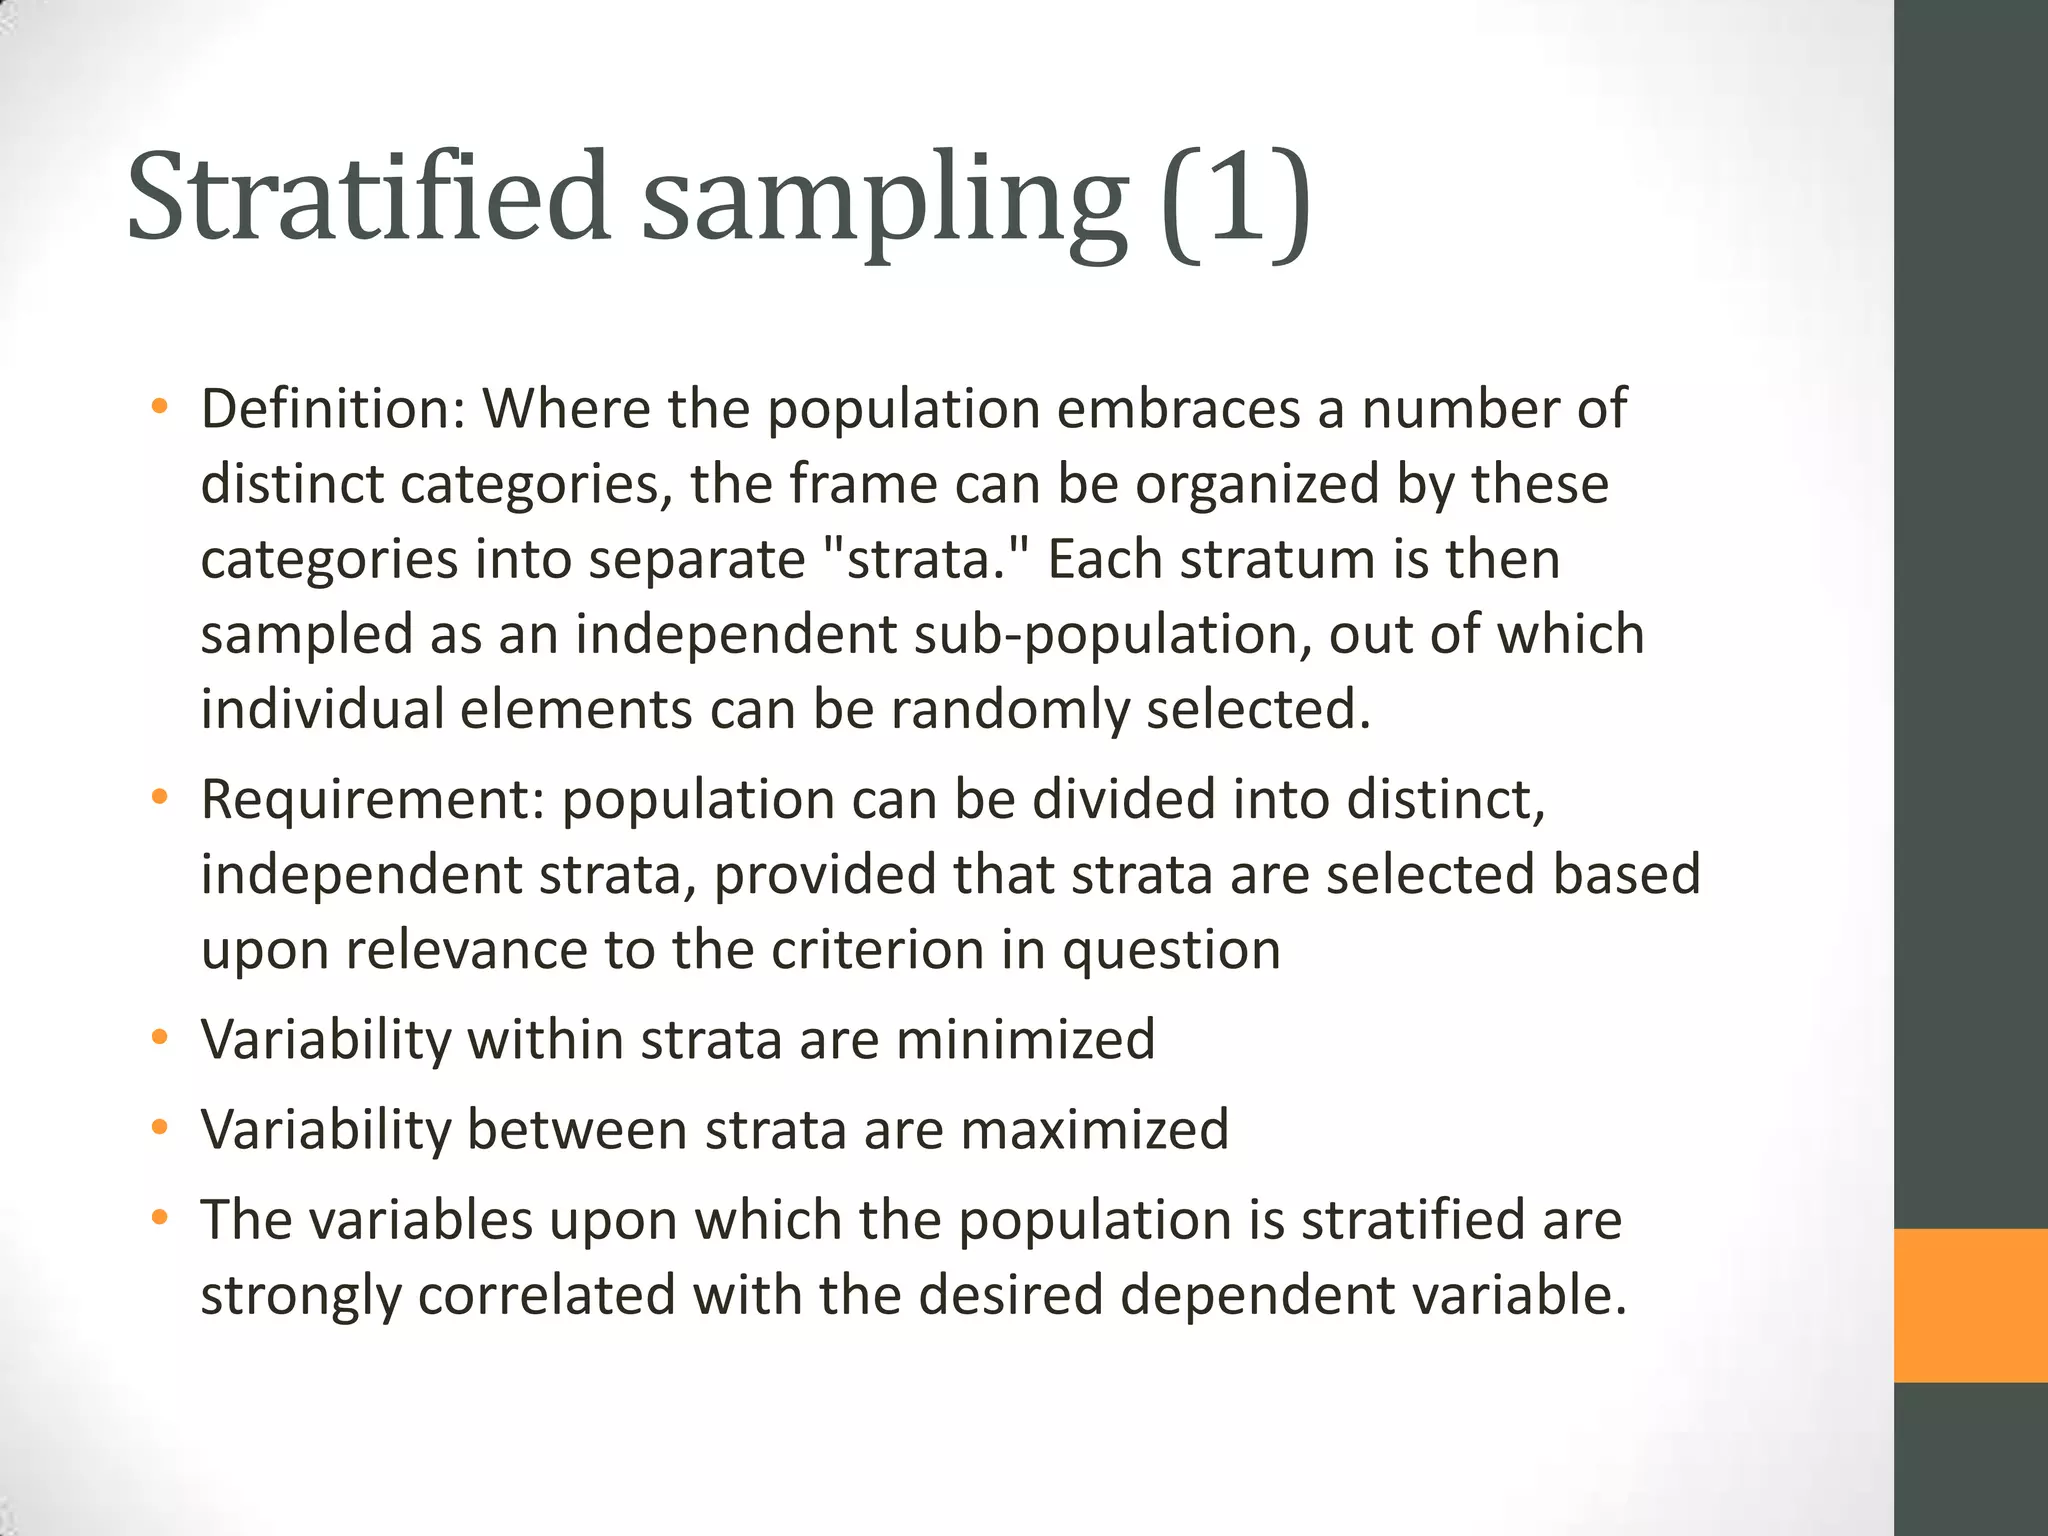
This document discusses different sampling techniques that can be used to analyze large datasets. It defines key sampling concepts like the target population, sampling frame, and sampling unit. Probability sampling techniques described include simple random sampling, systematic sampling, stratified sampling, cluster sampling, and probability proportional to size sampling. Non-probability sampling techniques include convenience sampling and purposive sampling. The document also covers how to calculate sample sizes needed to estimate proportions and means within a desired level of accuracy. Stratified sampling can help reduce variability and improve efficiency by dividing the population into relevant subgroups.