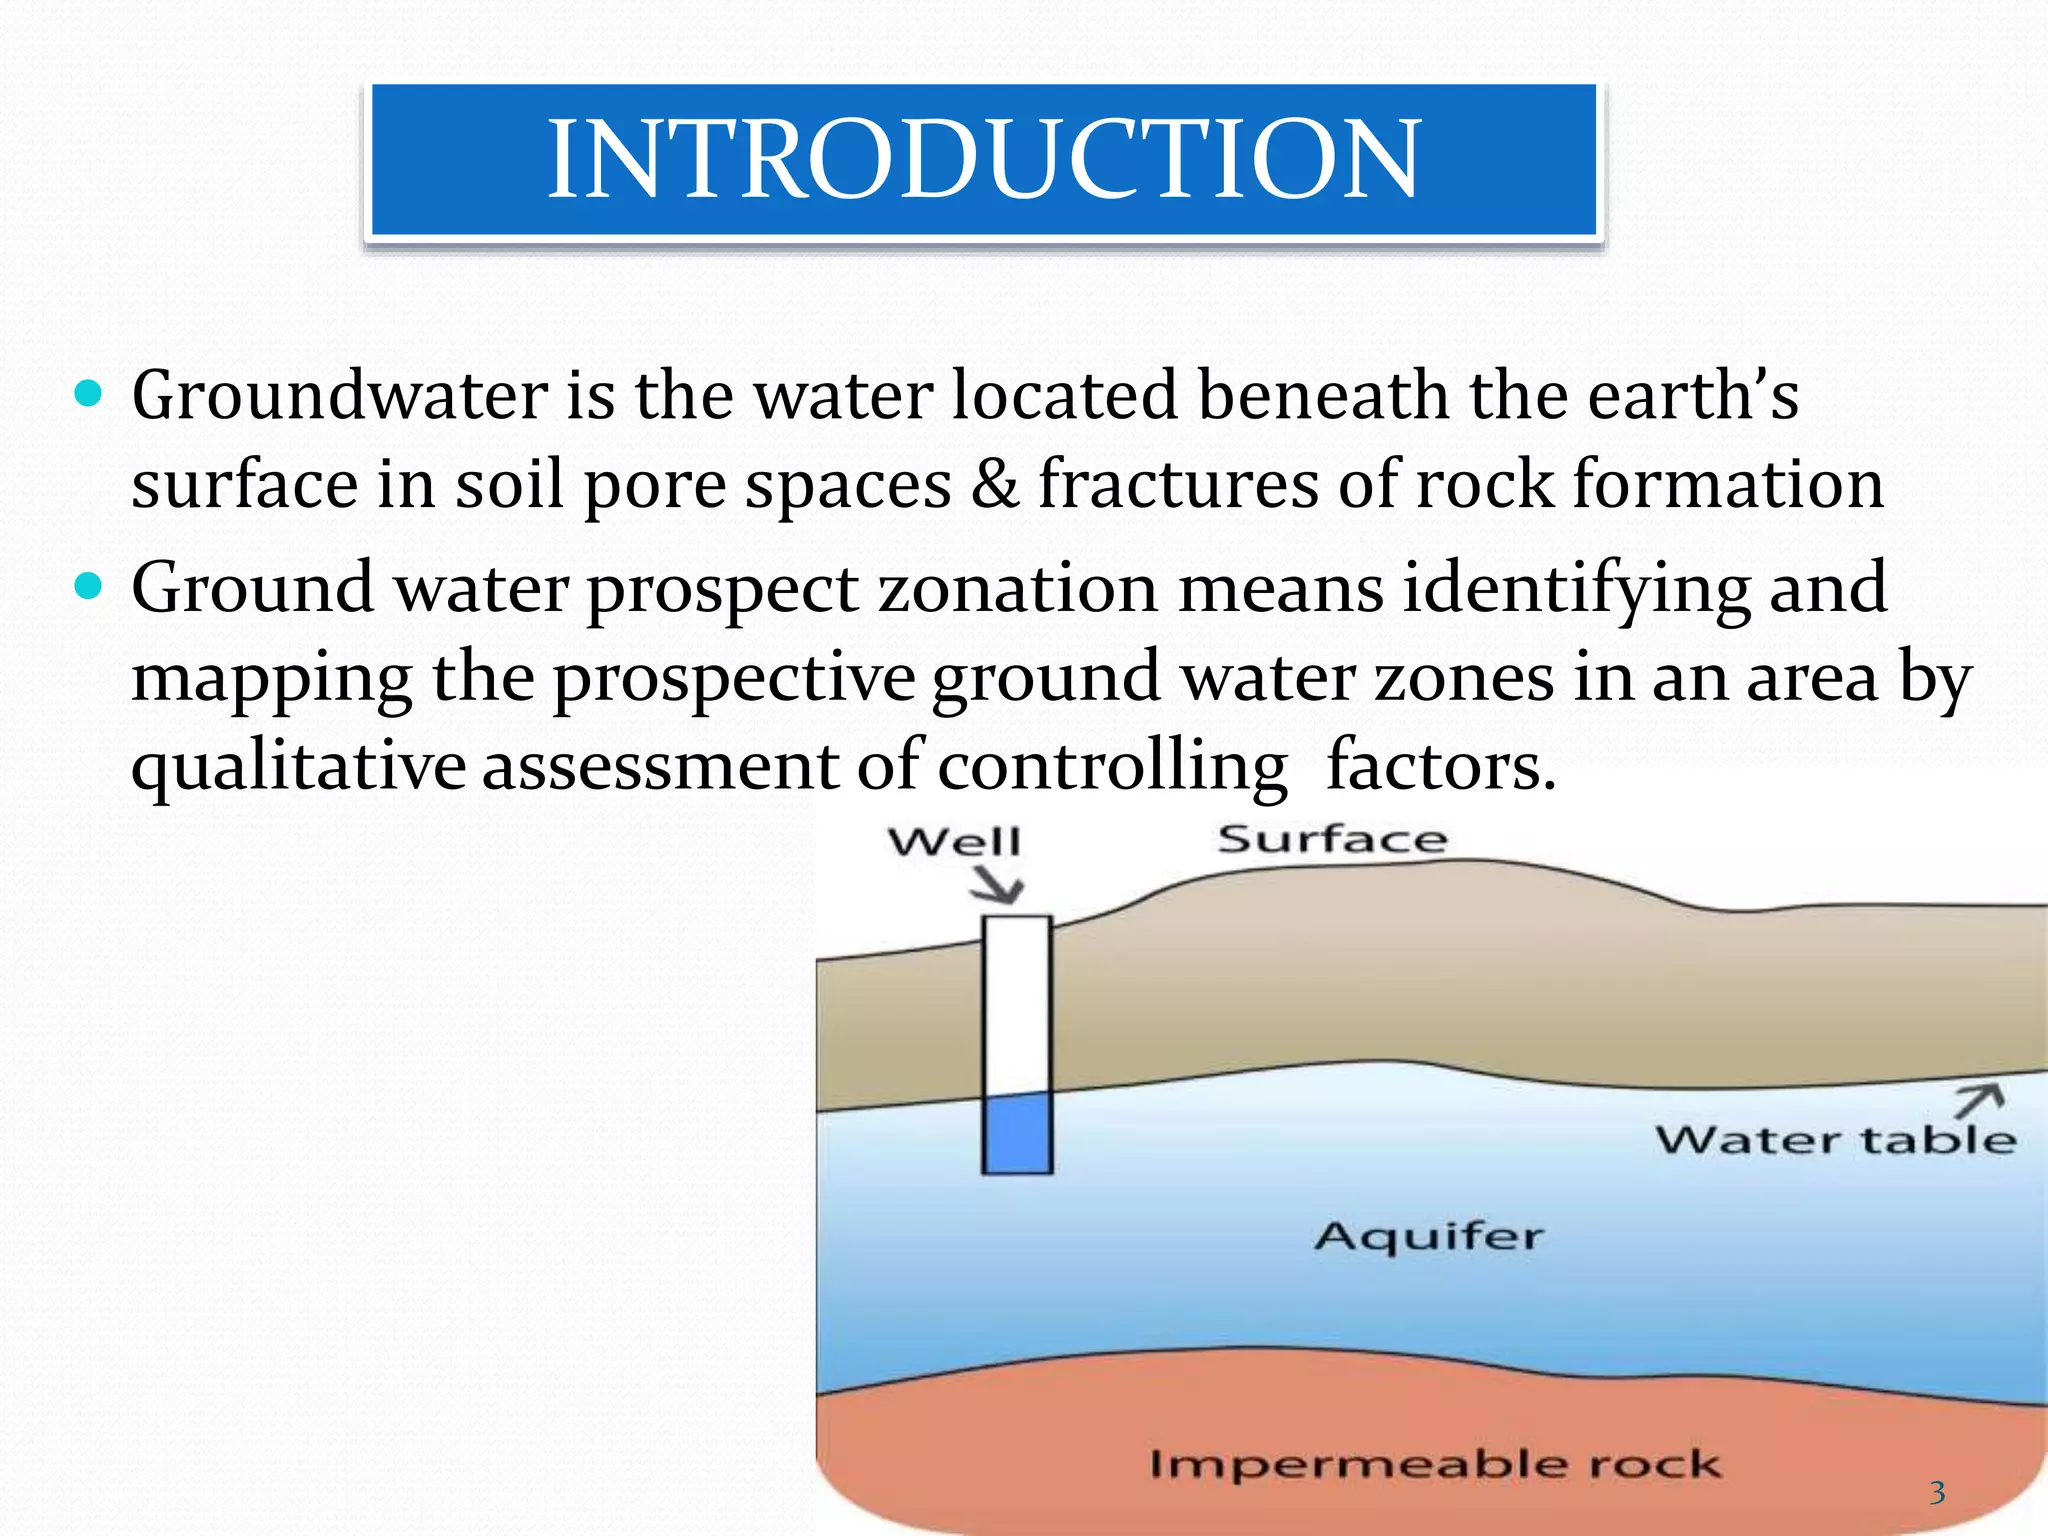
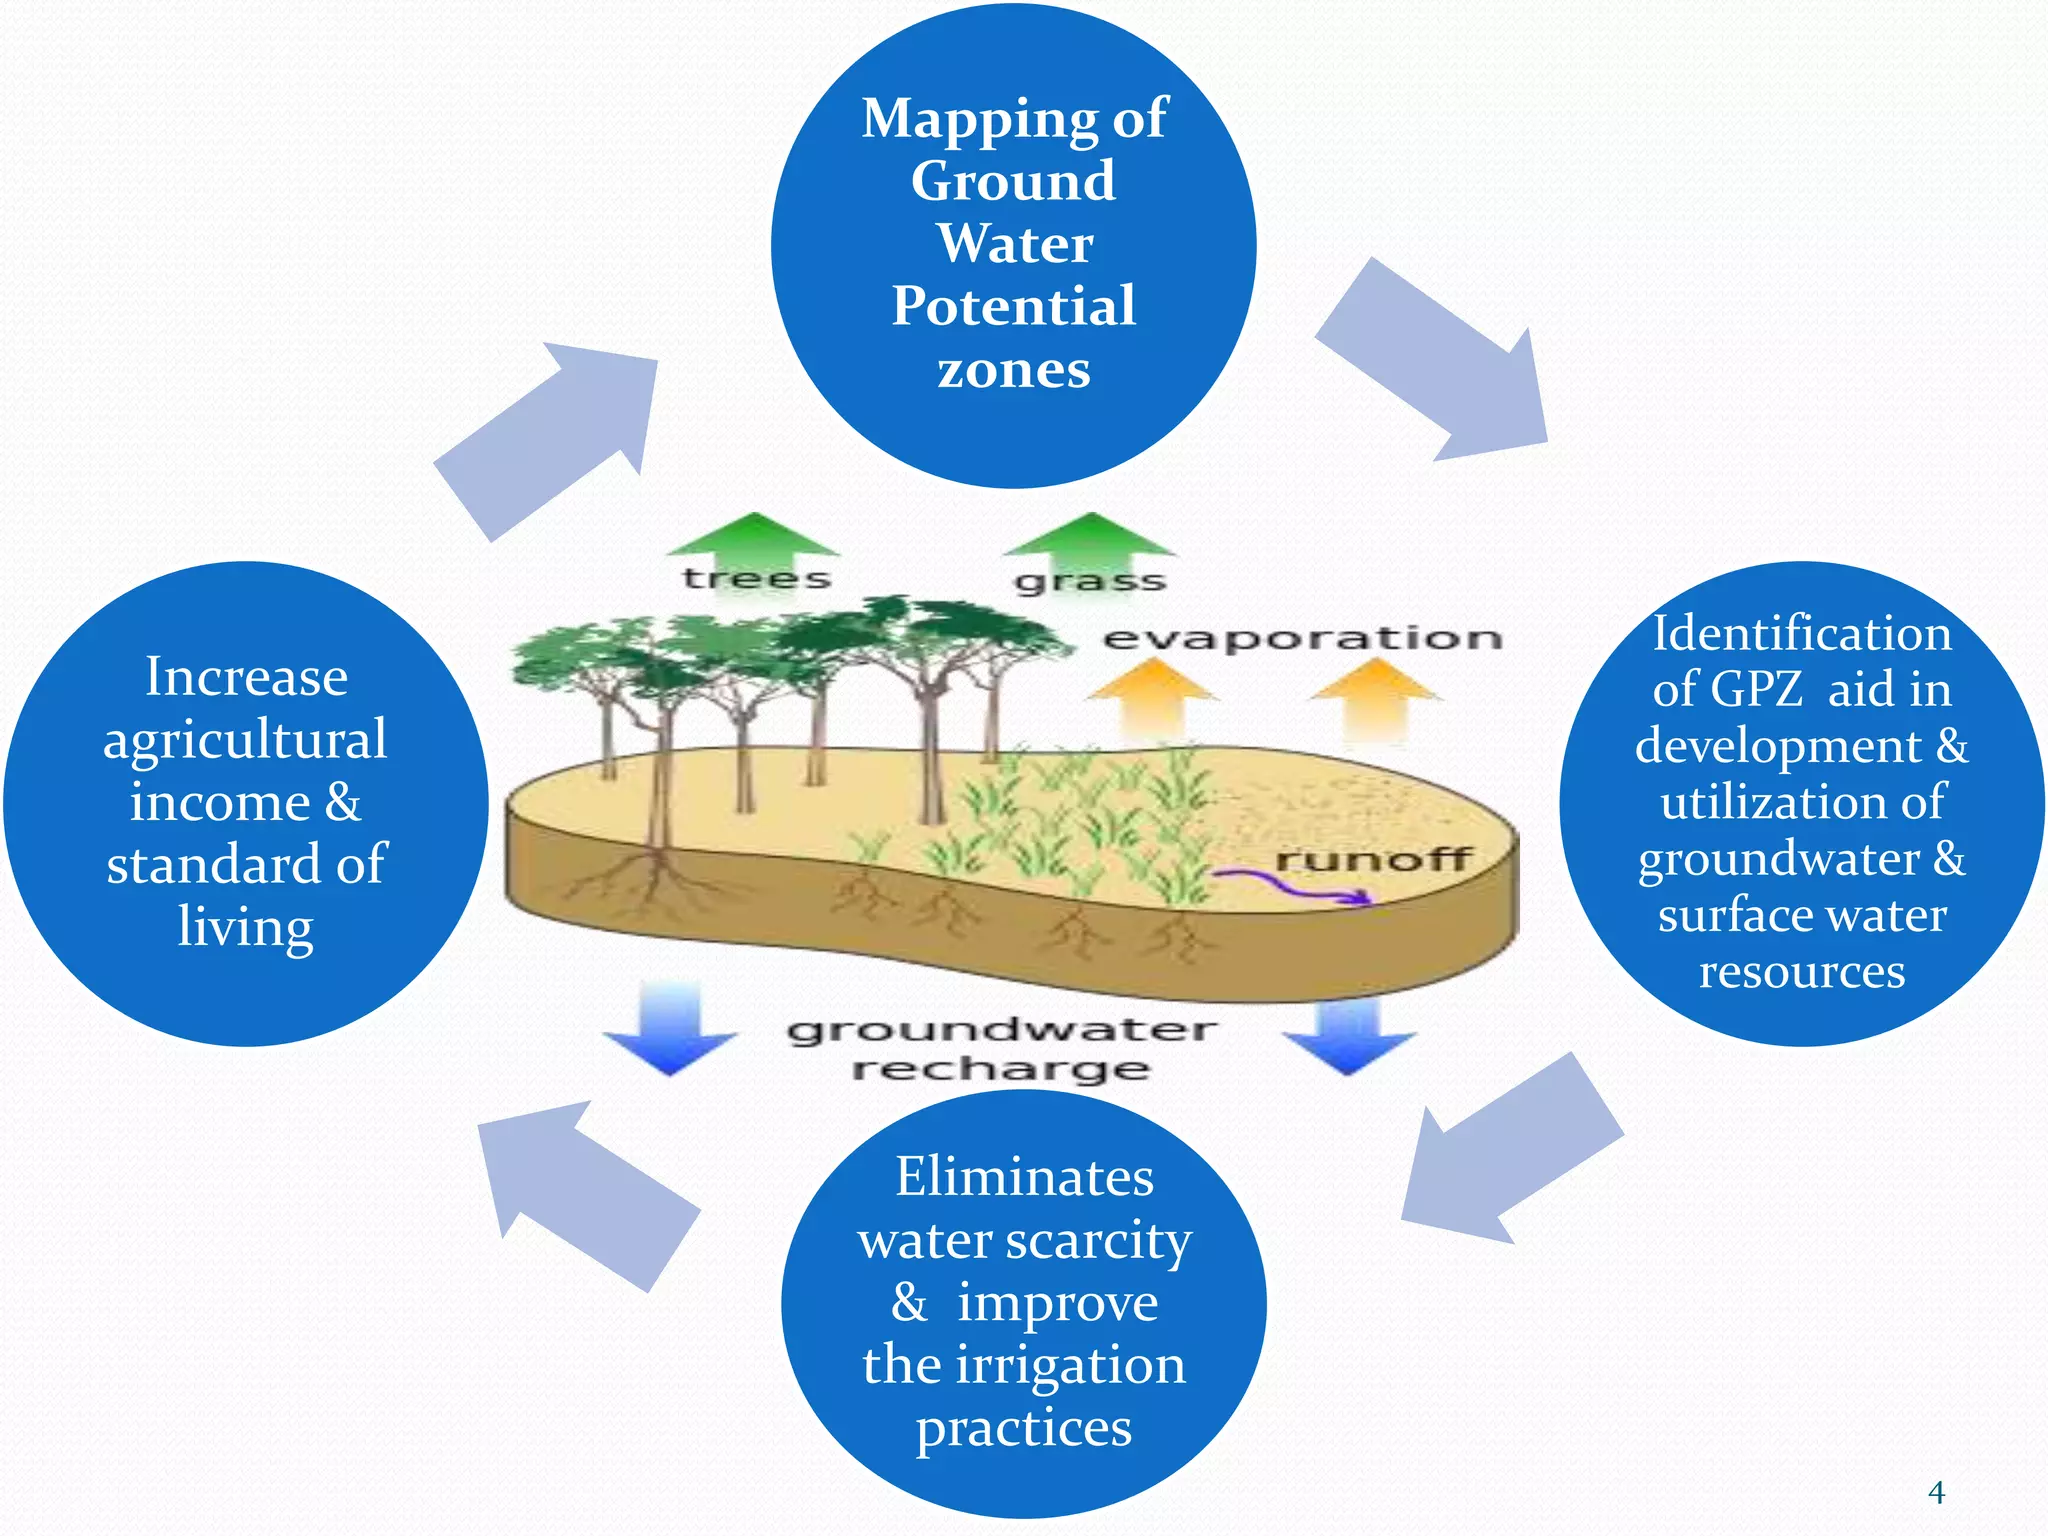
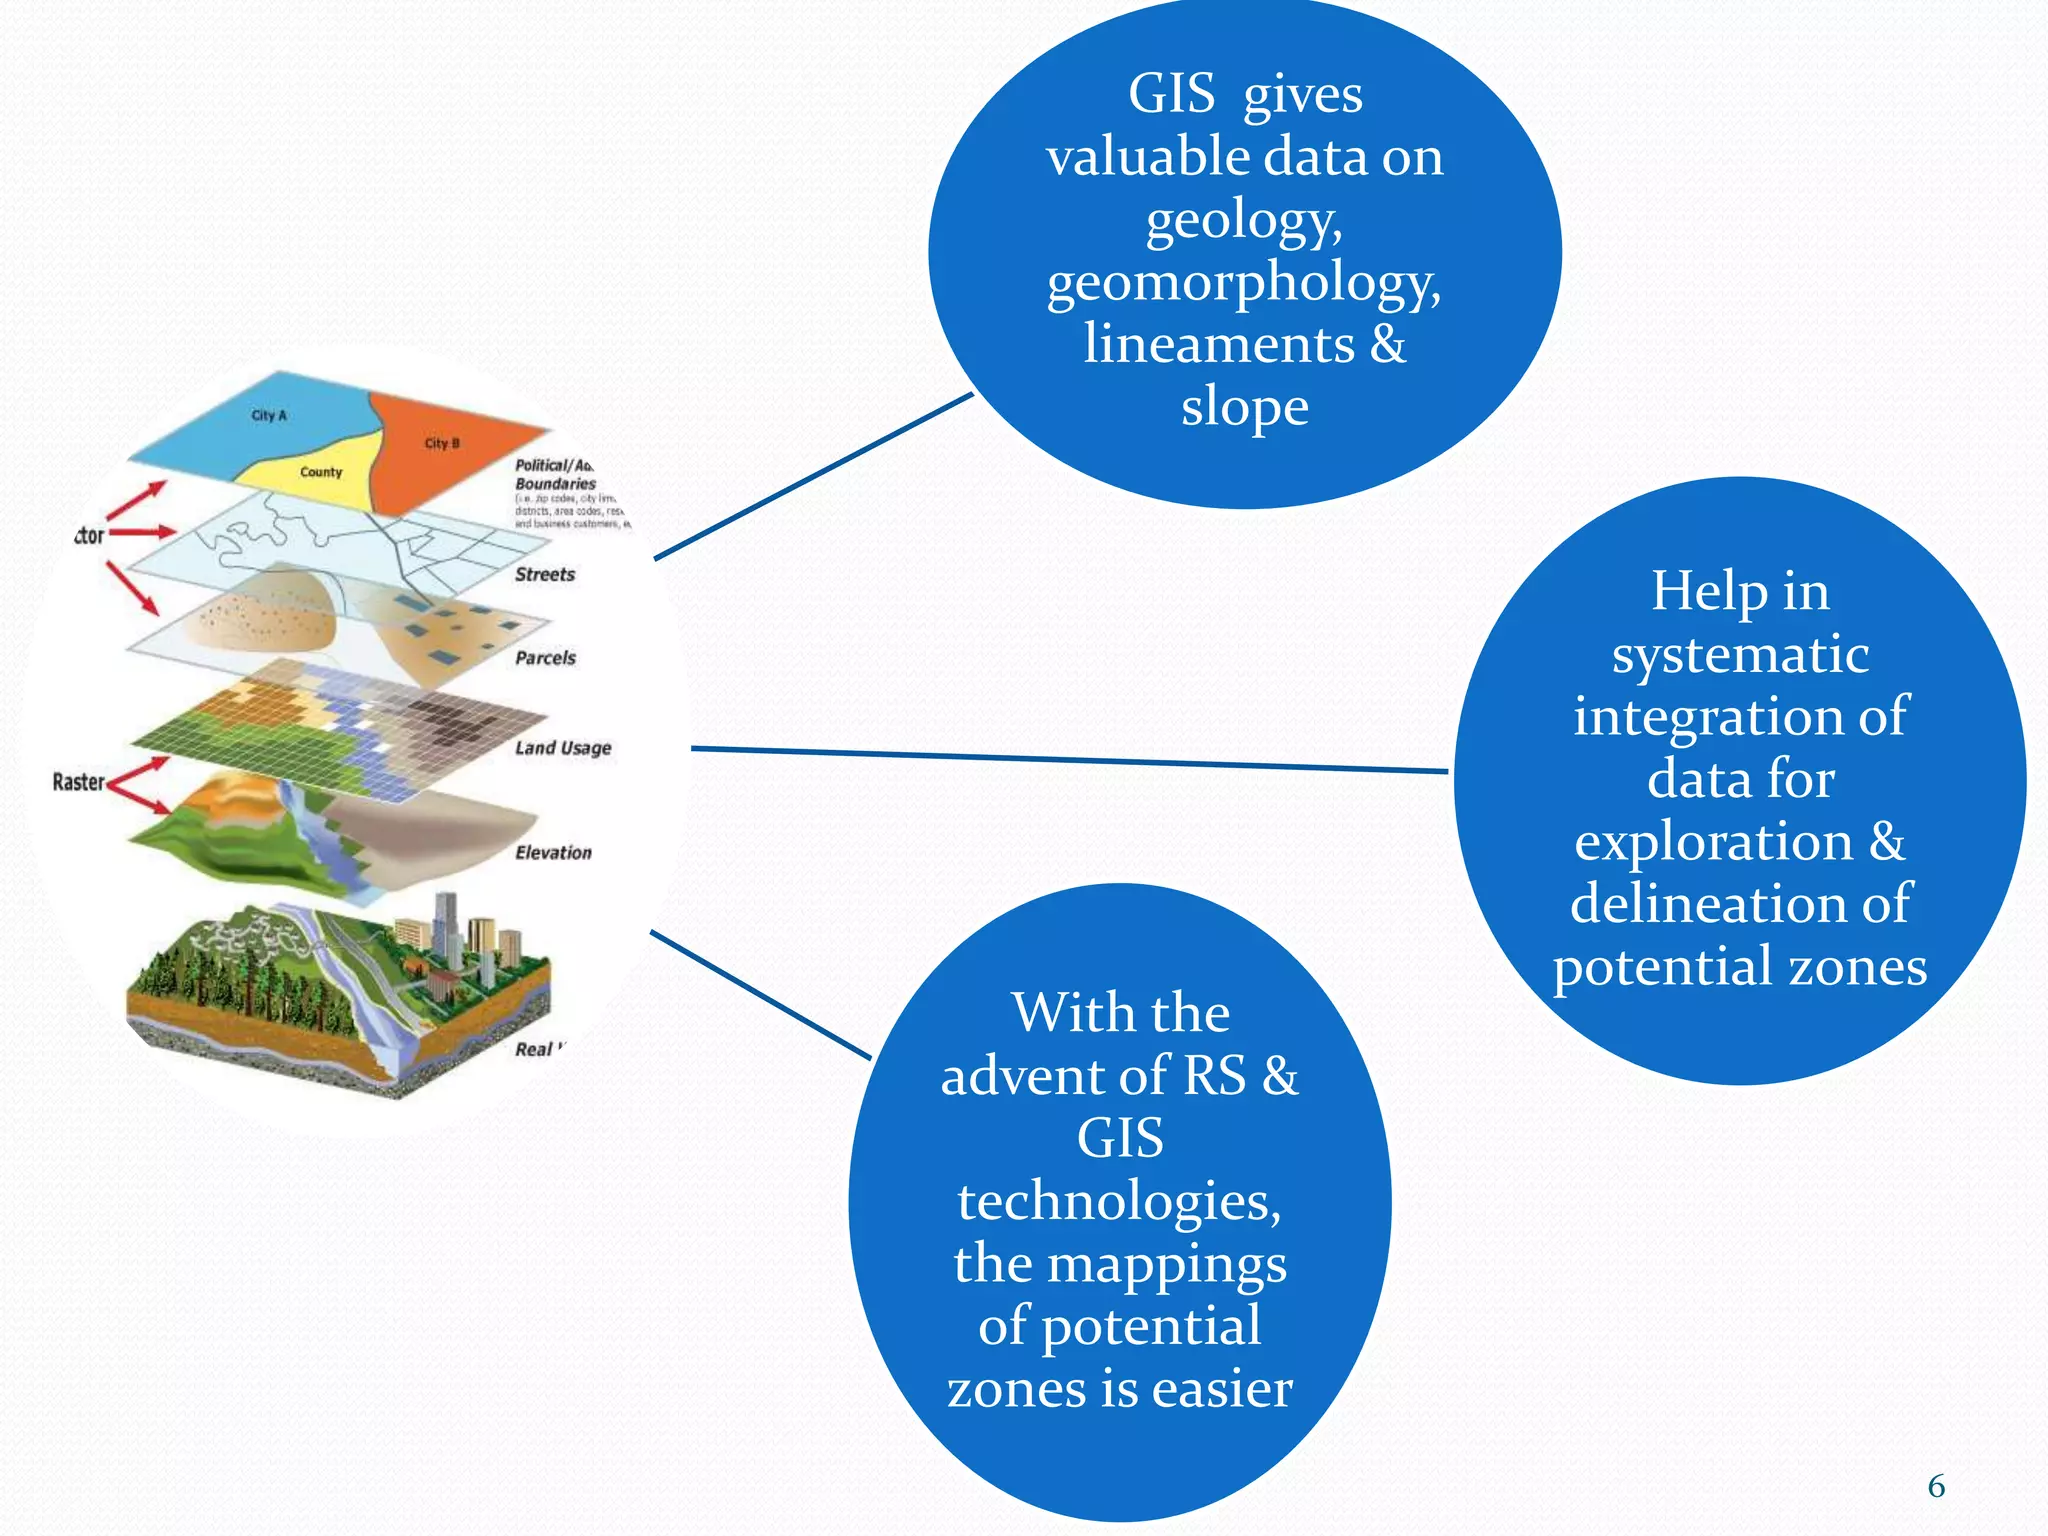
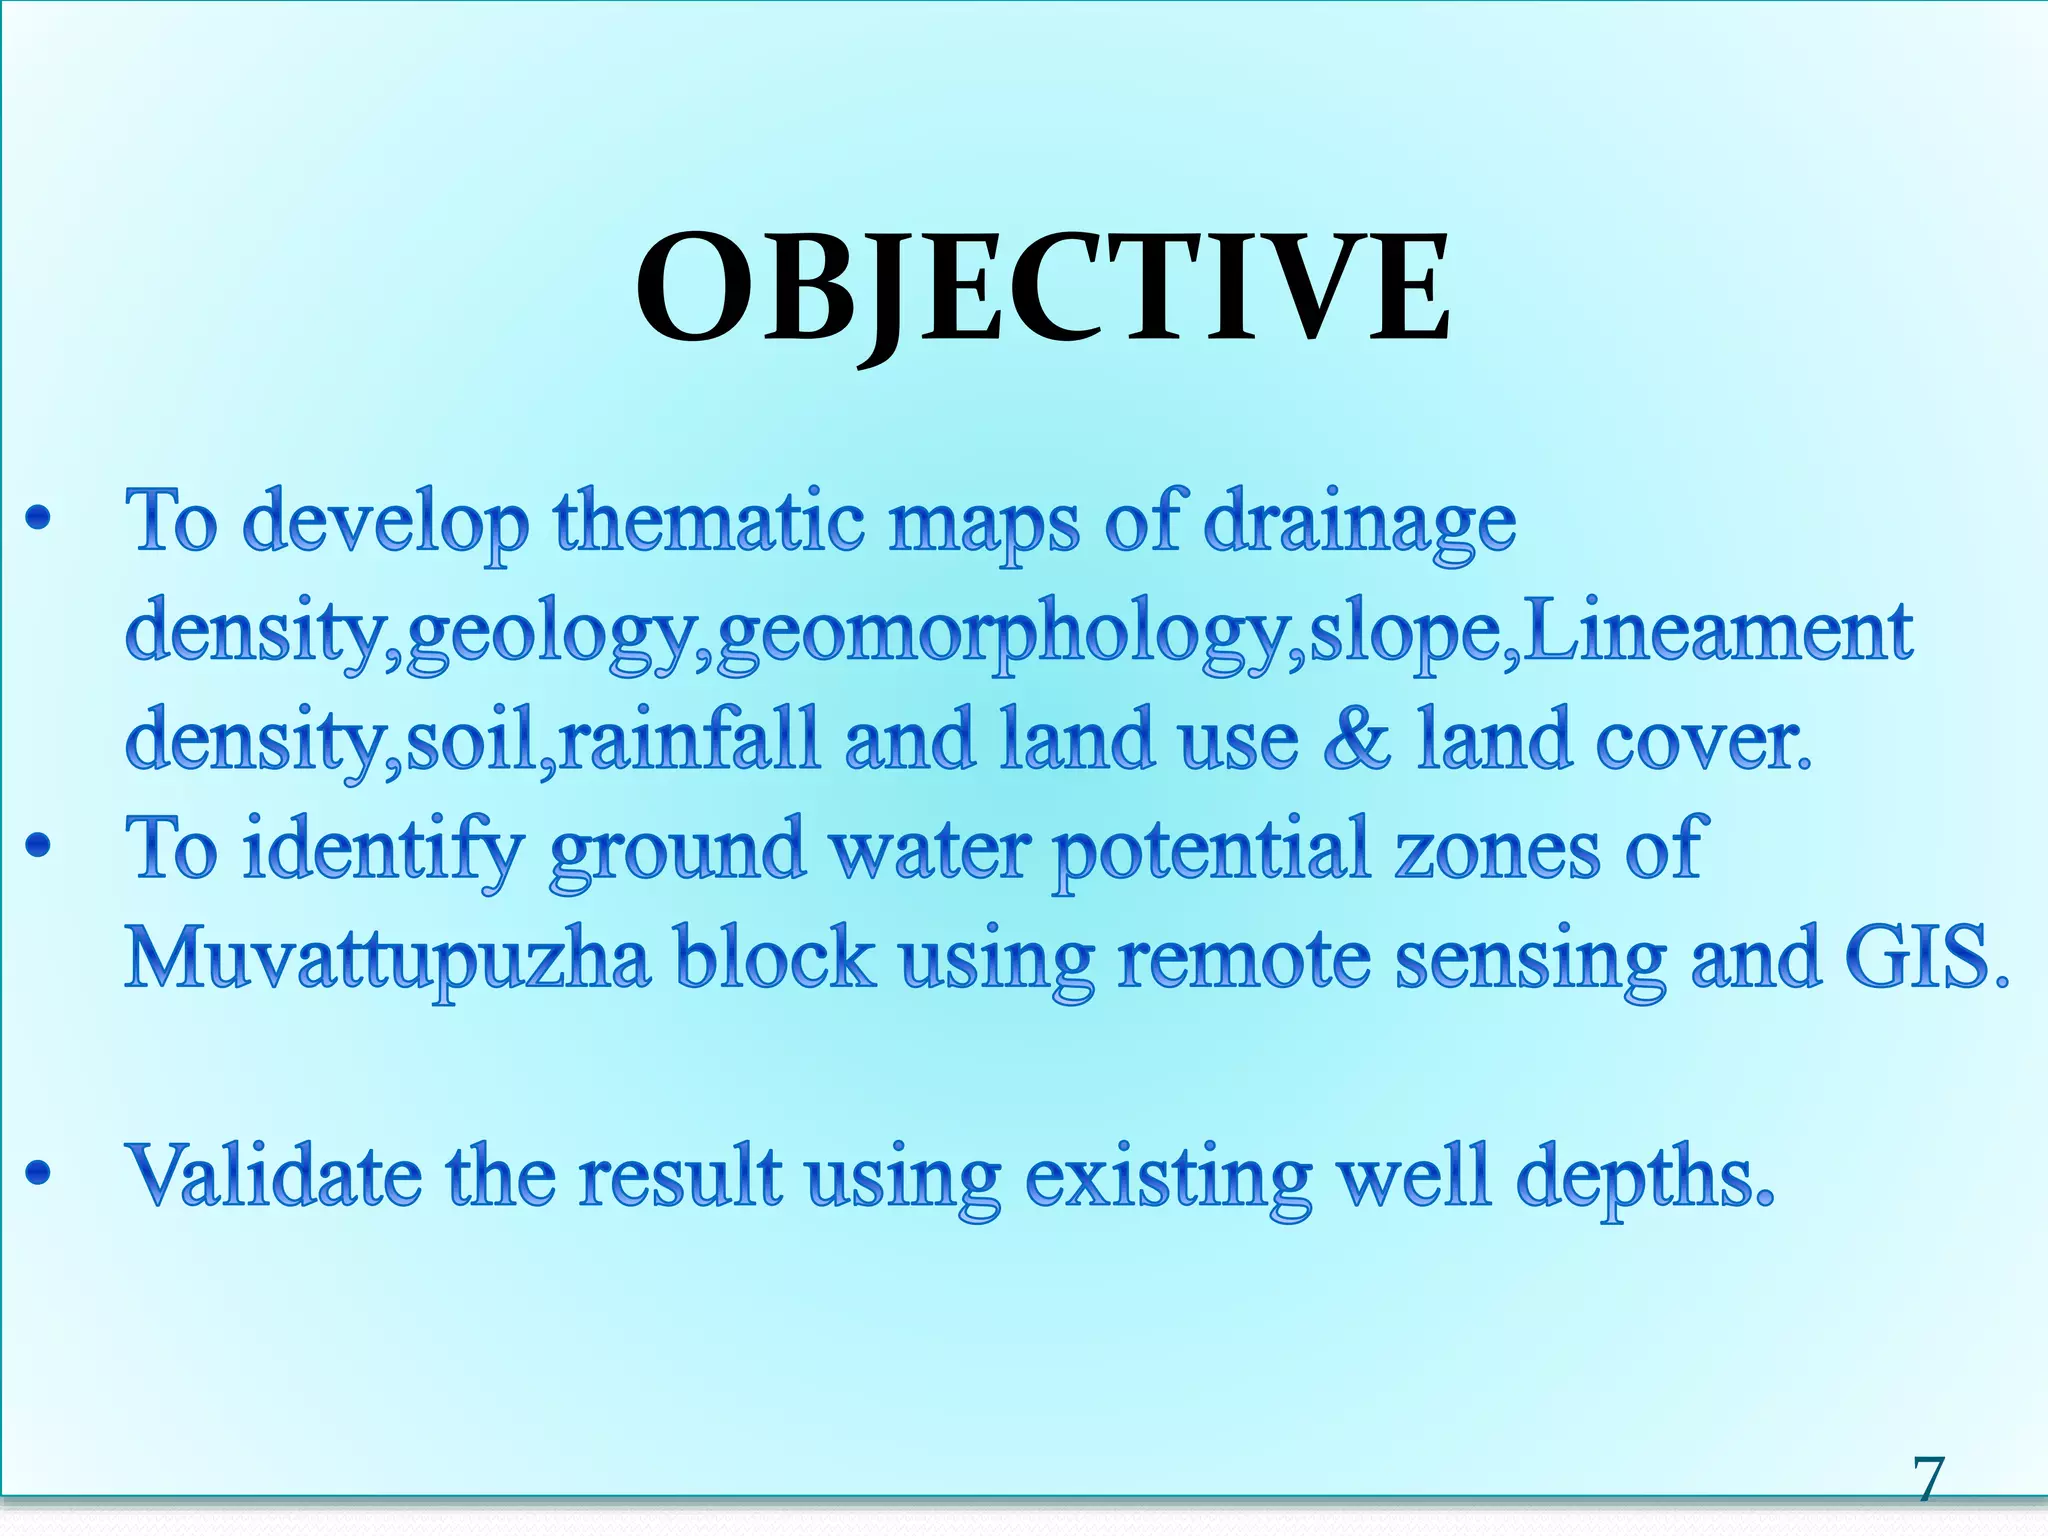
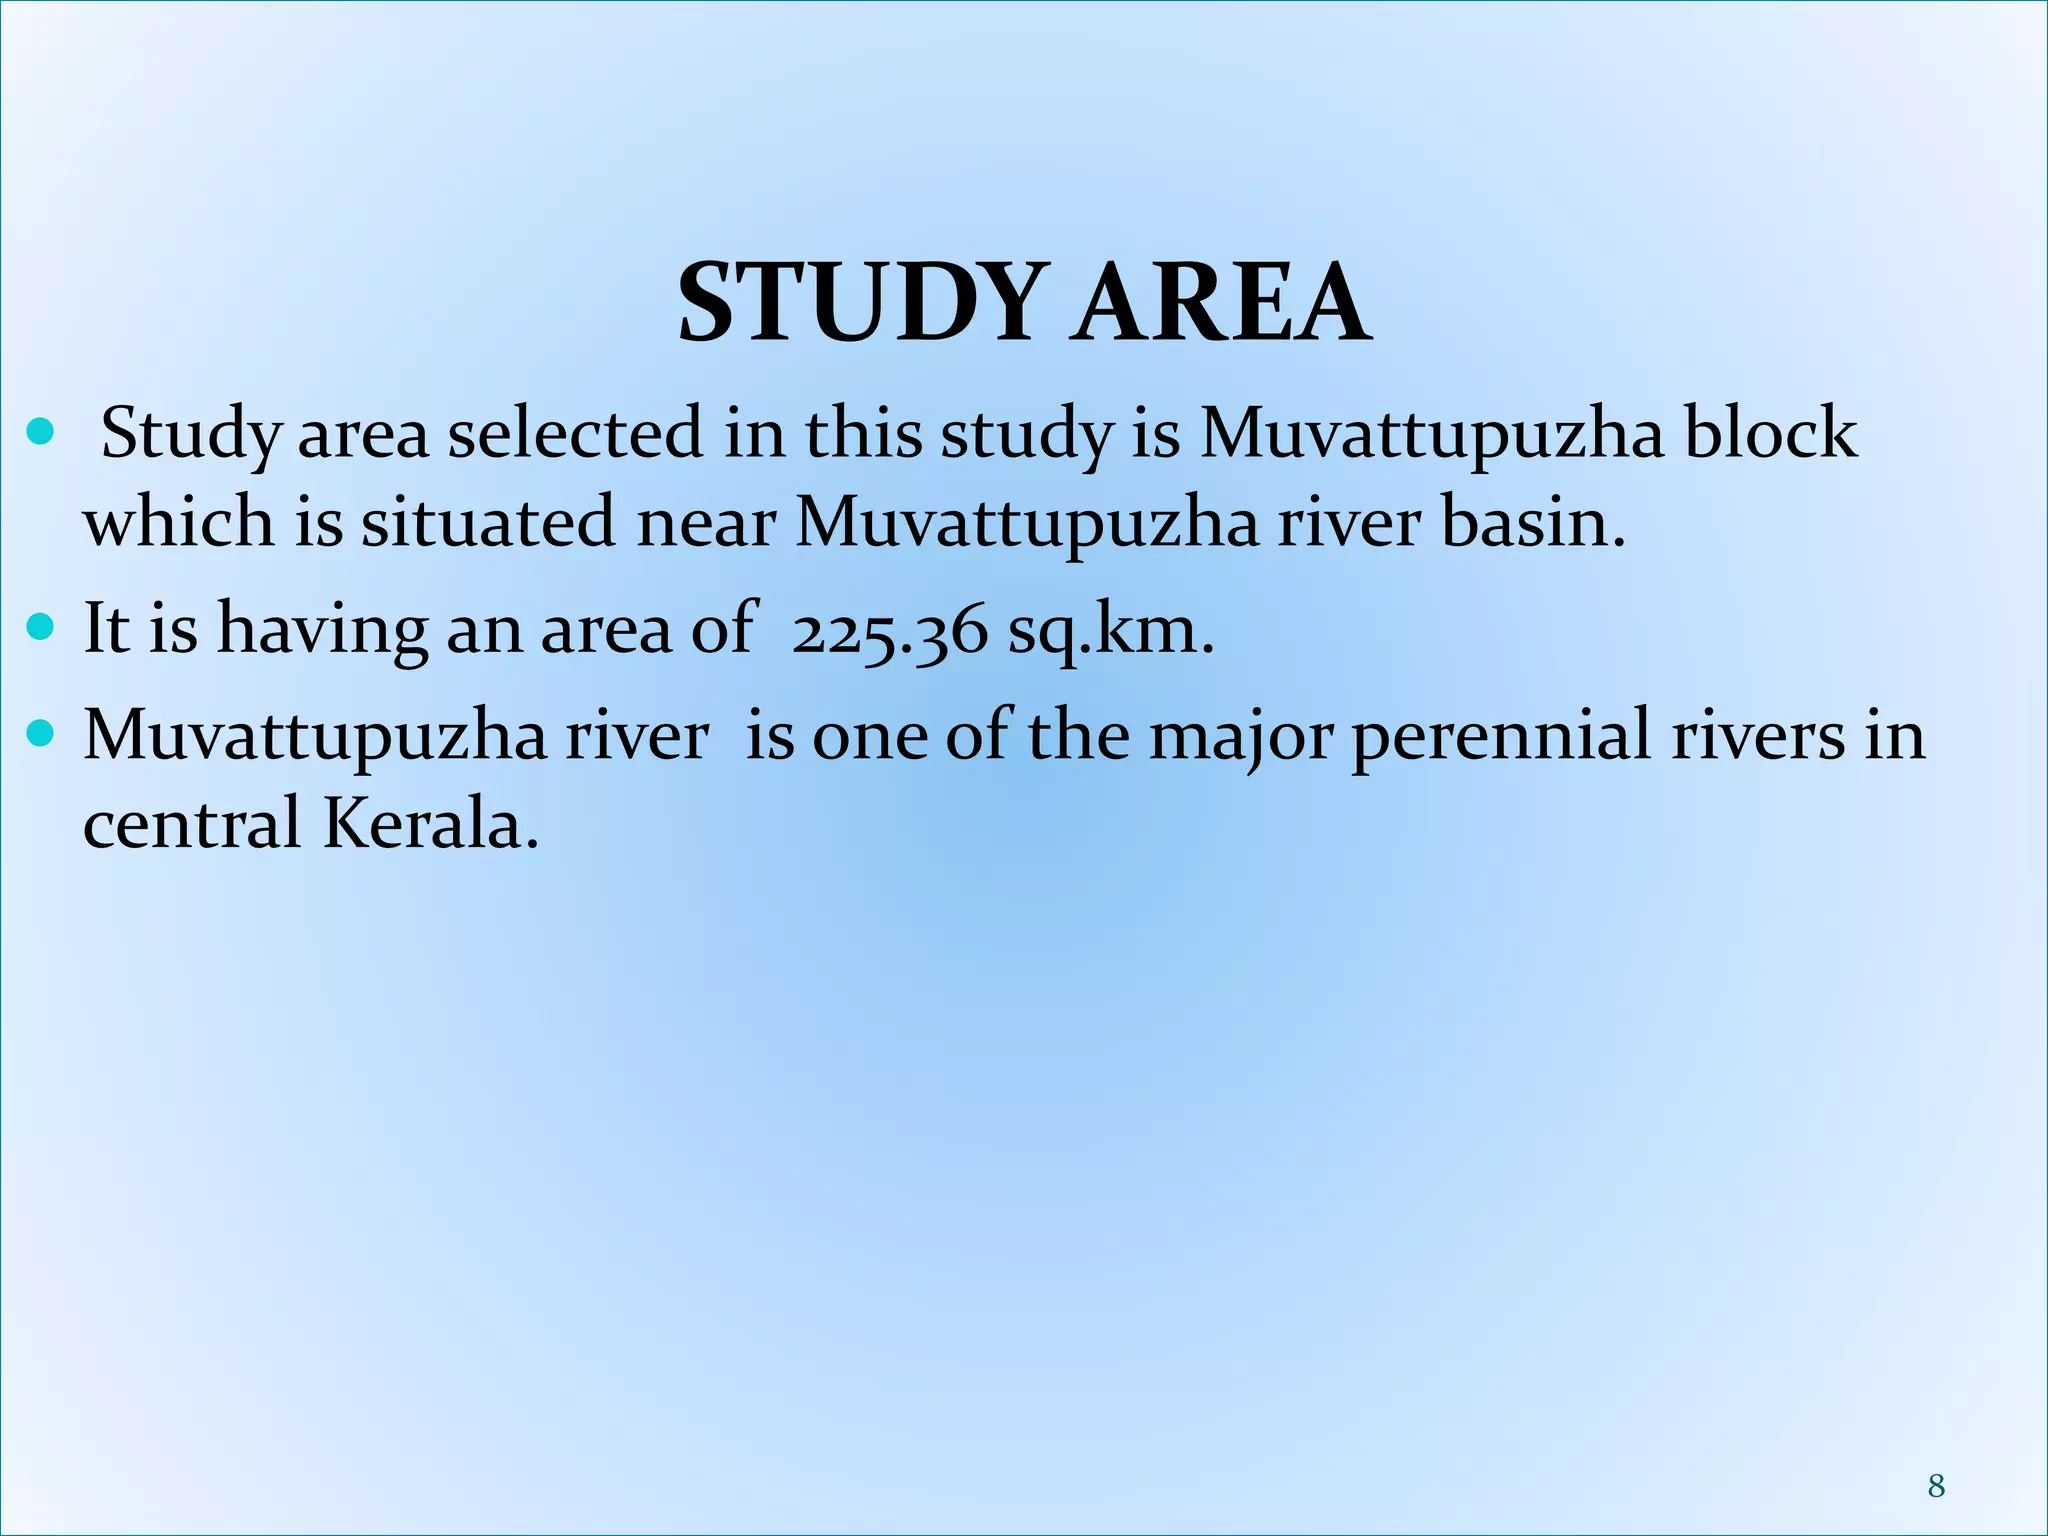
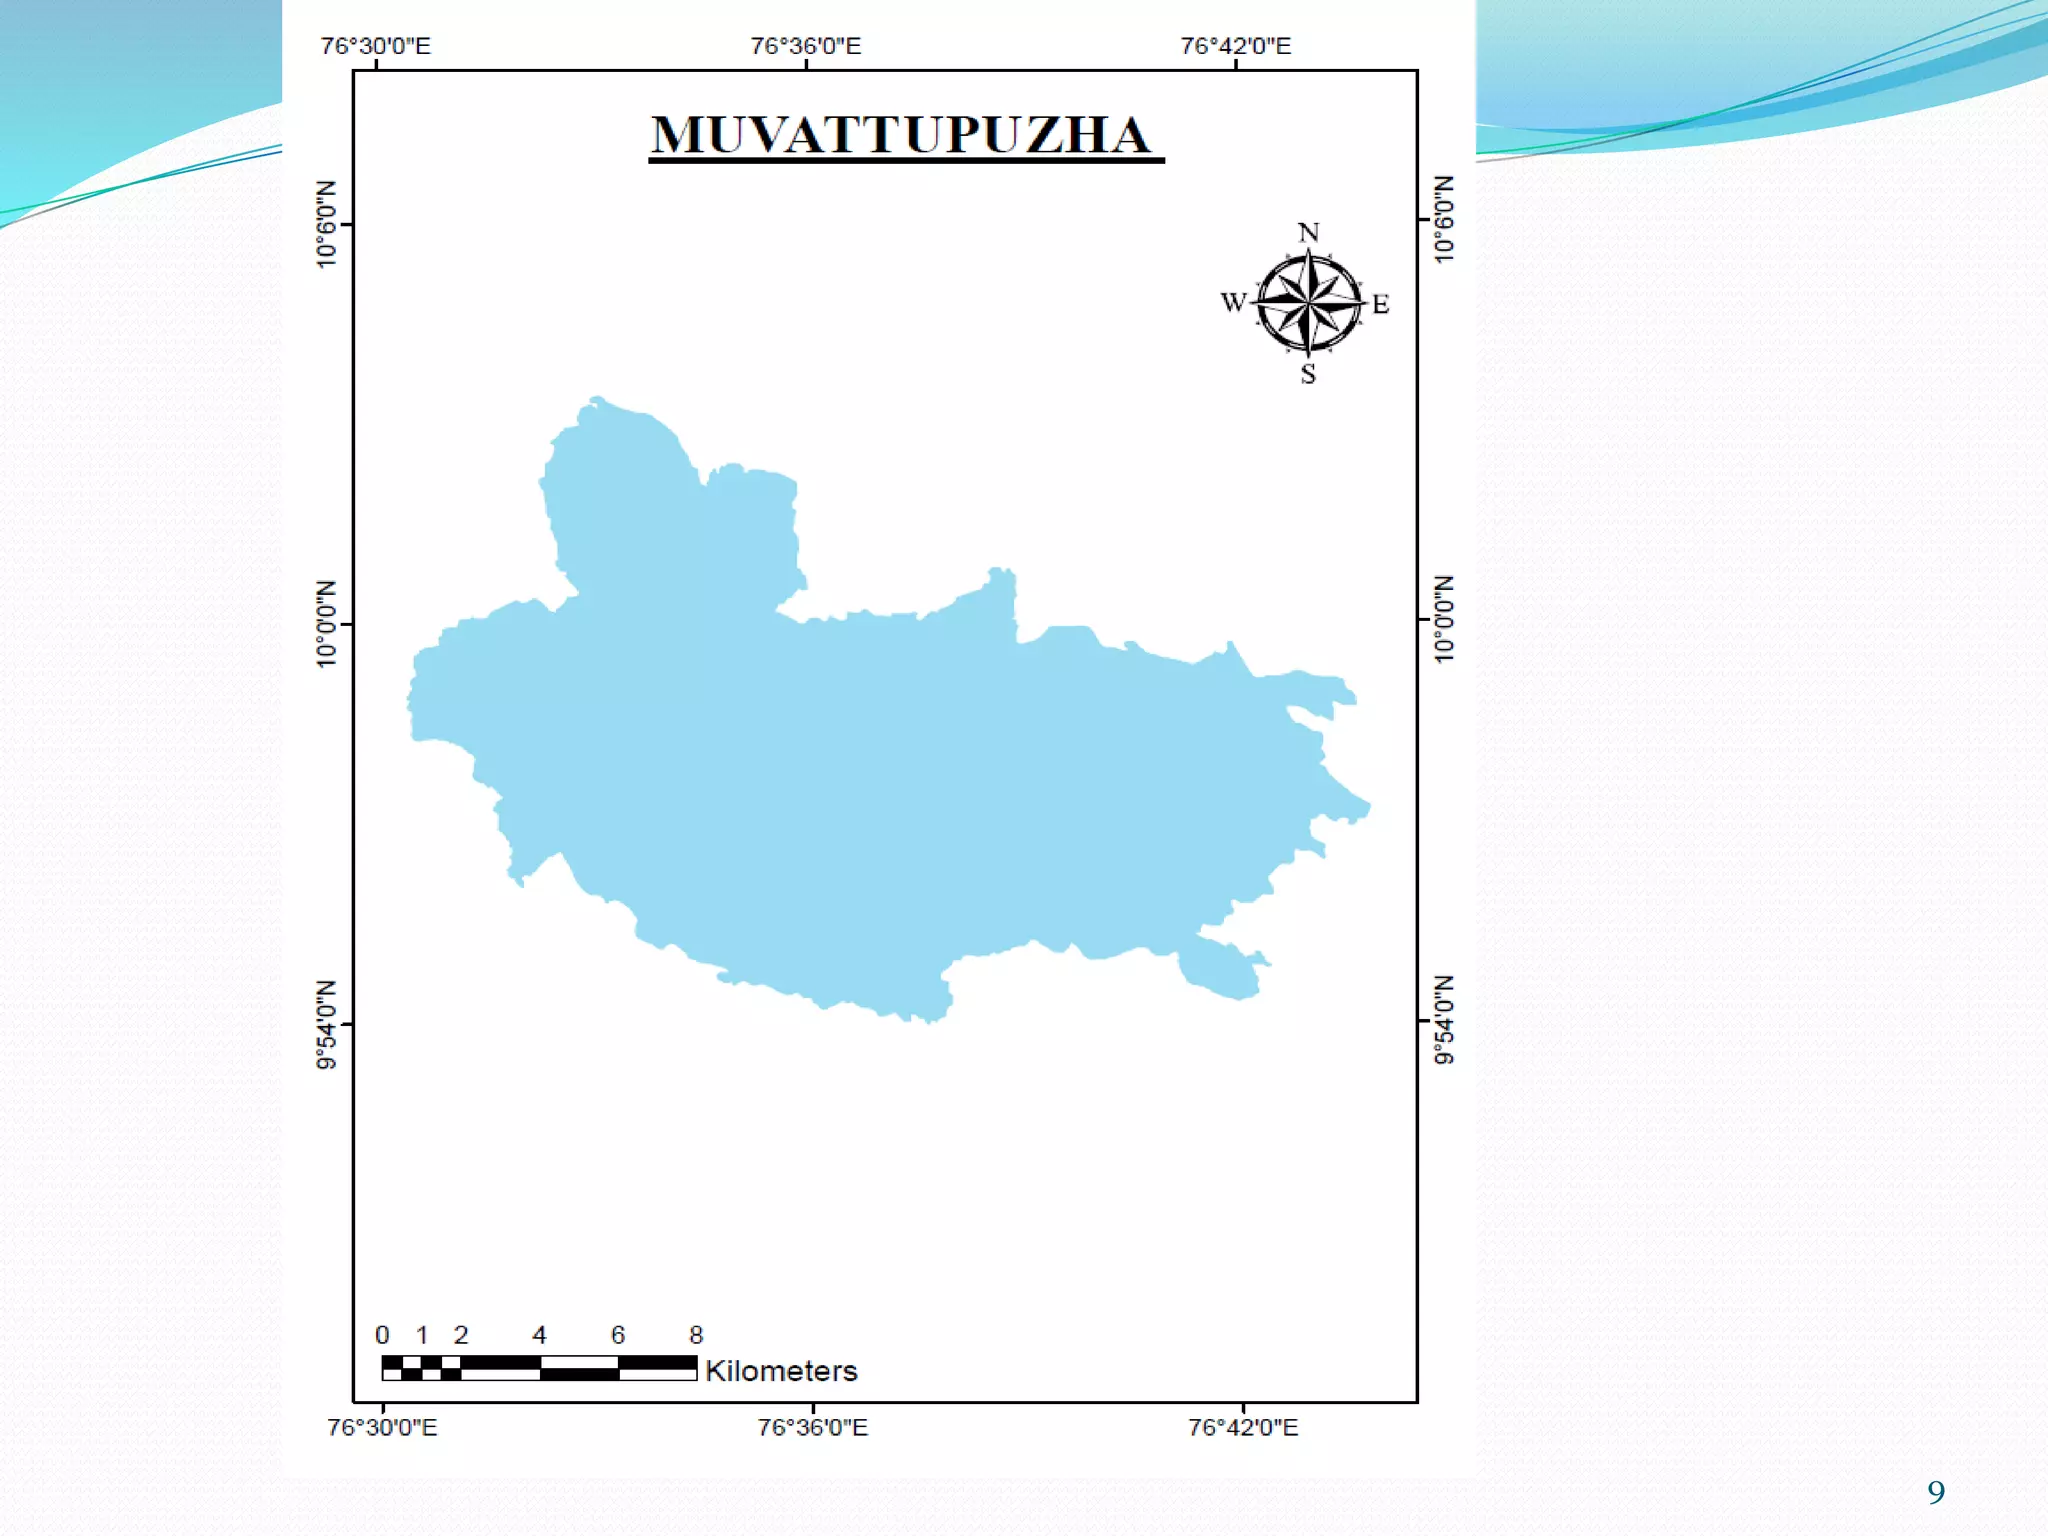
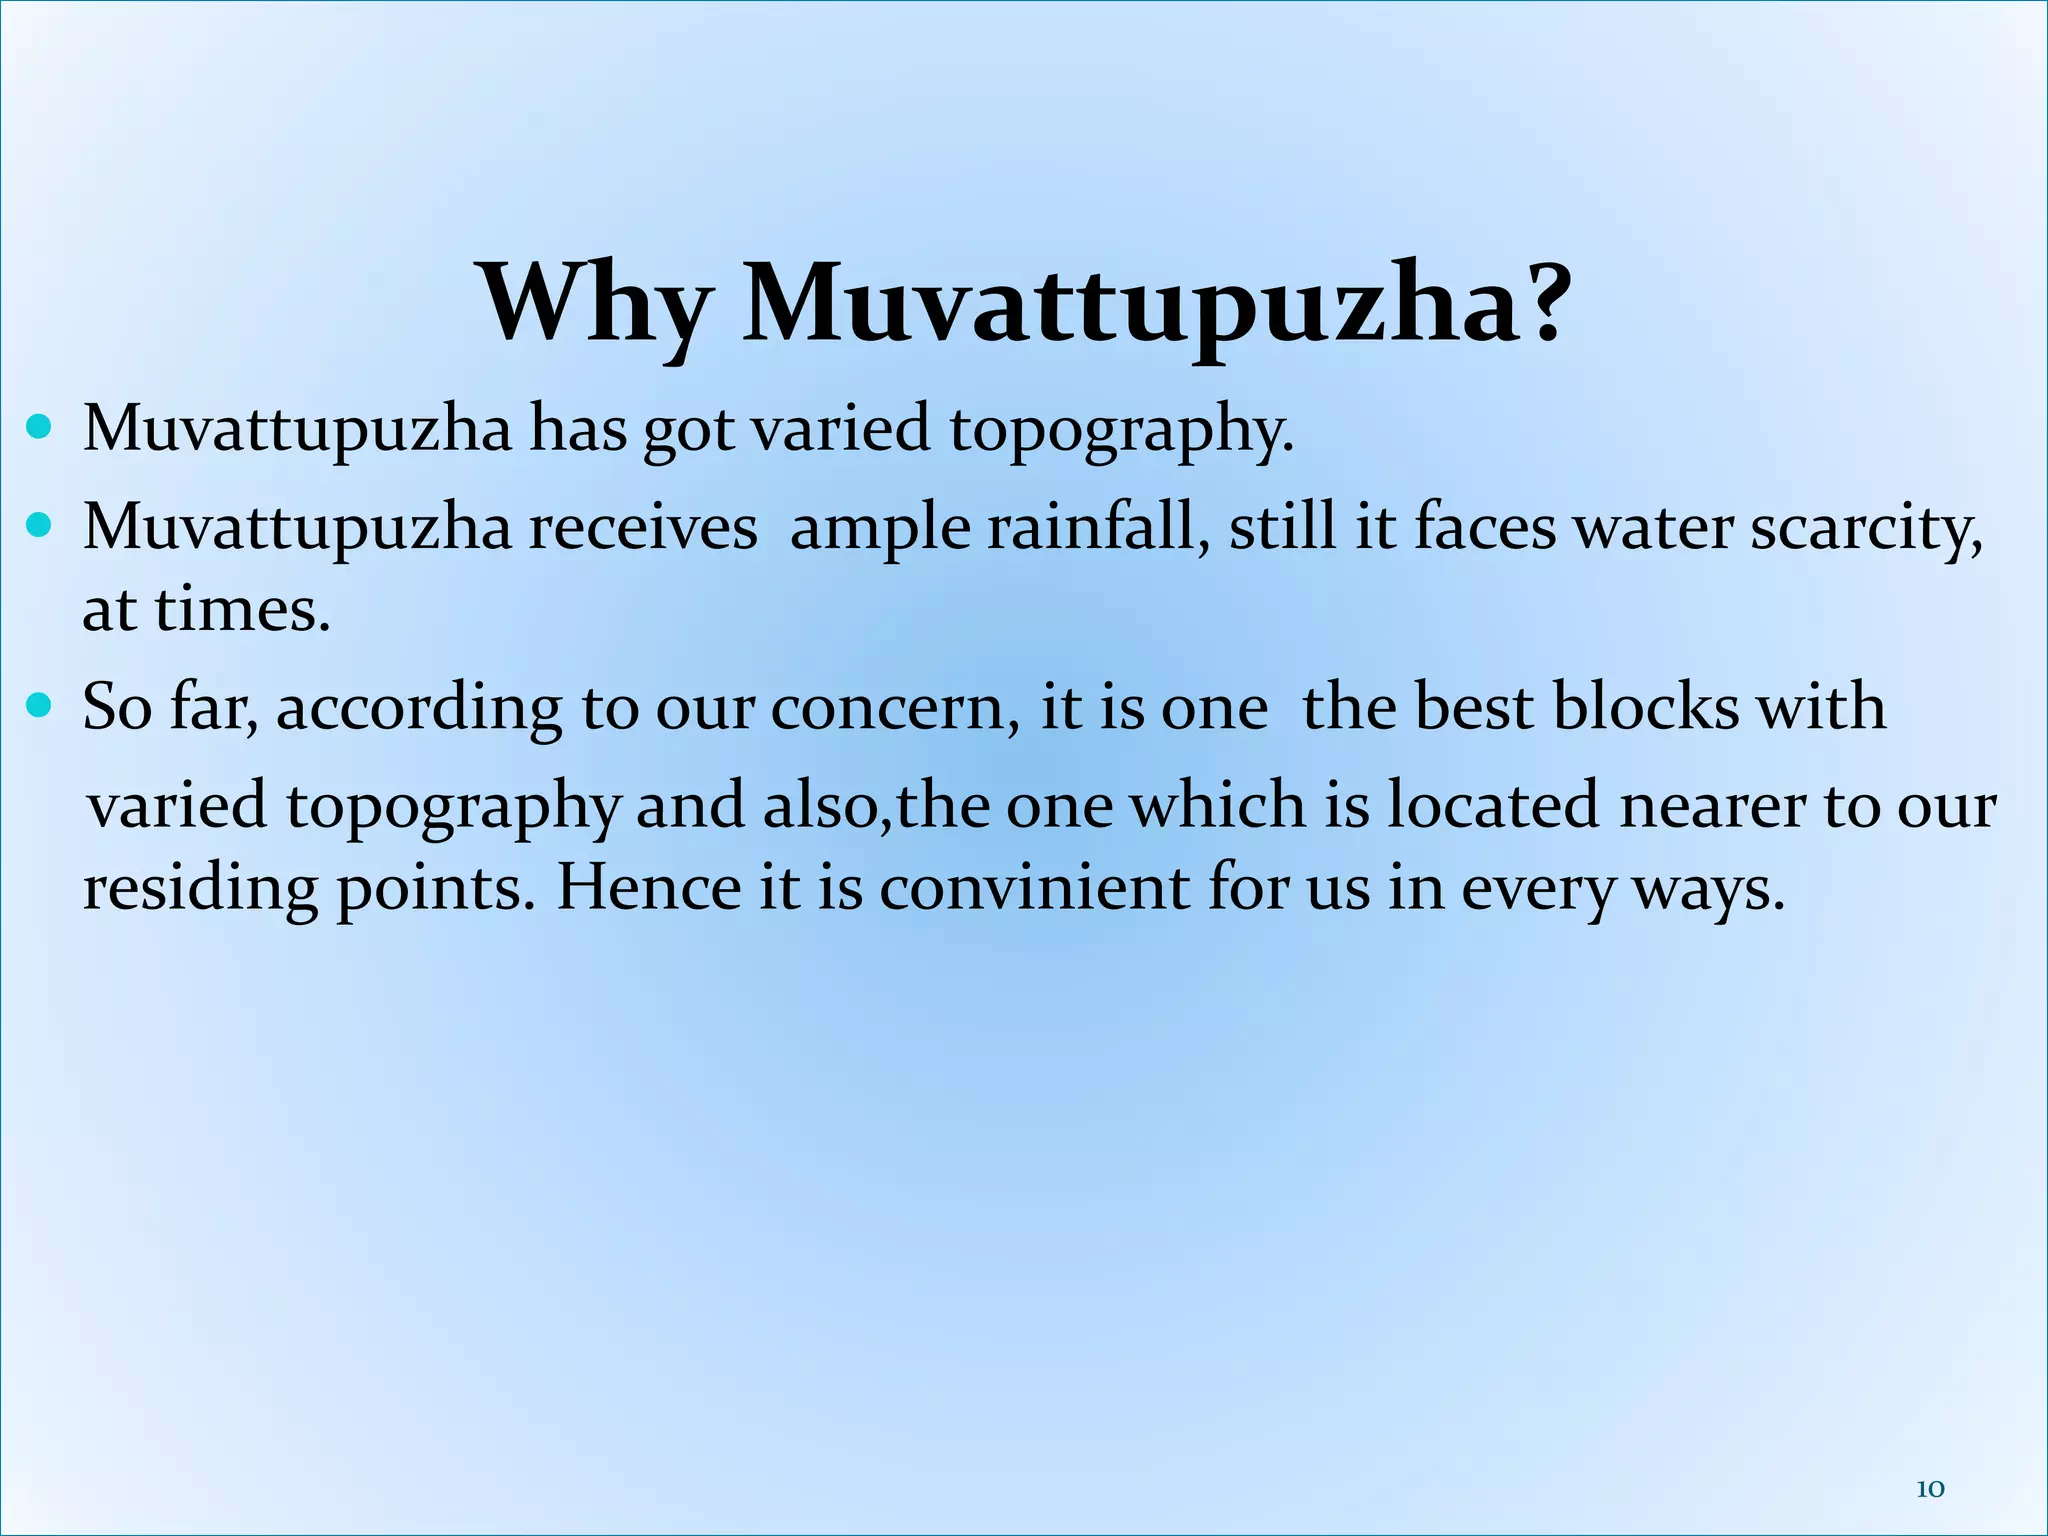
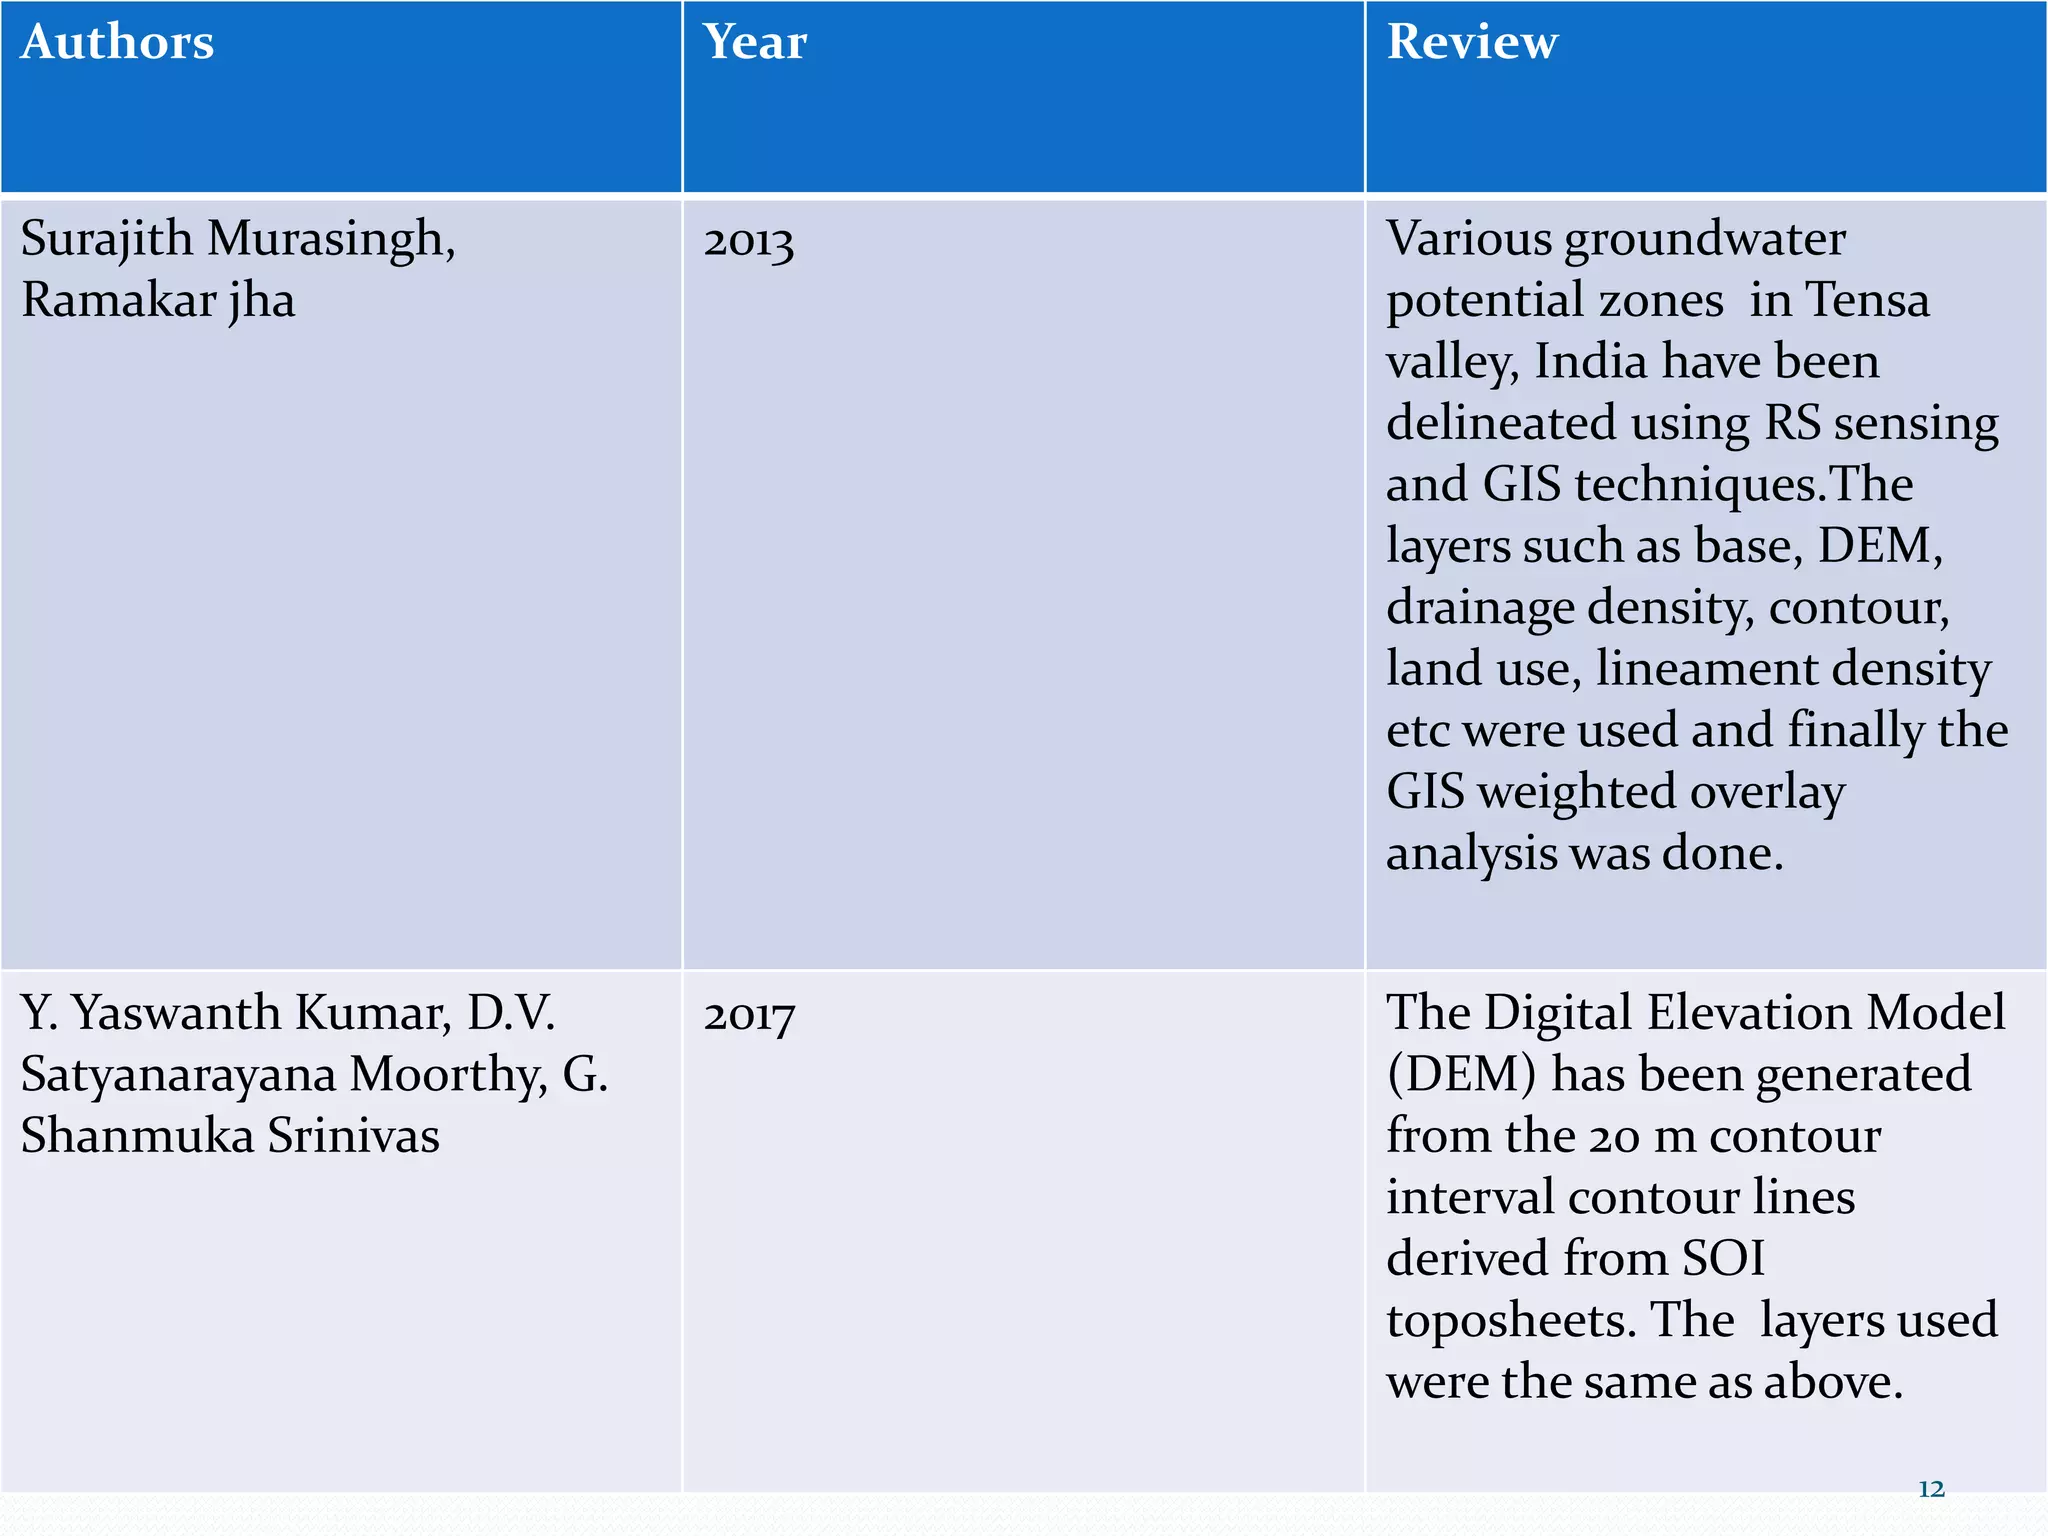
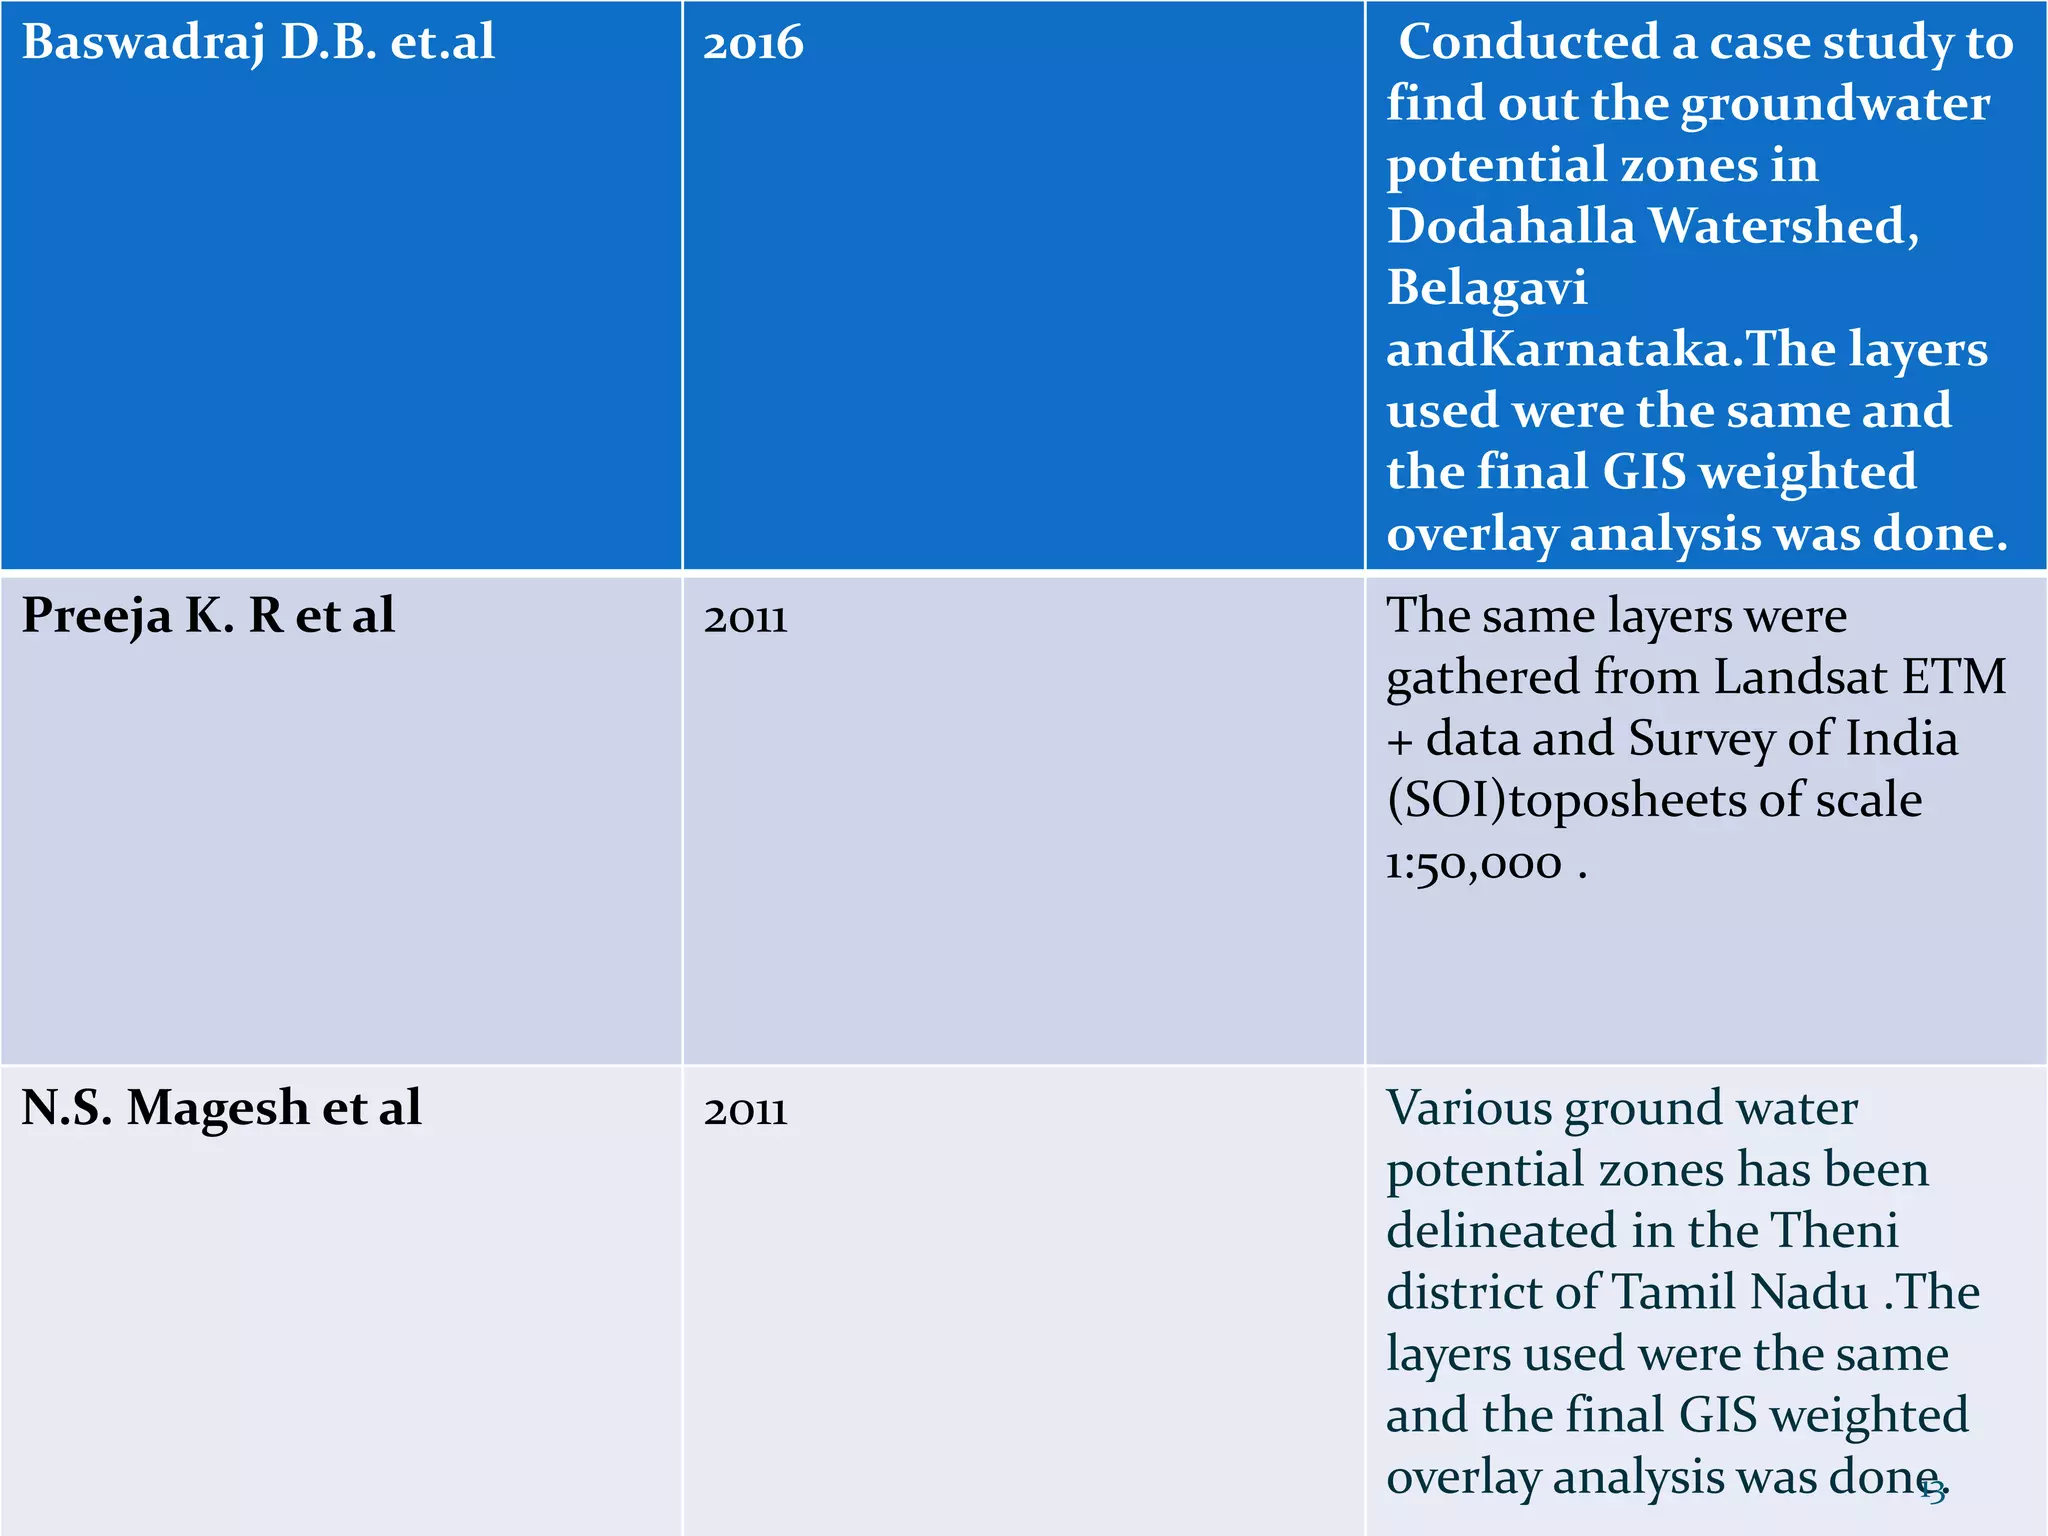
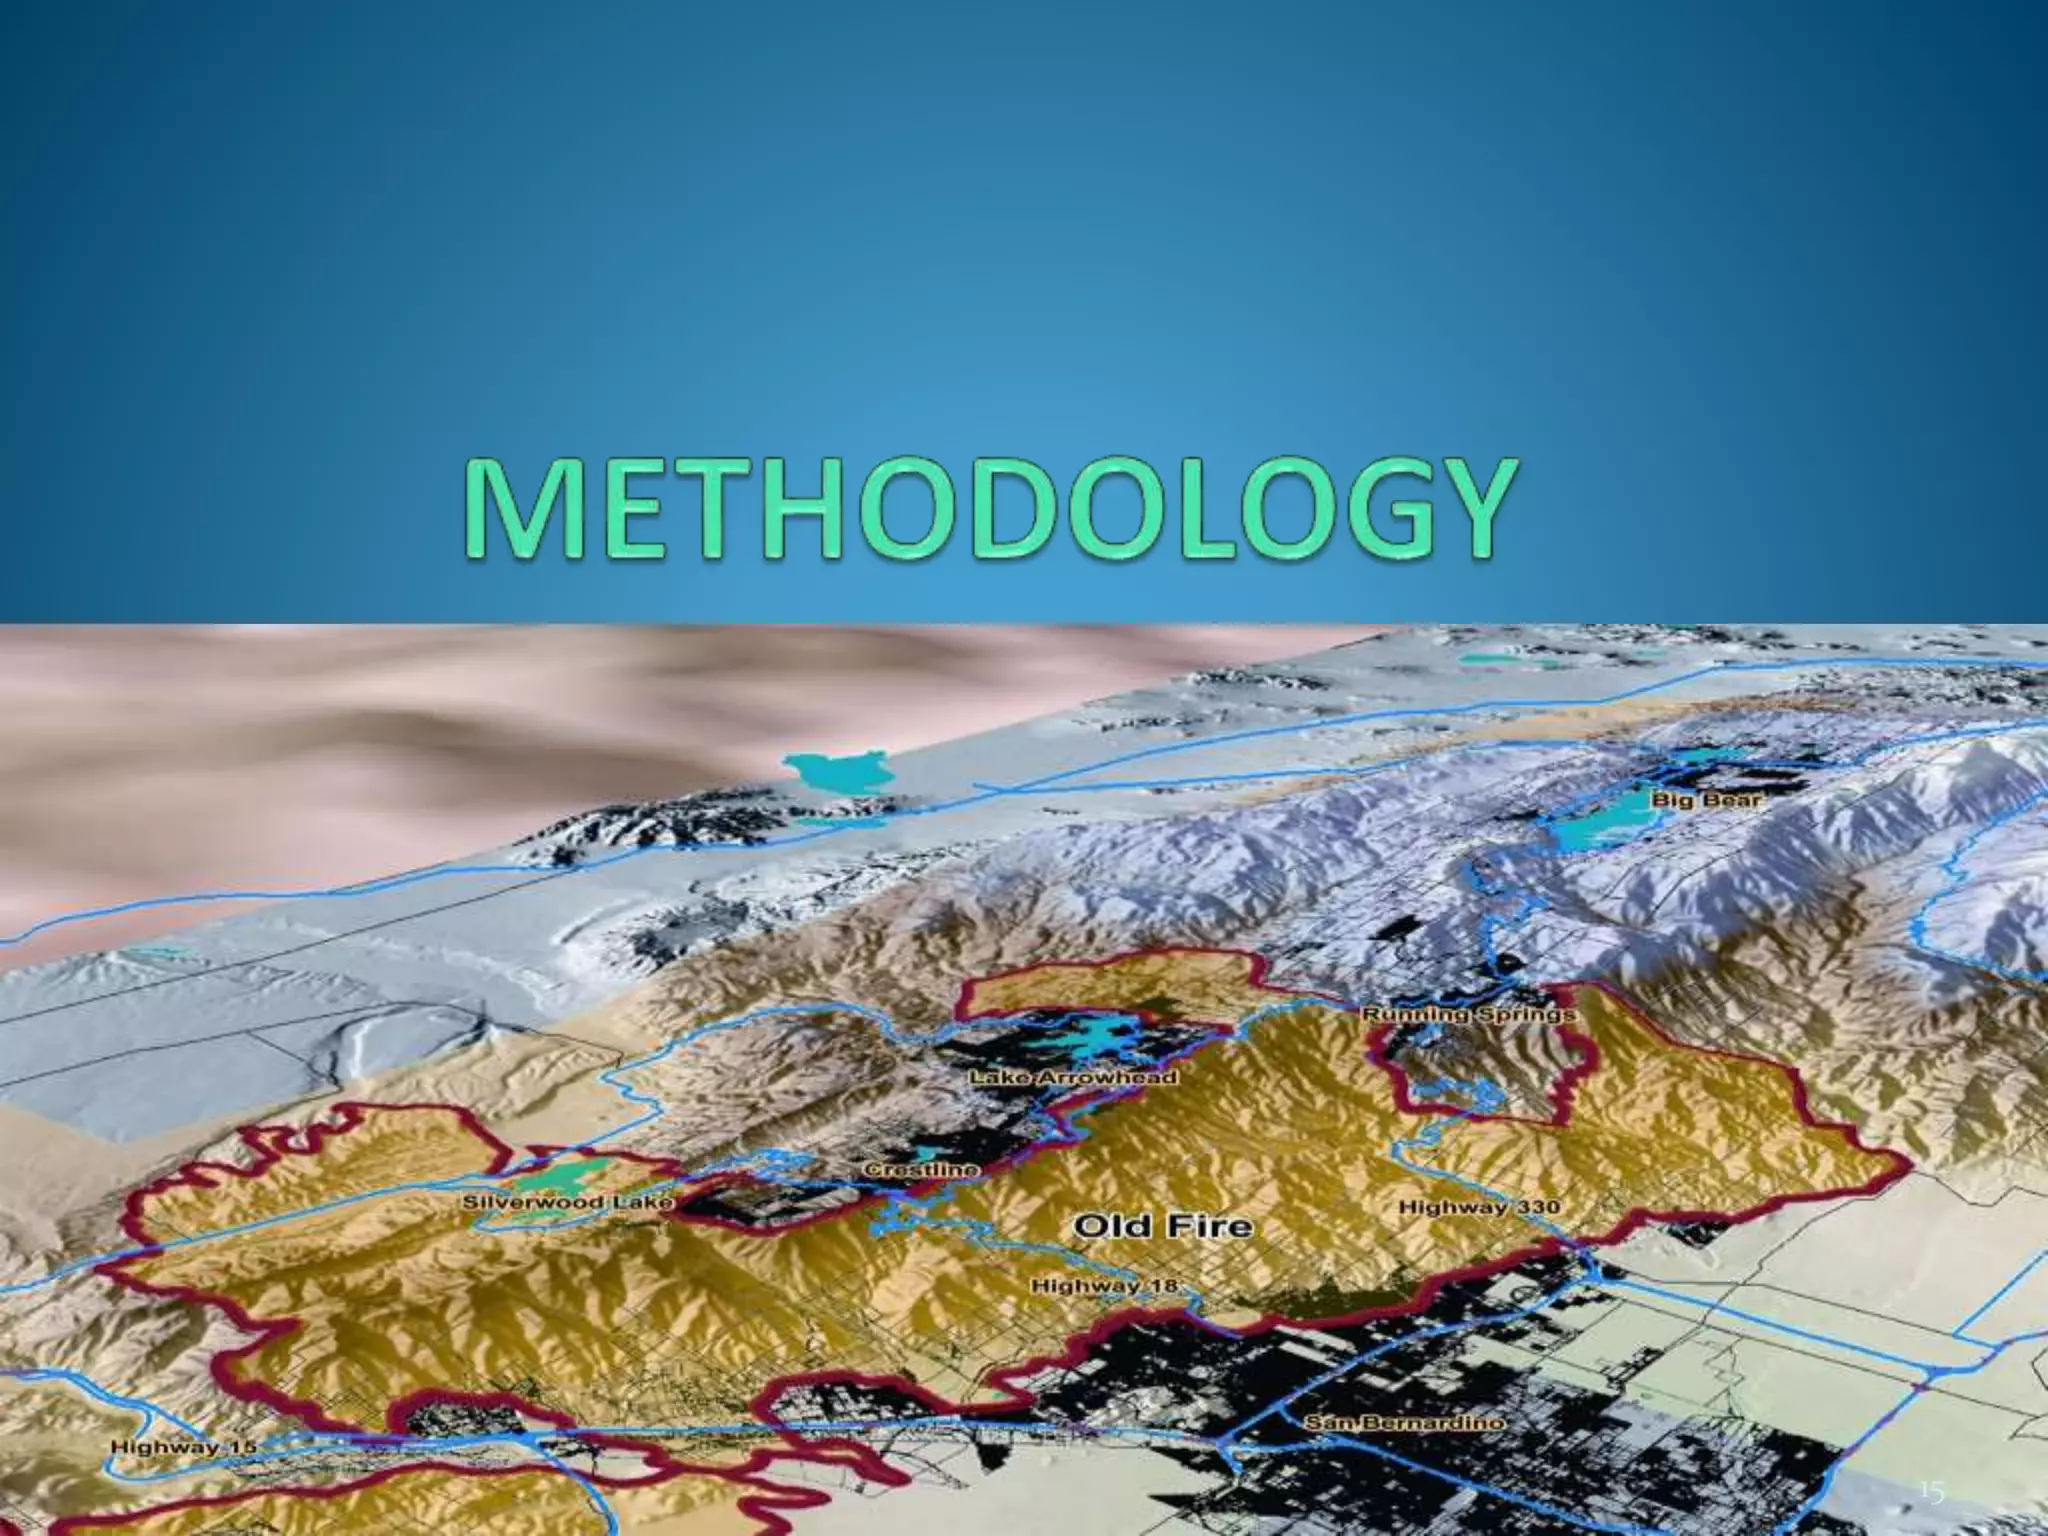
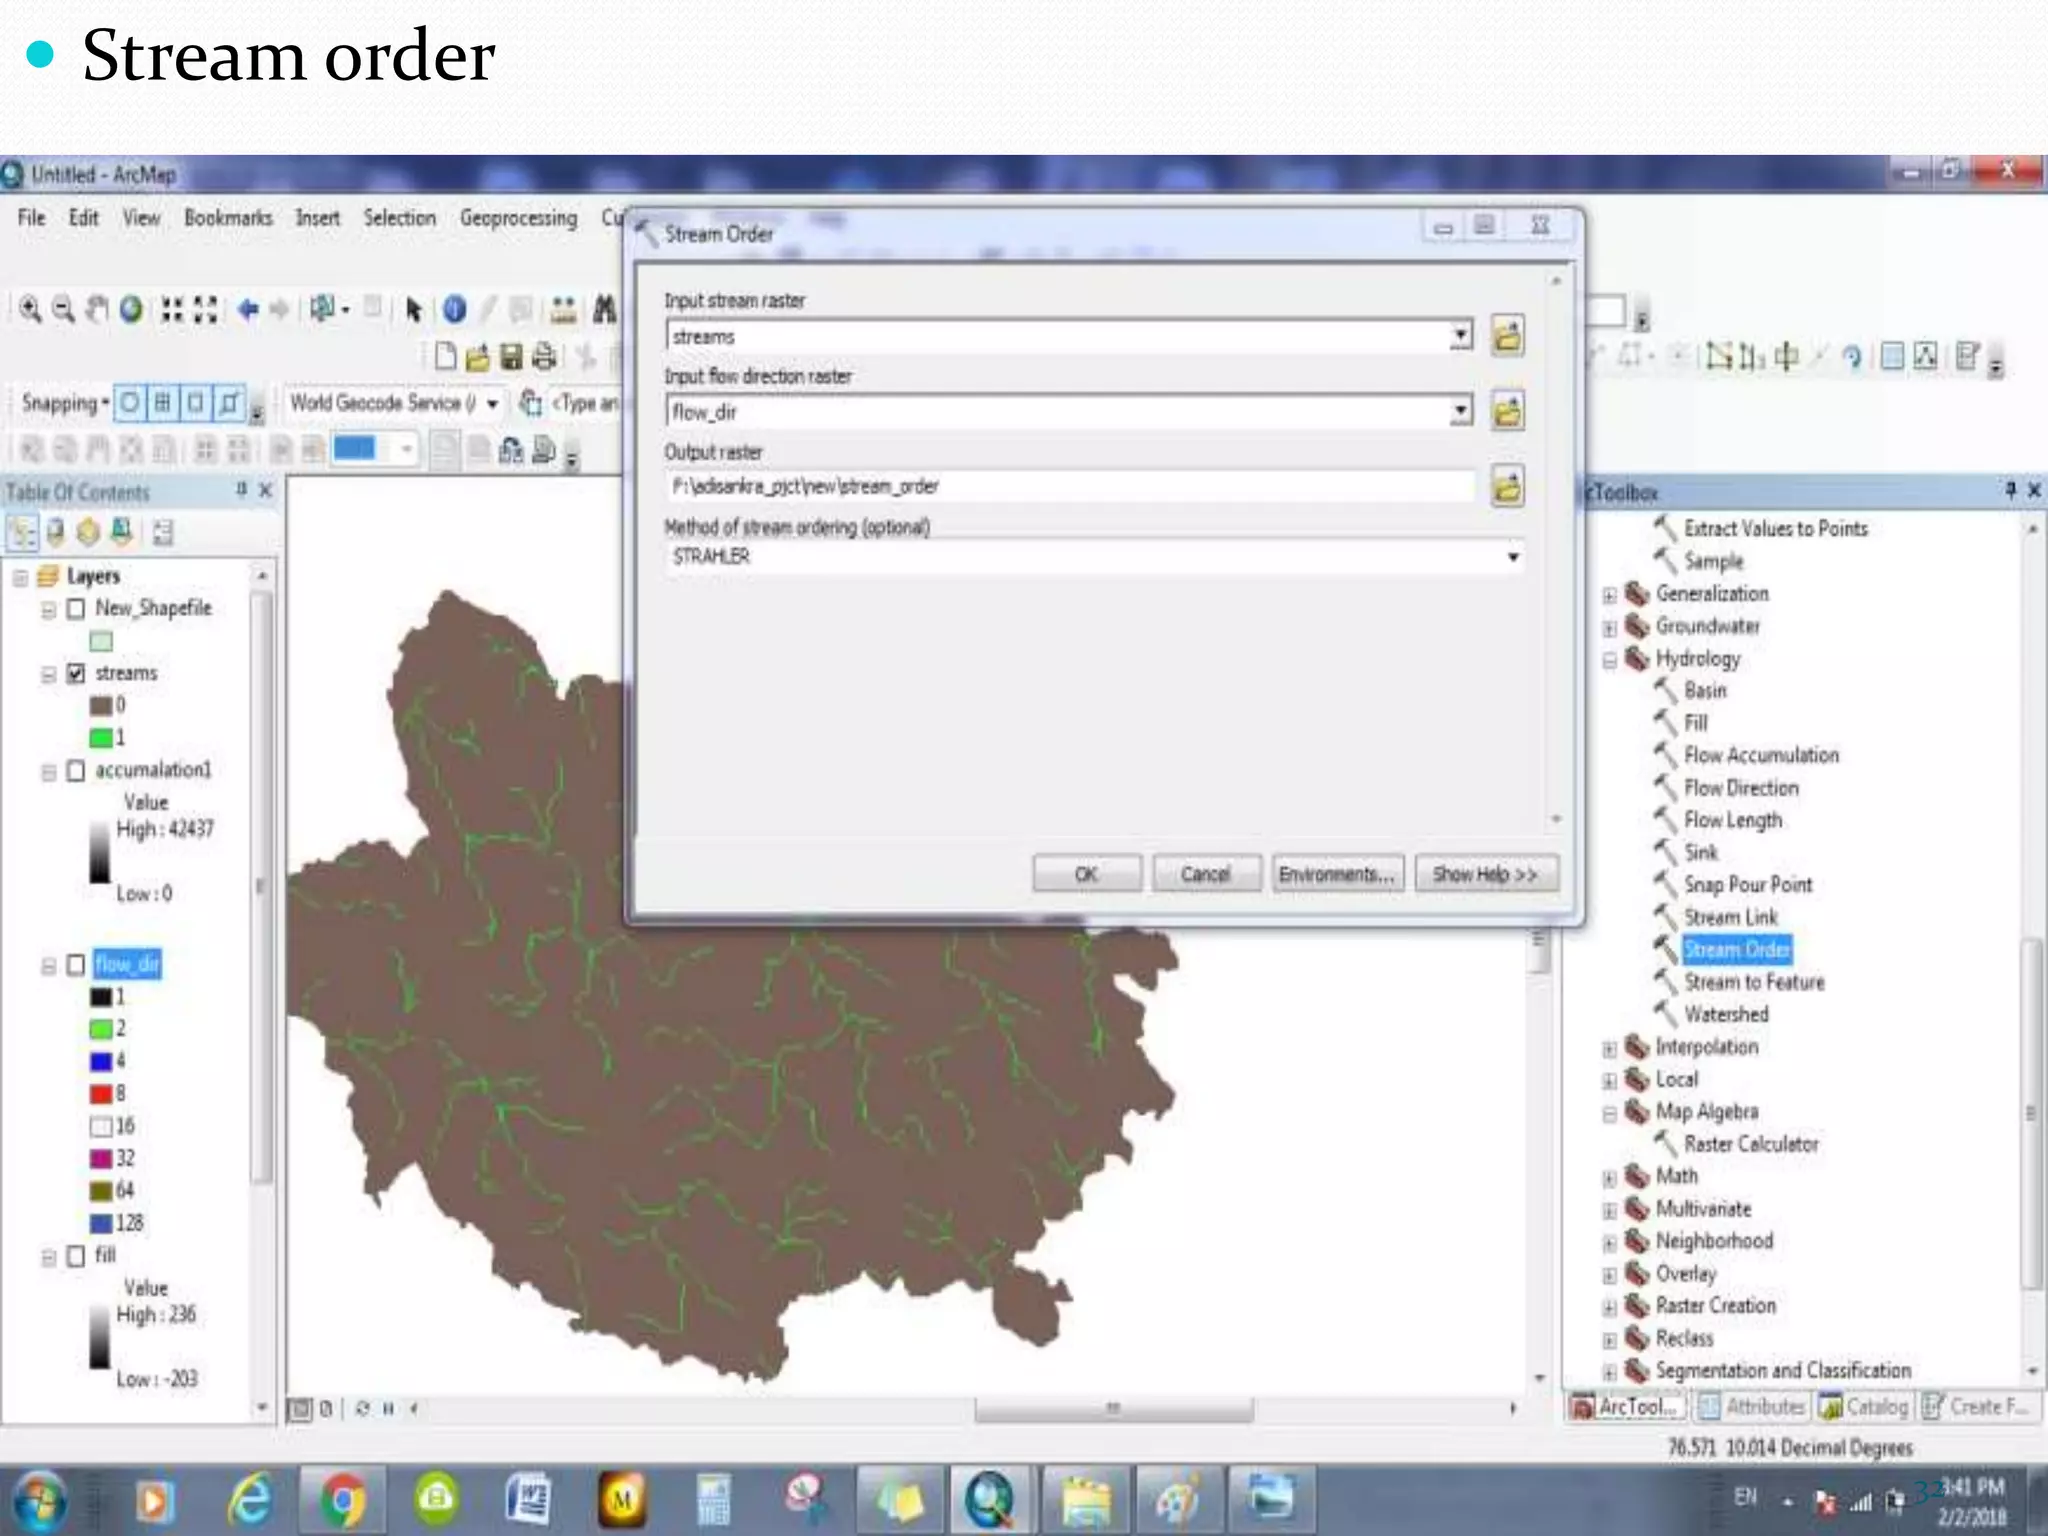
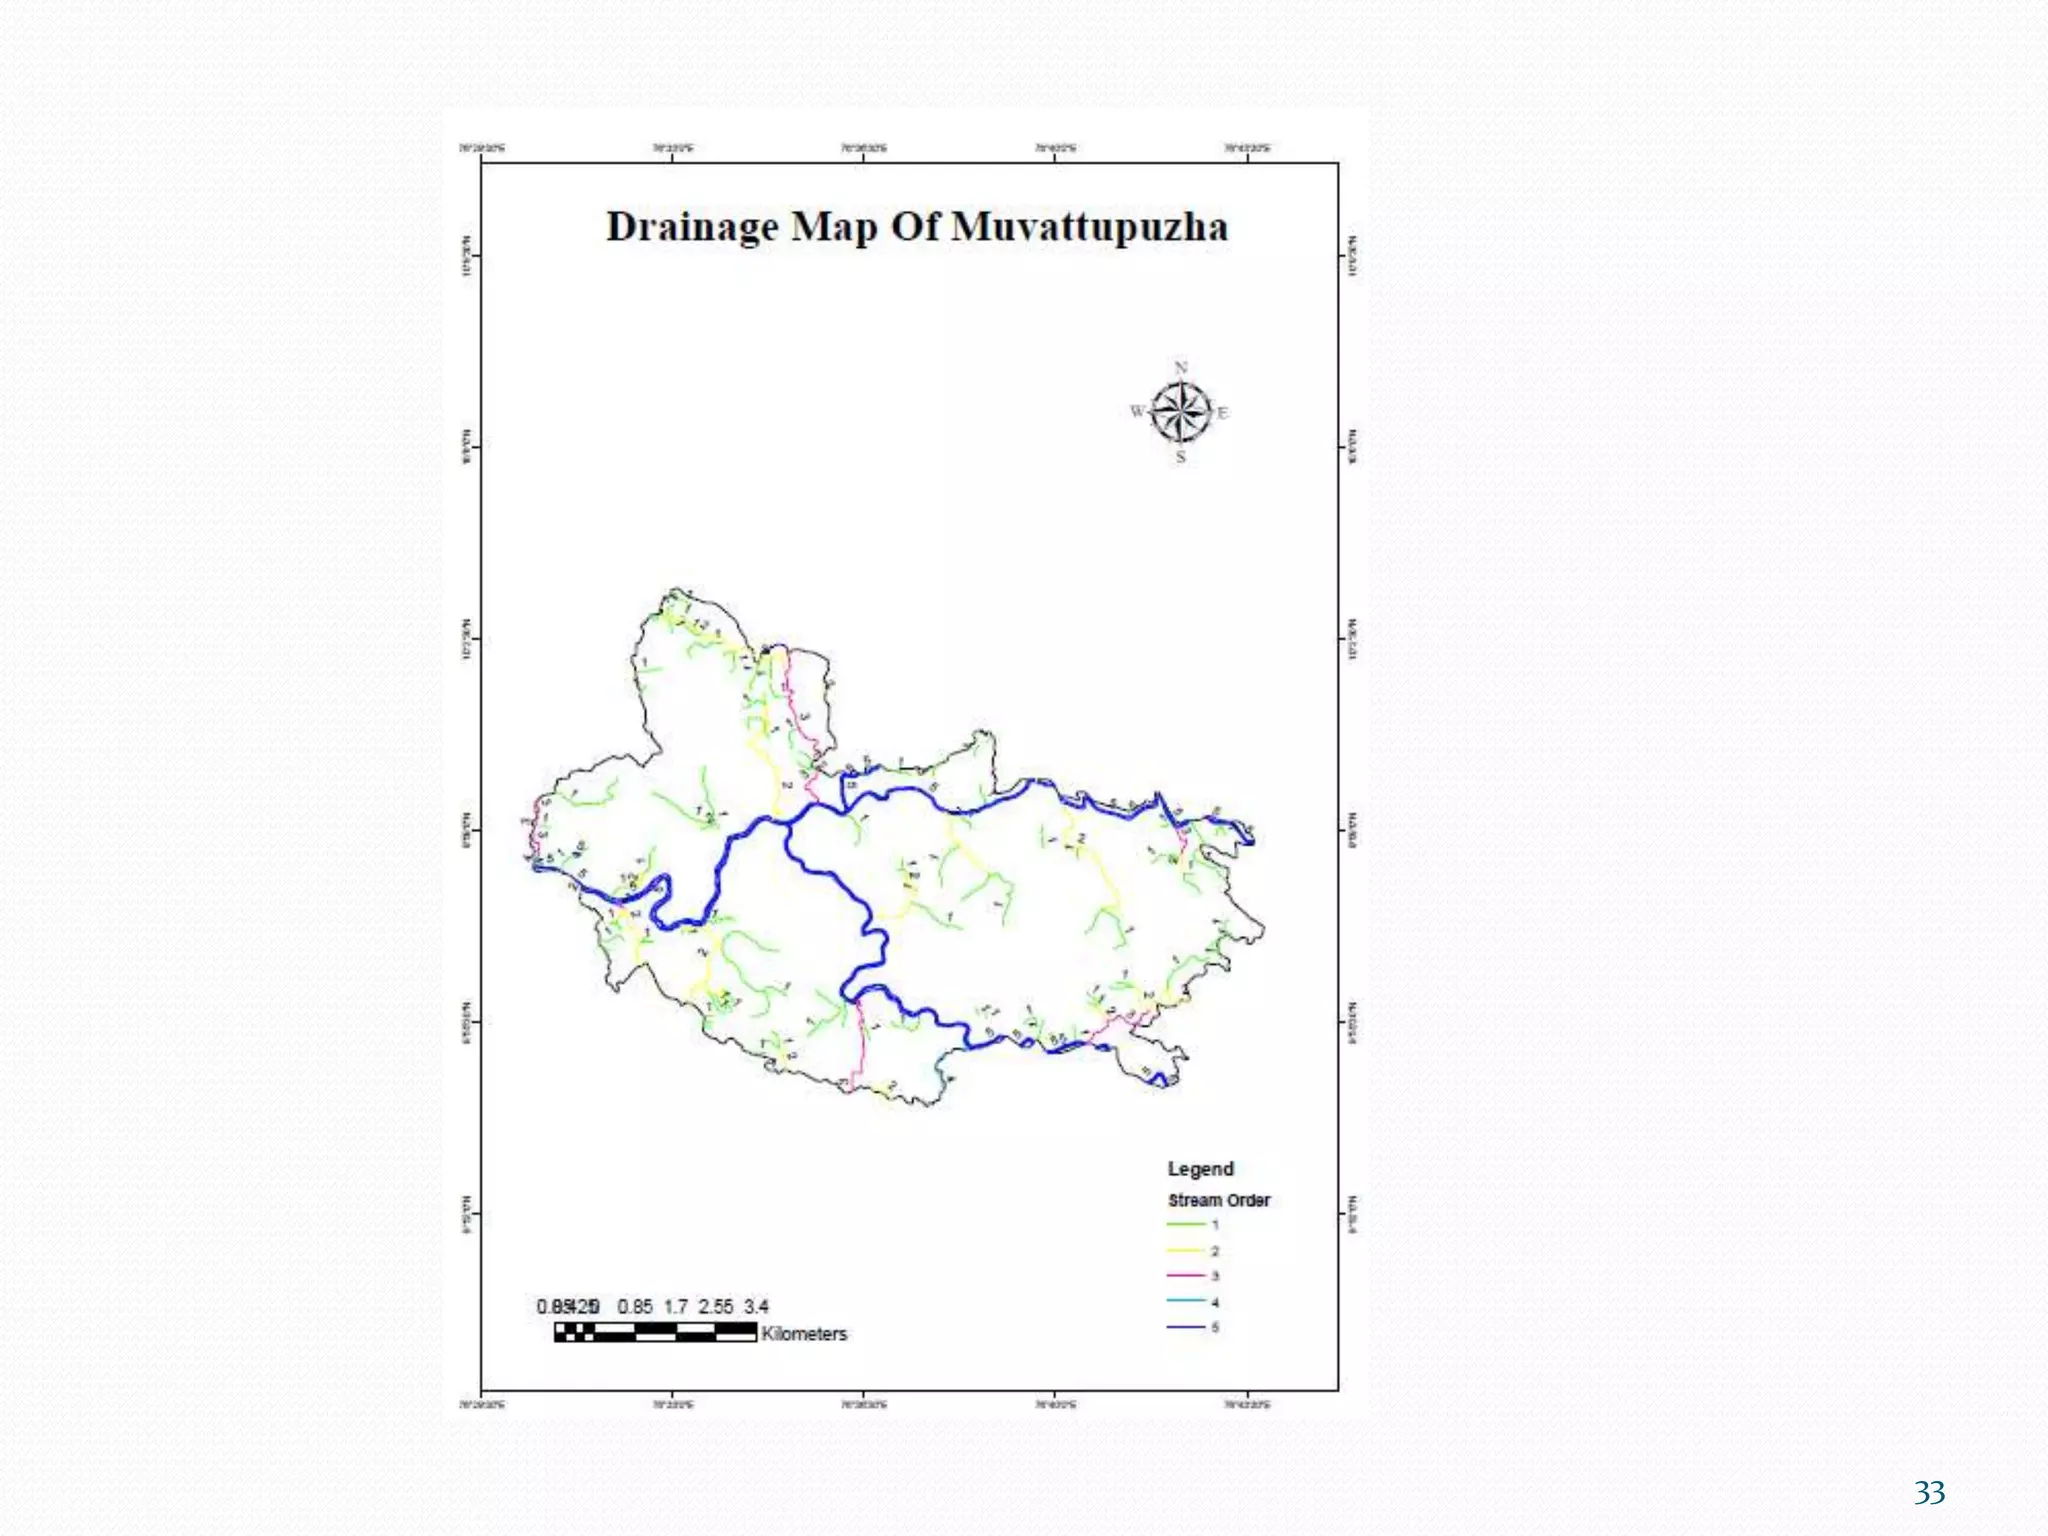
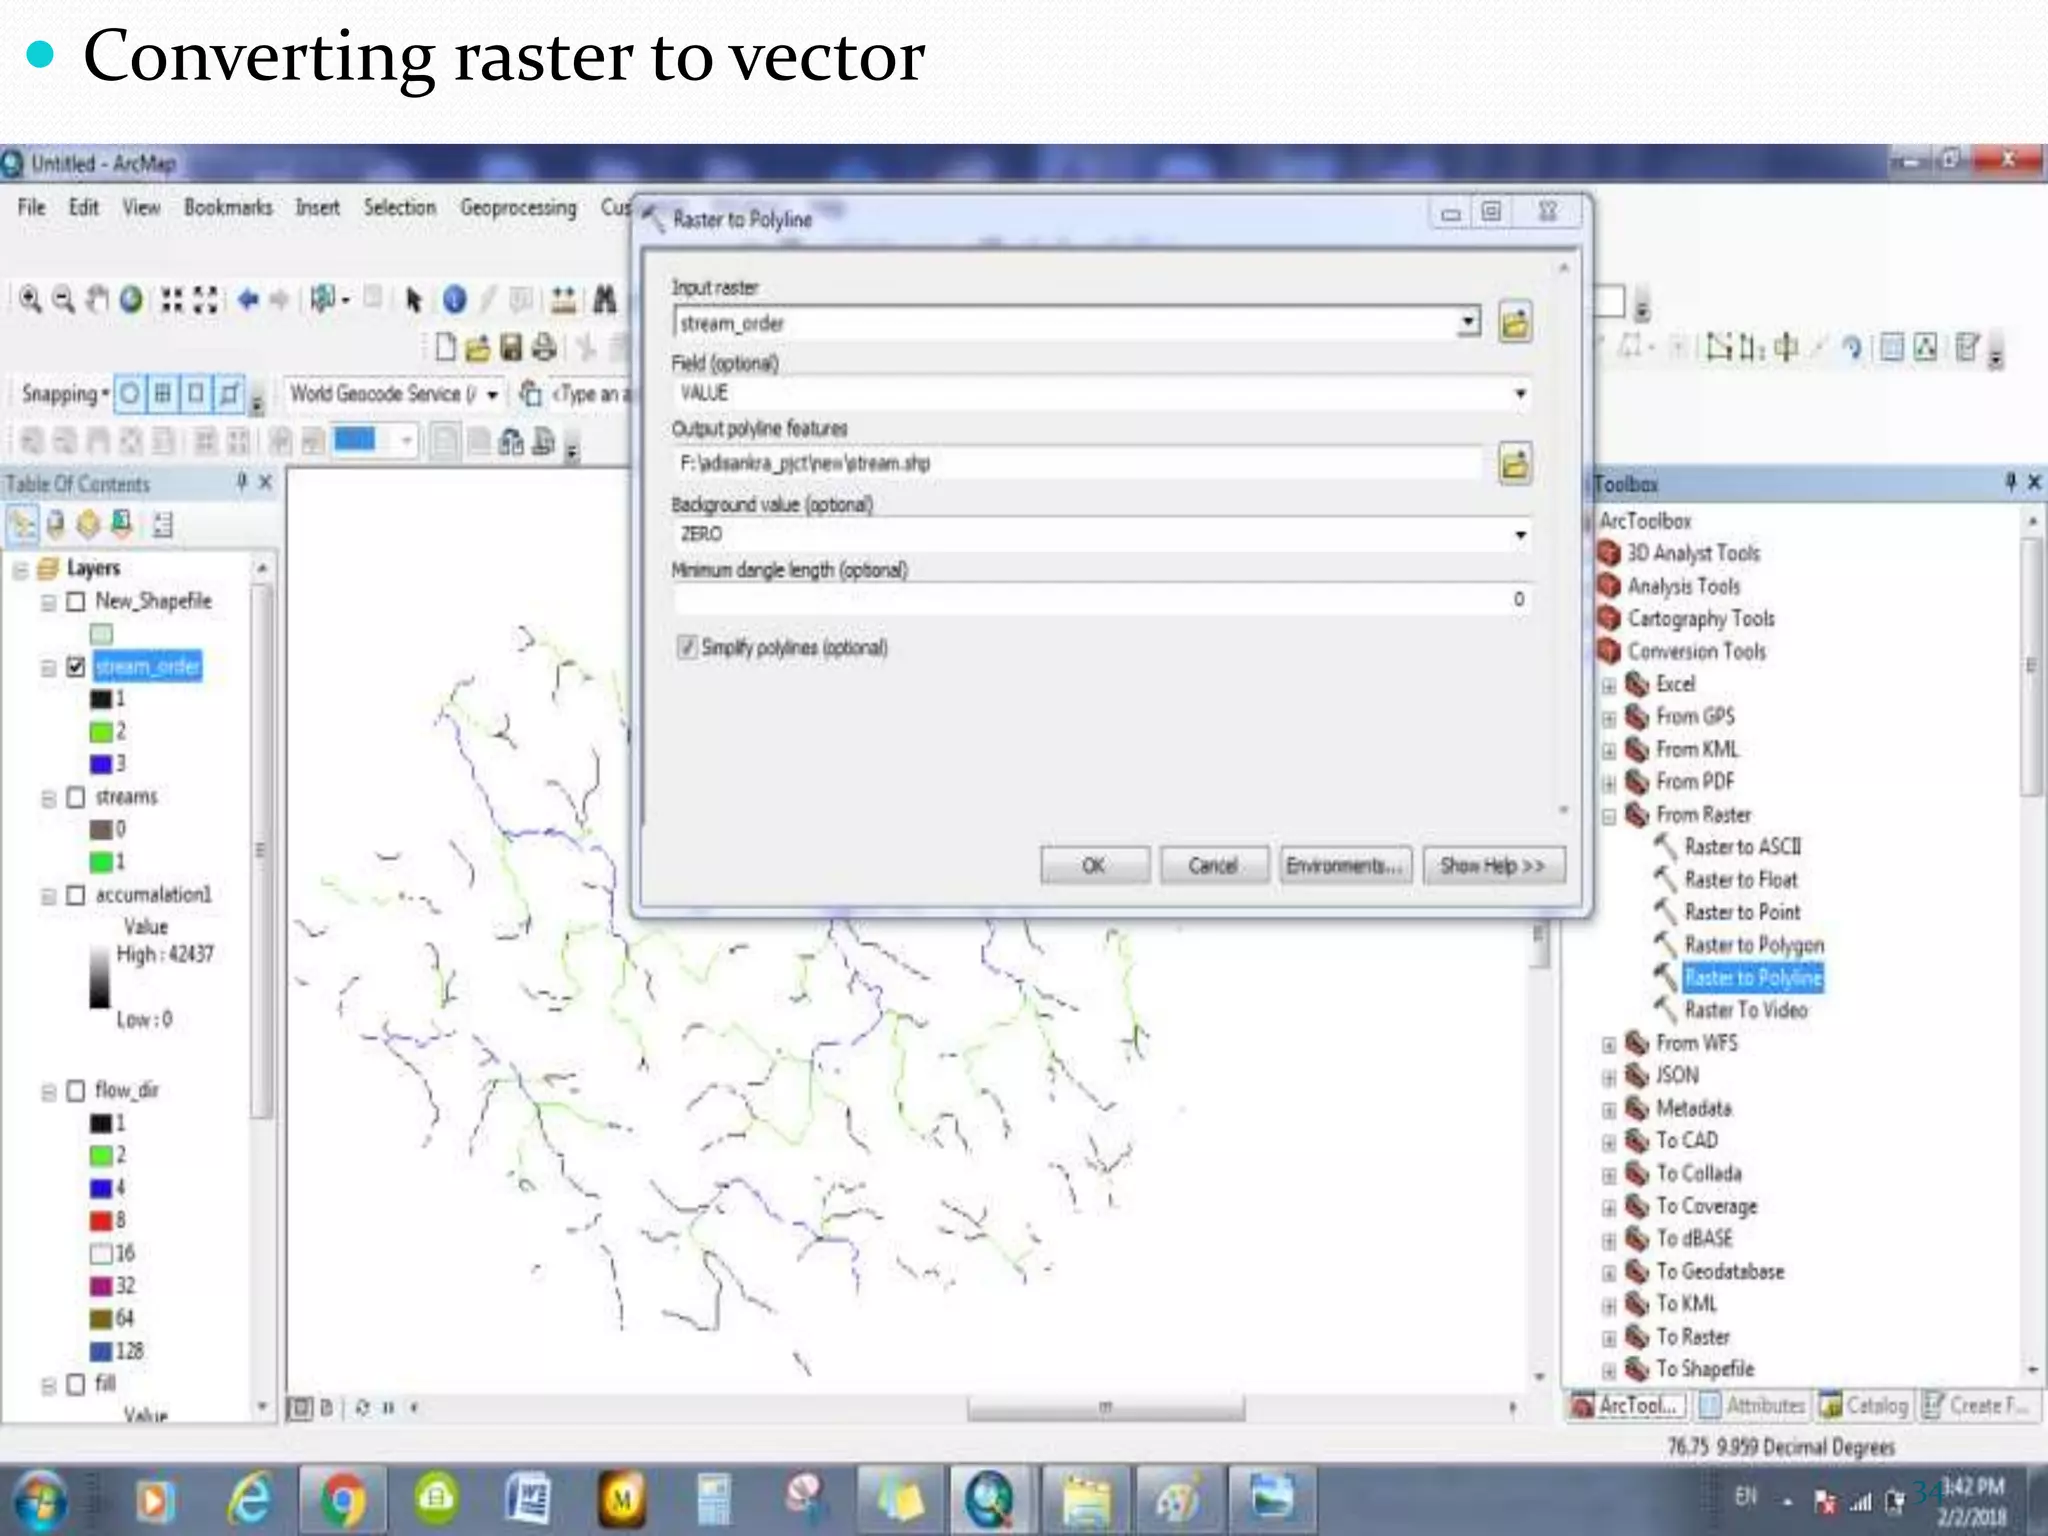
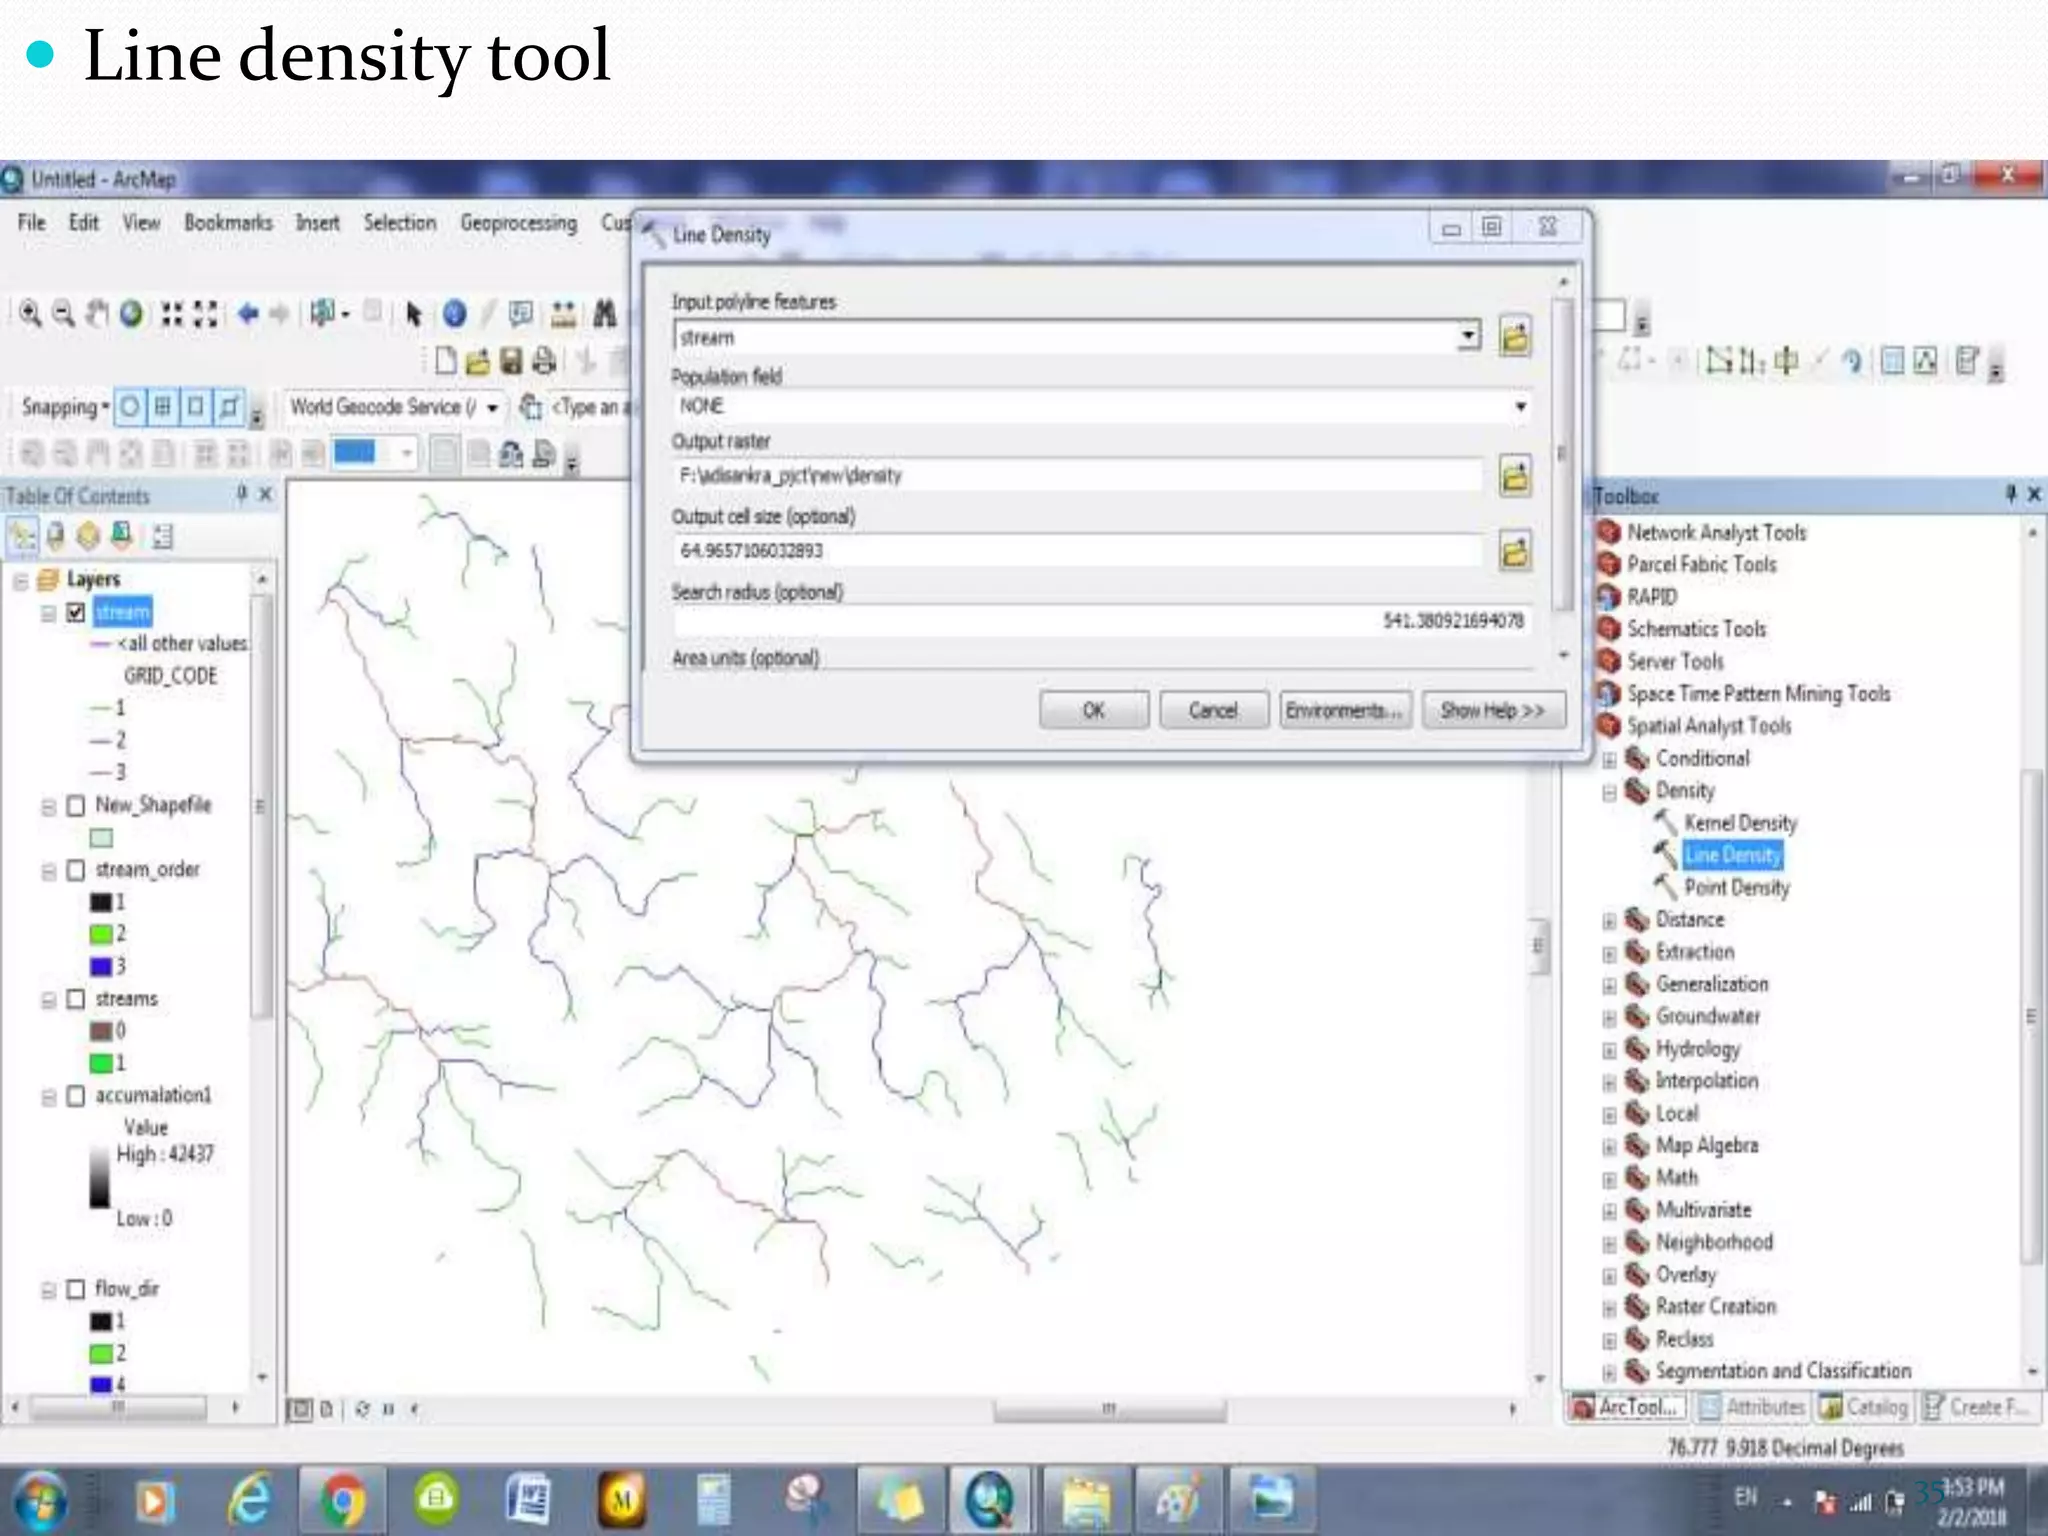
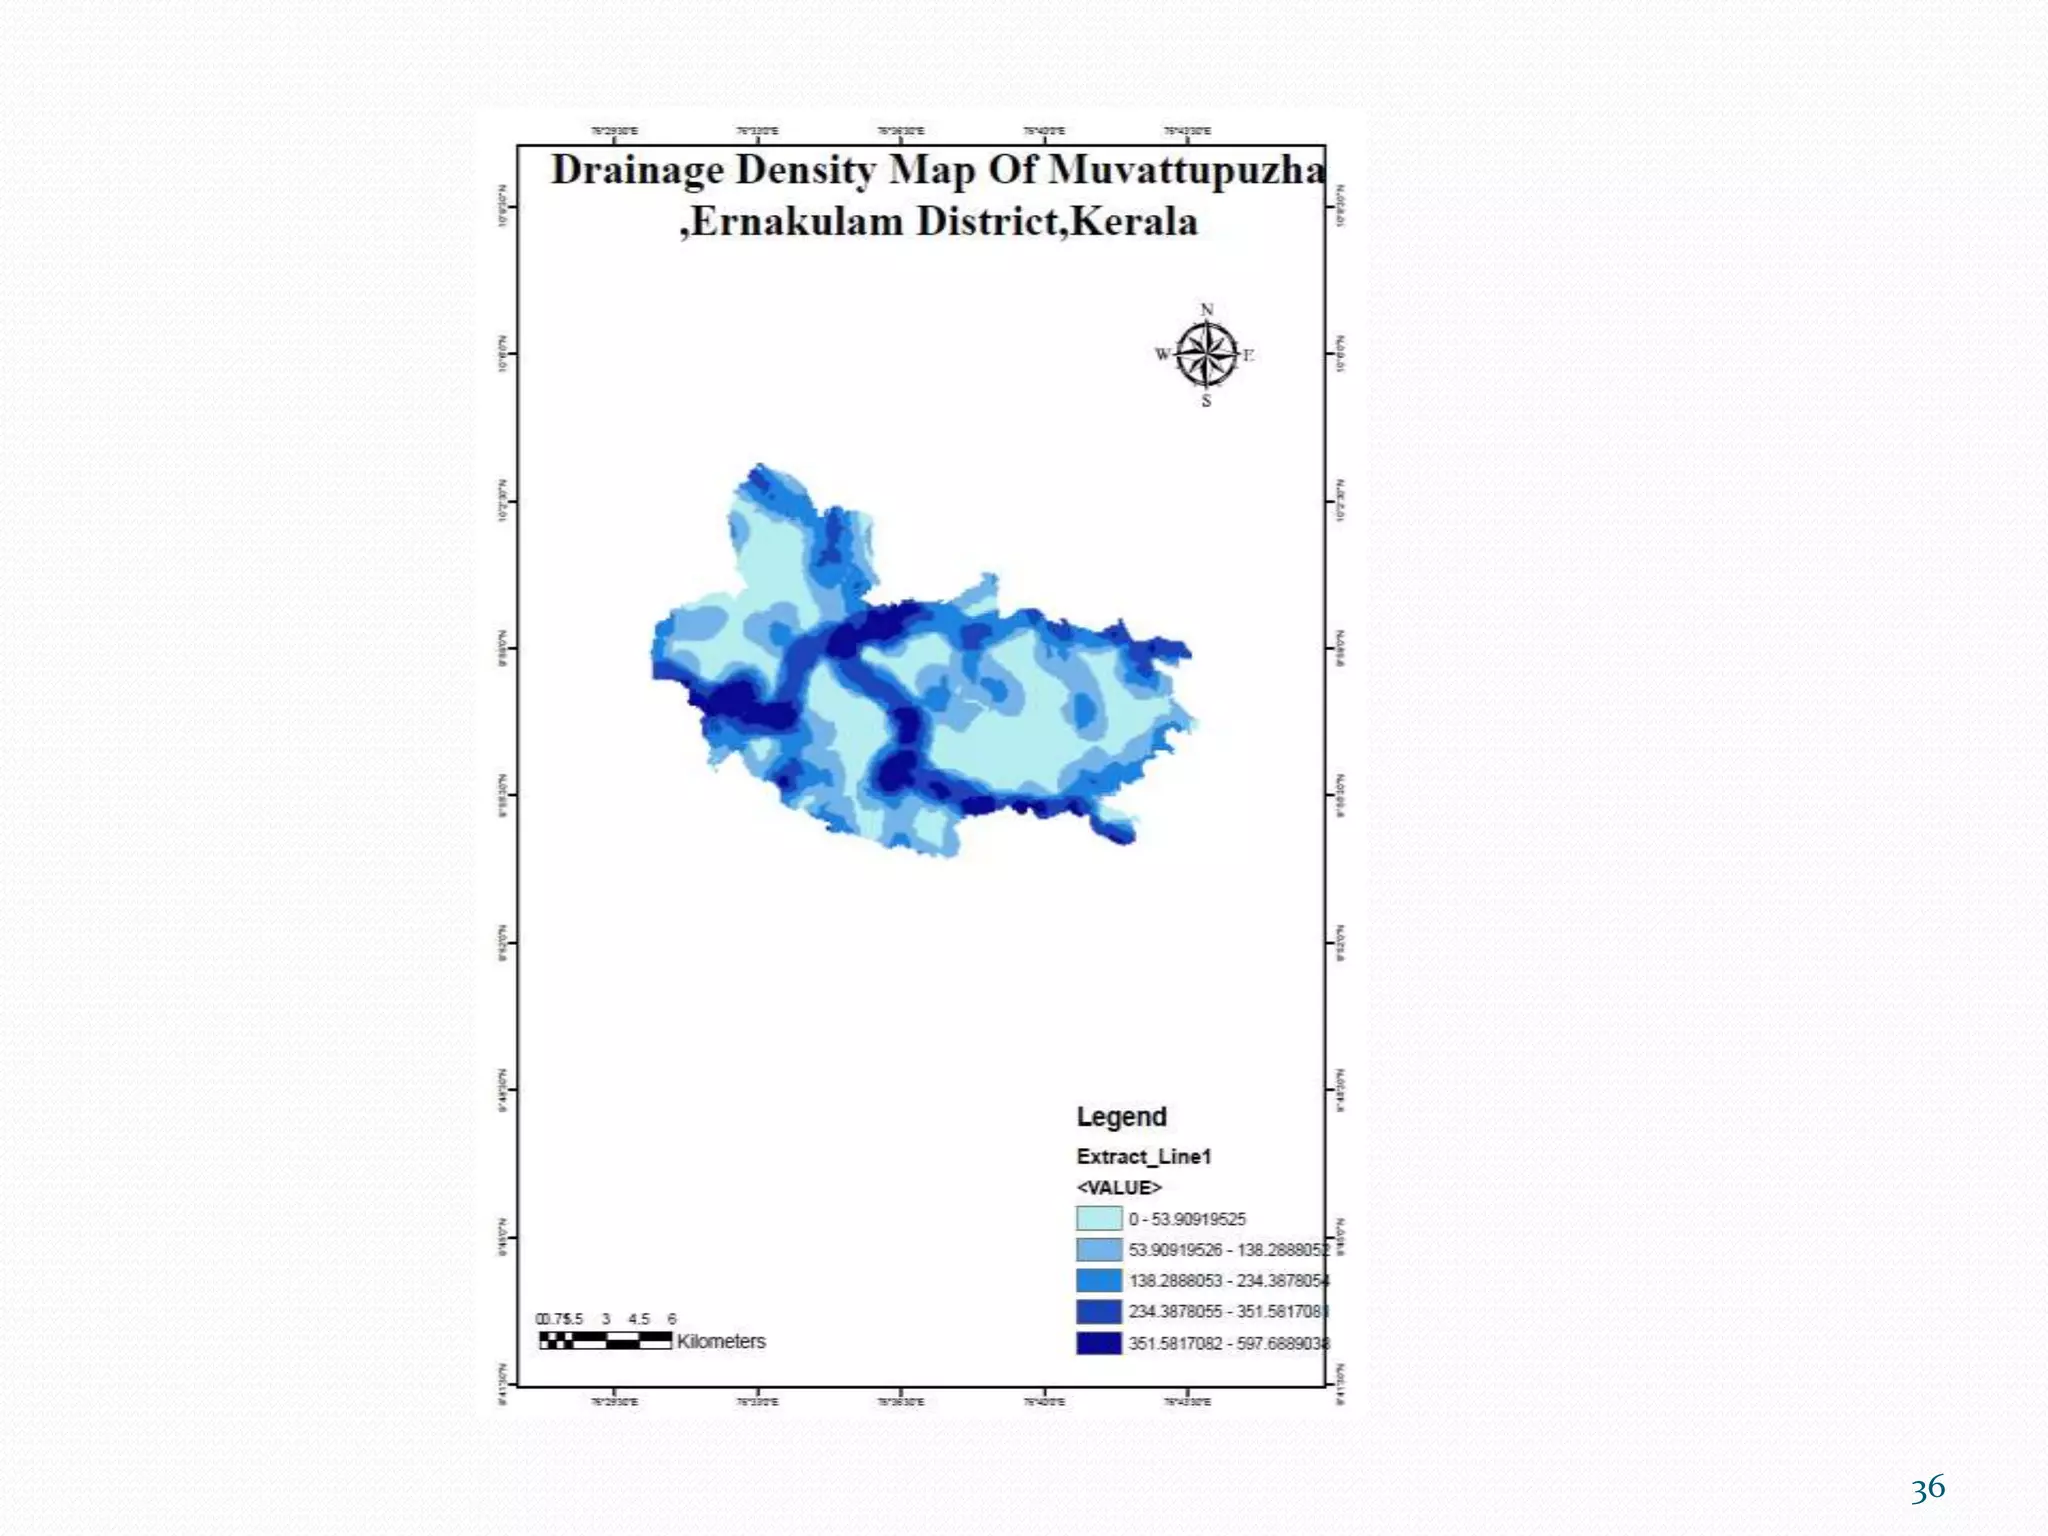
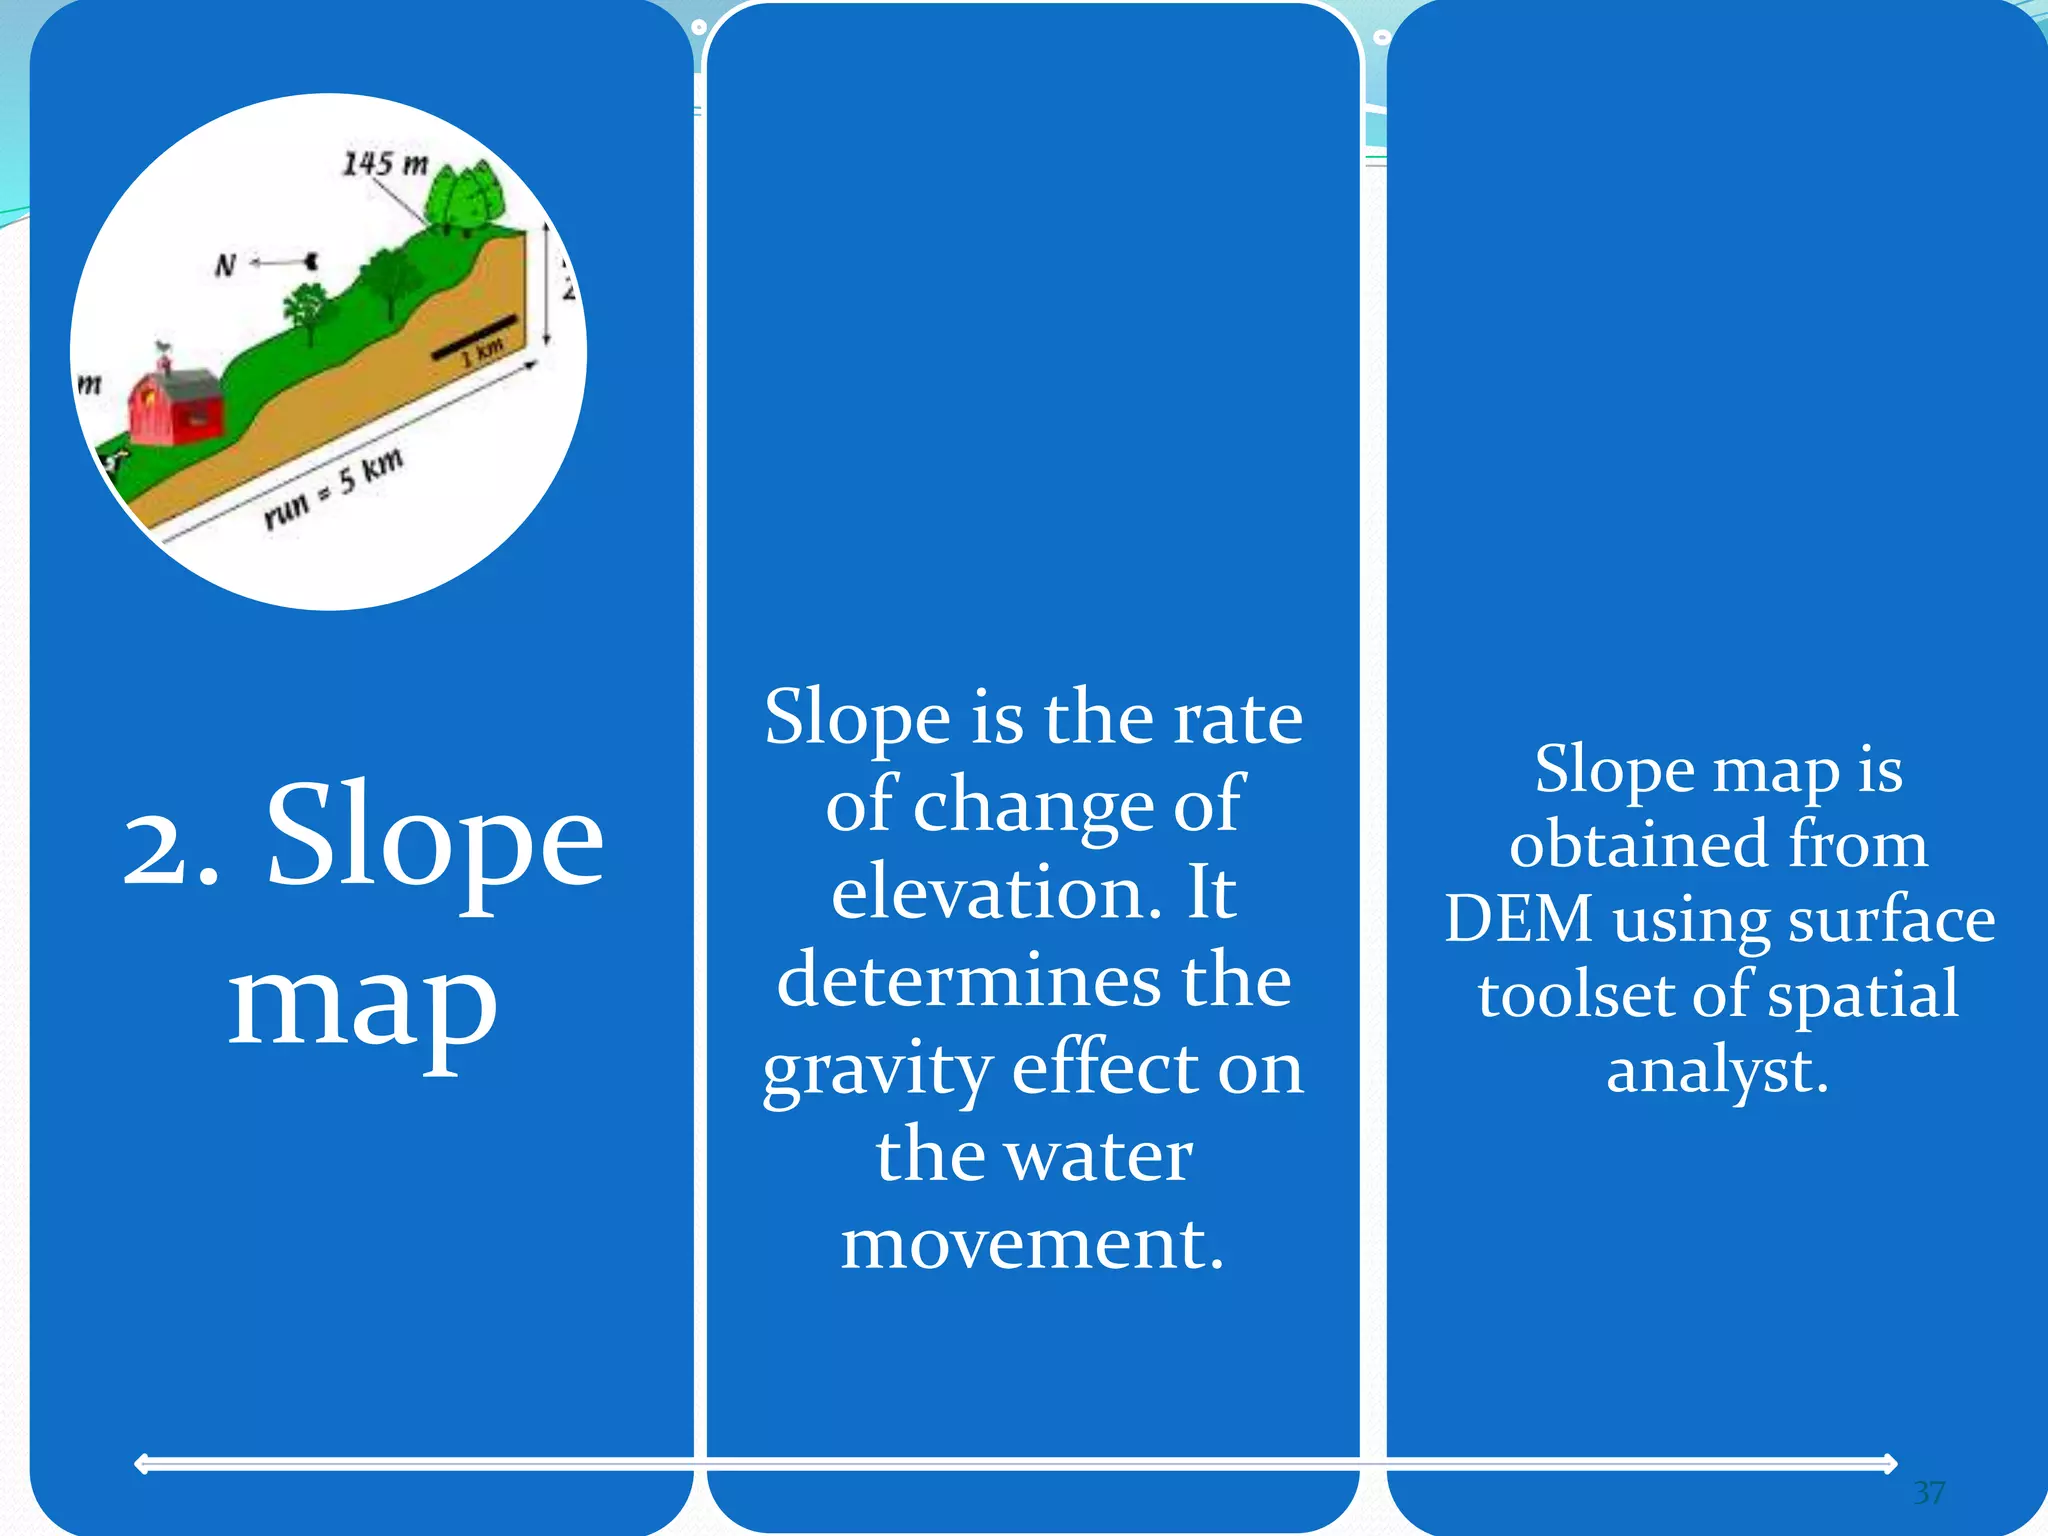
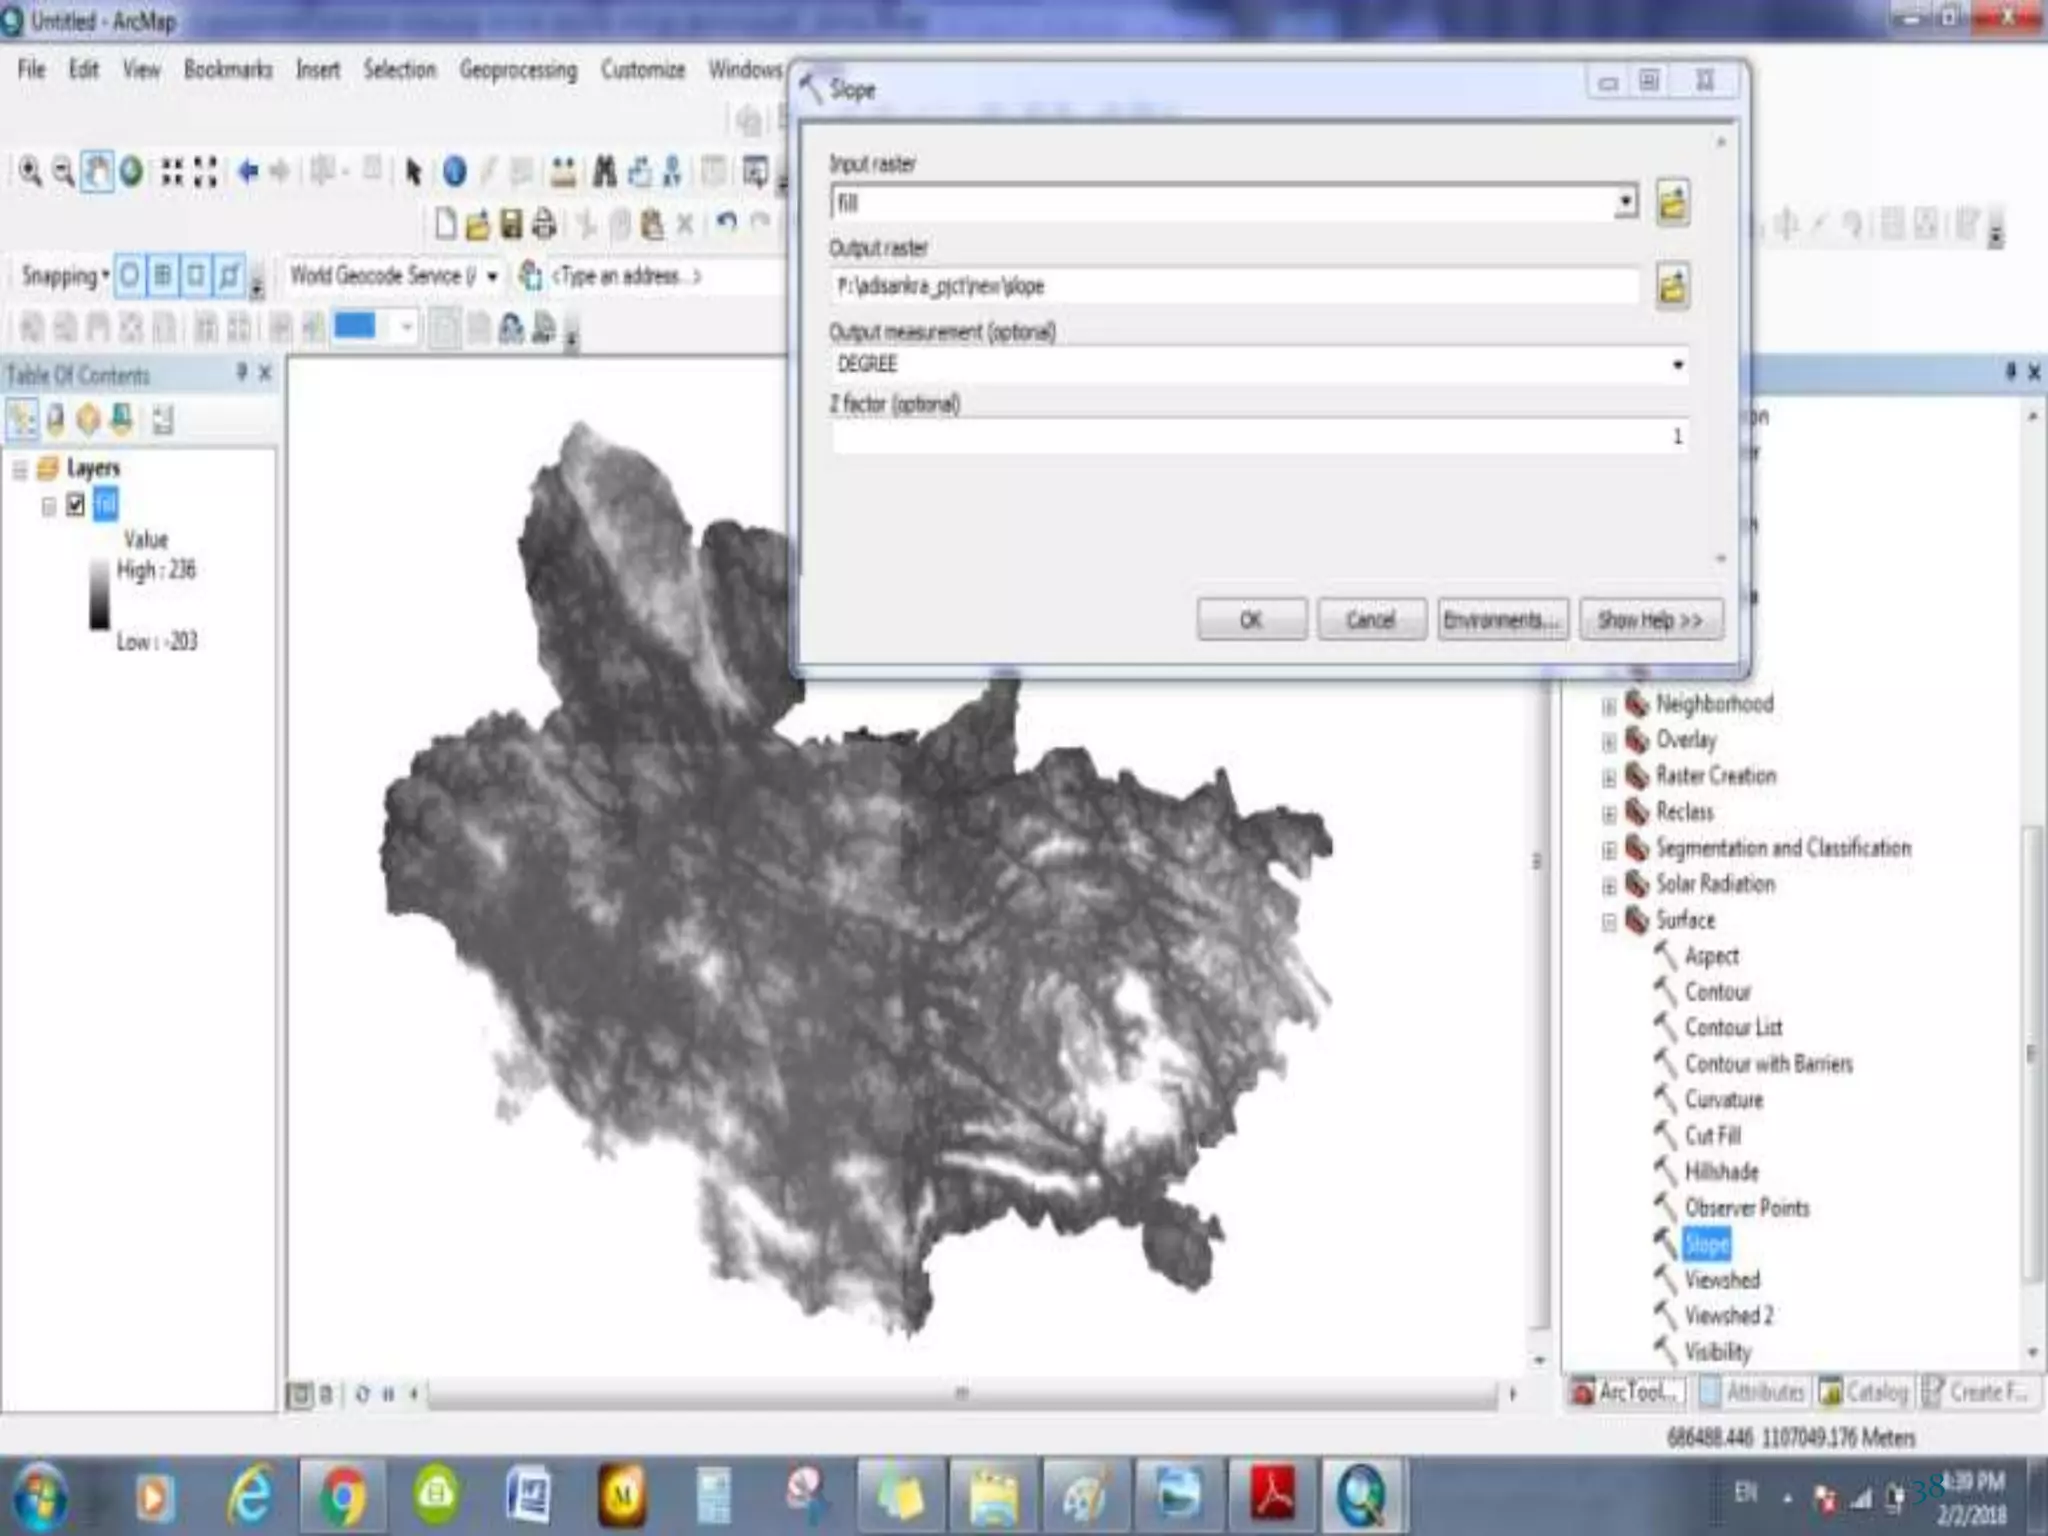
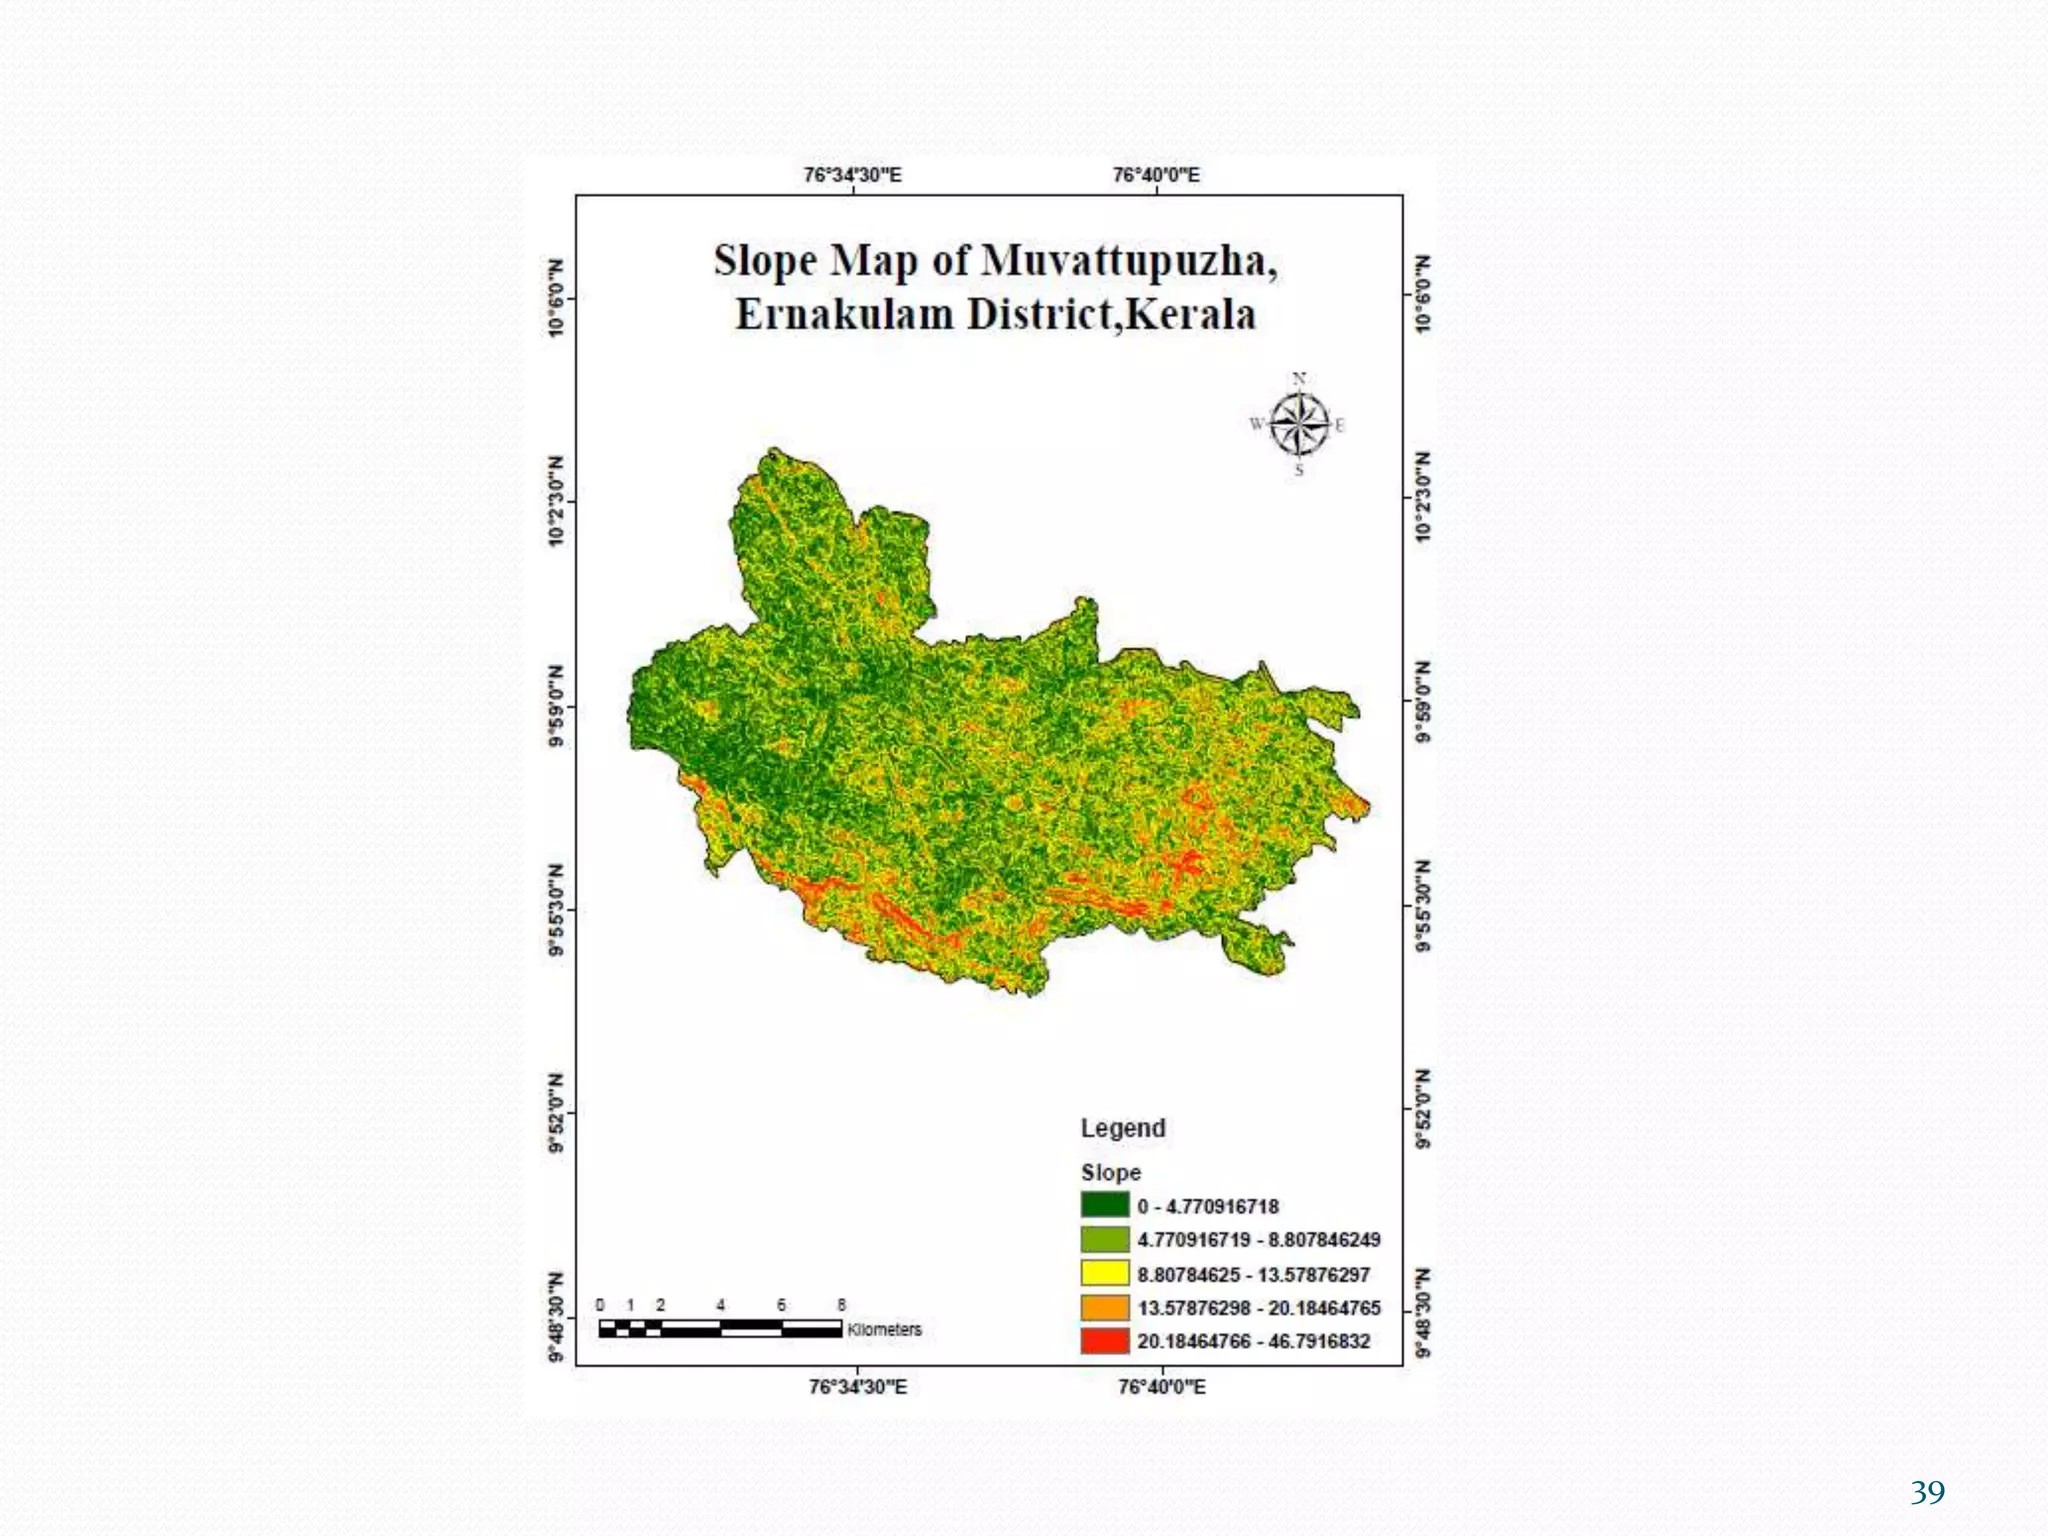
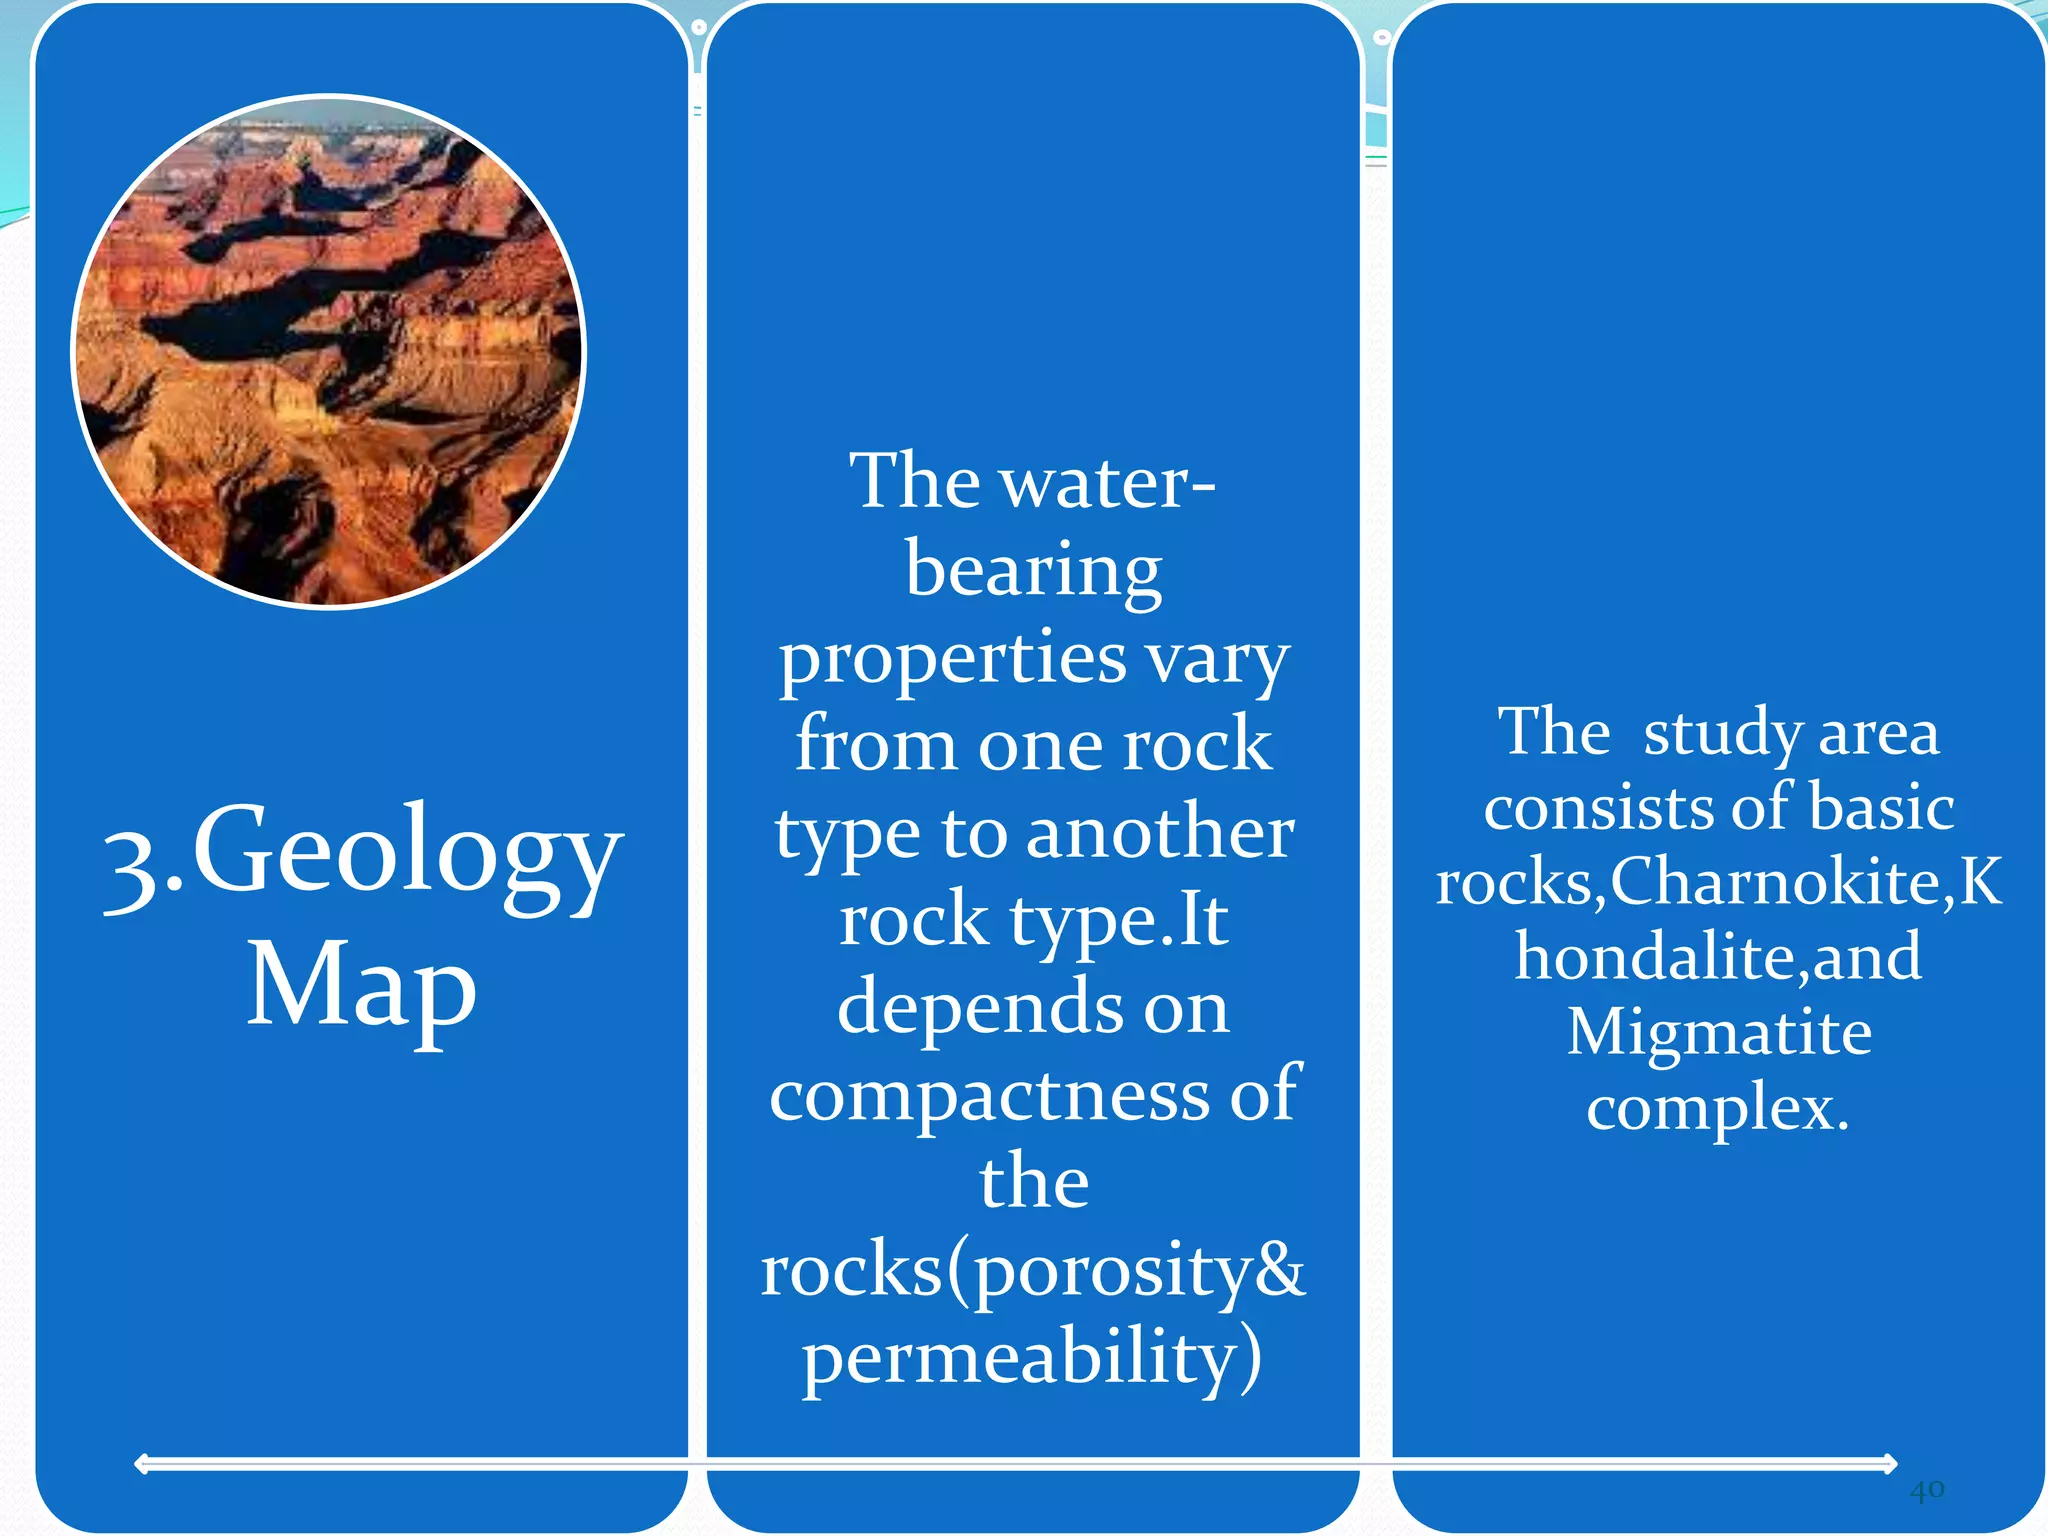
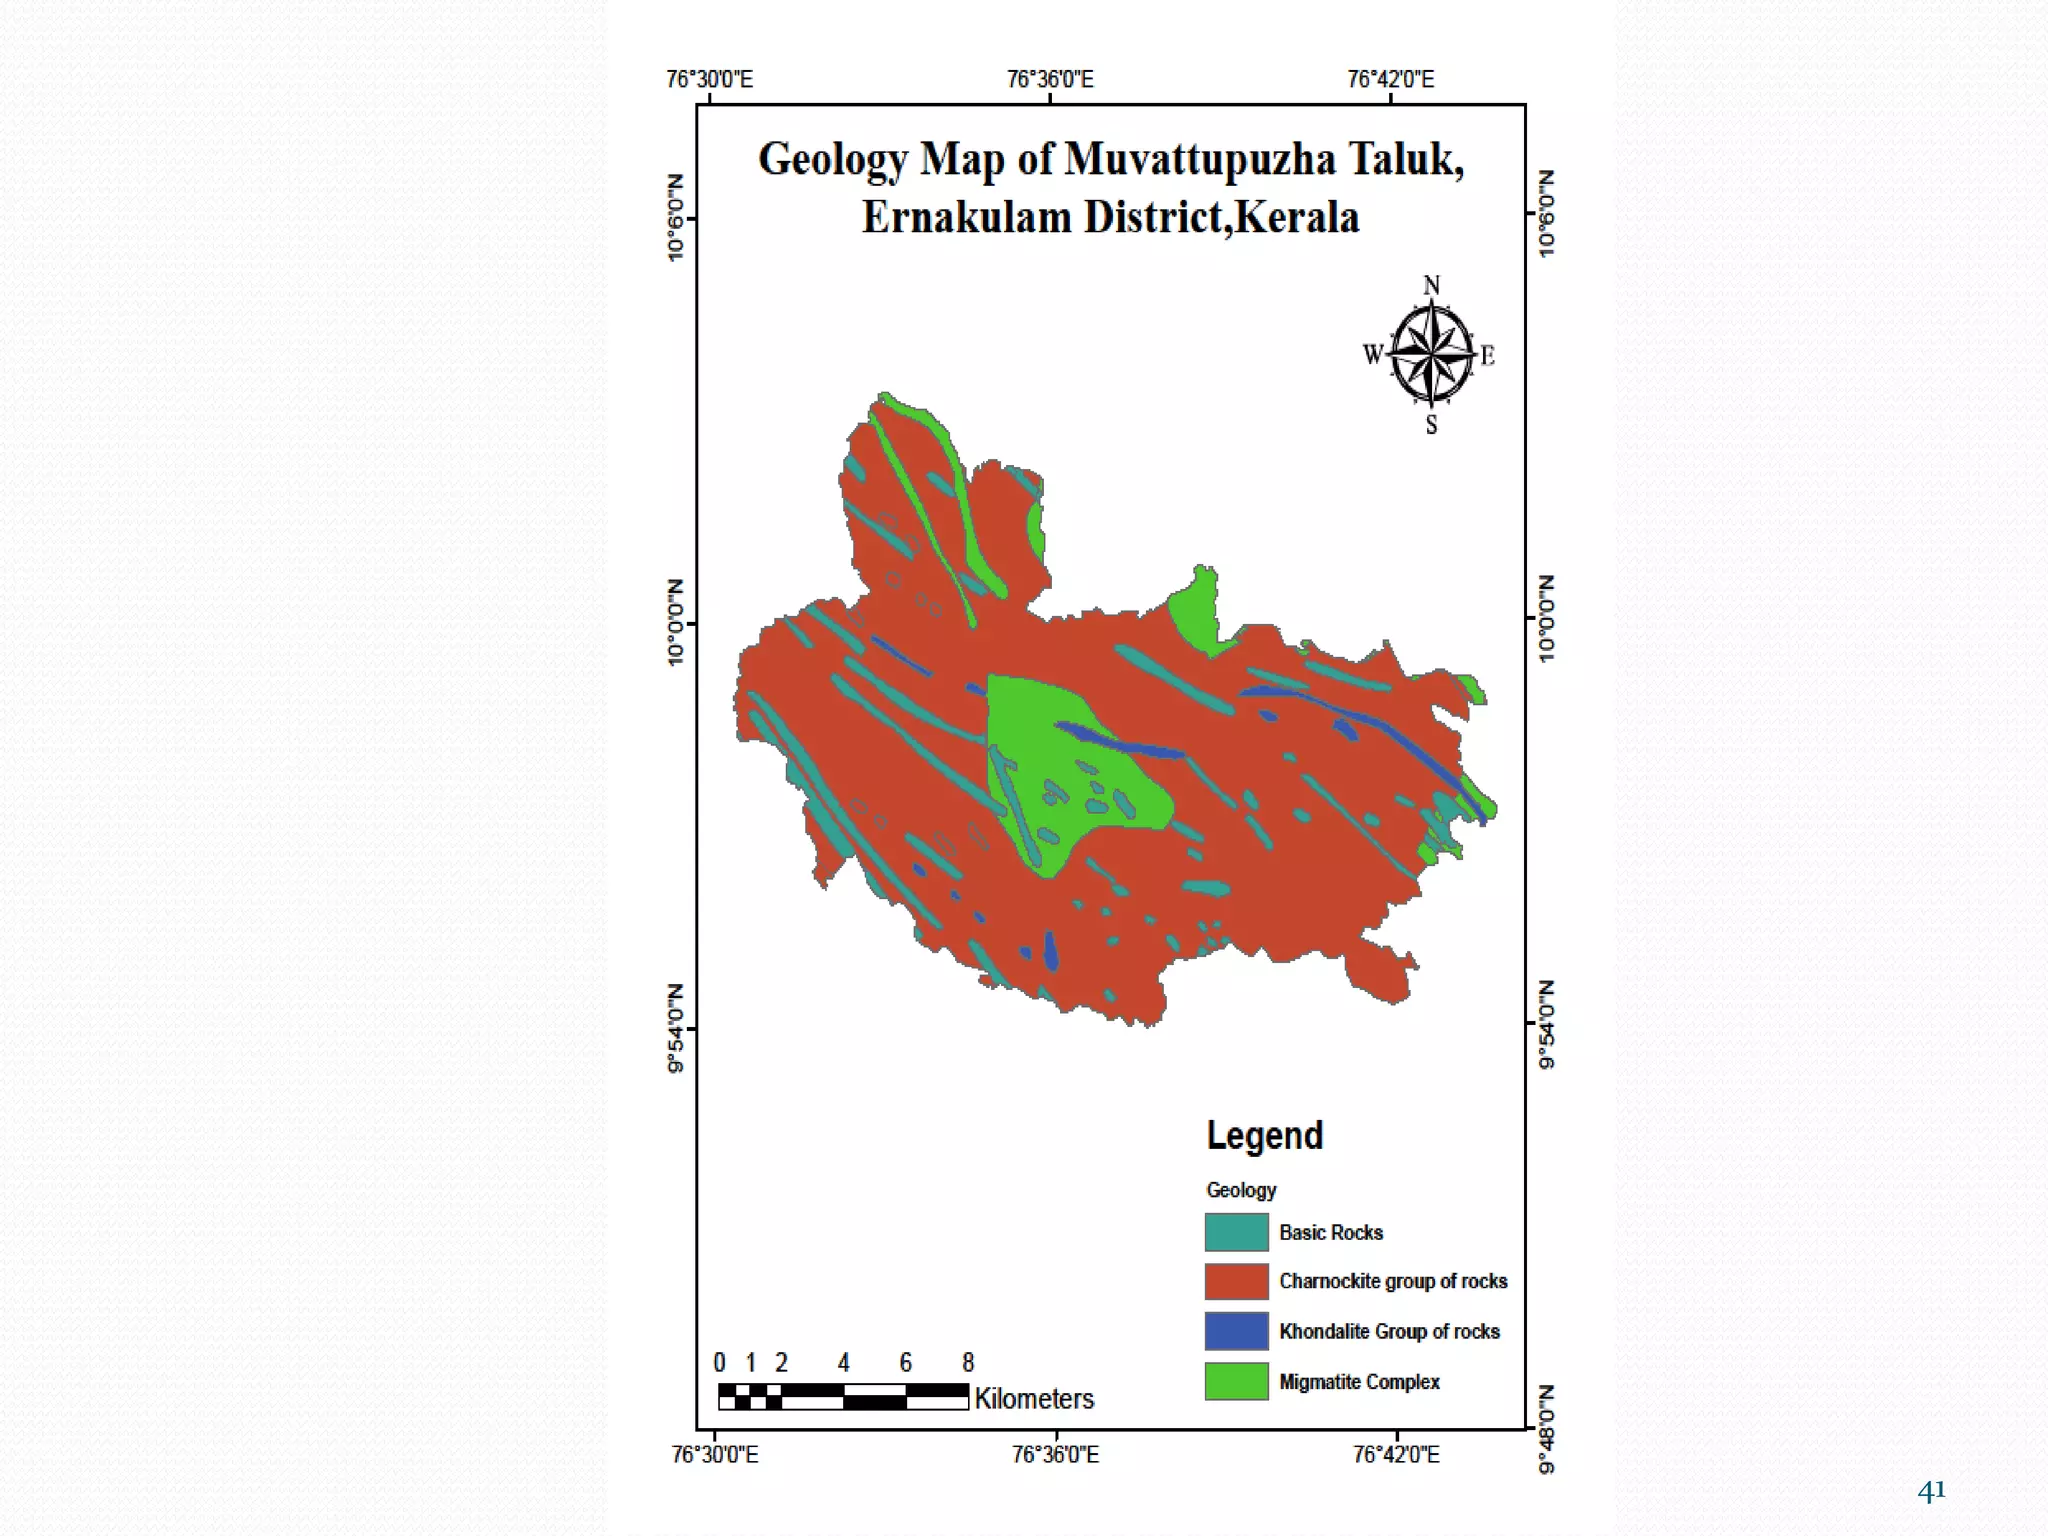
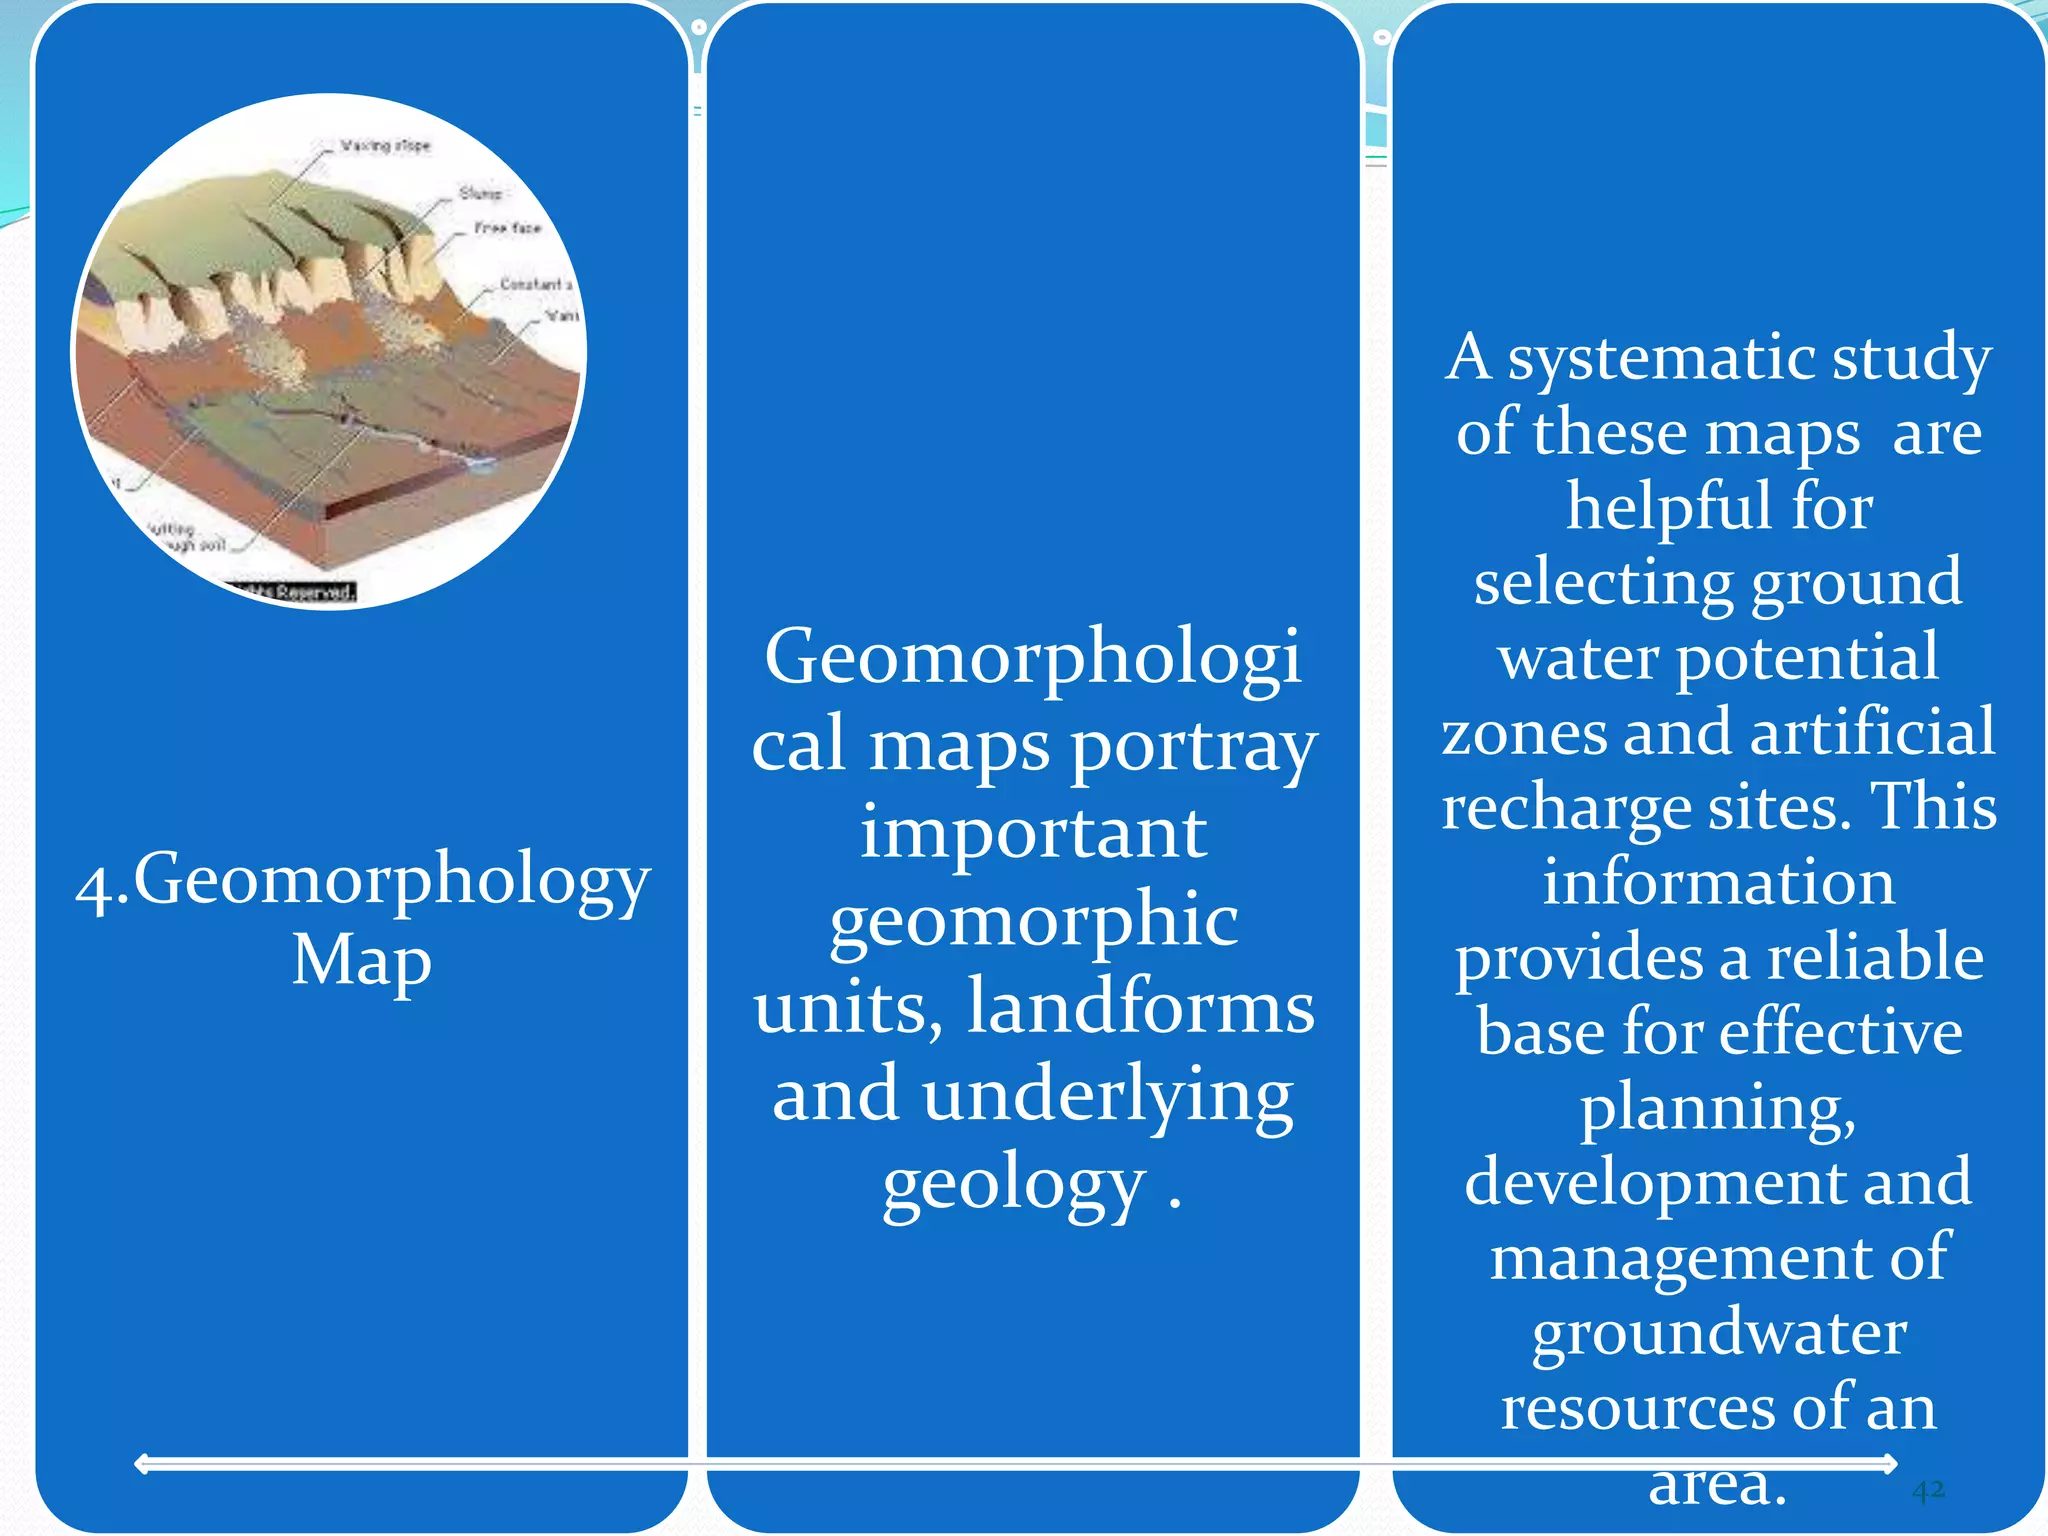
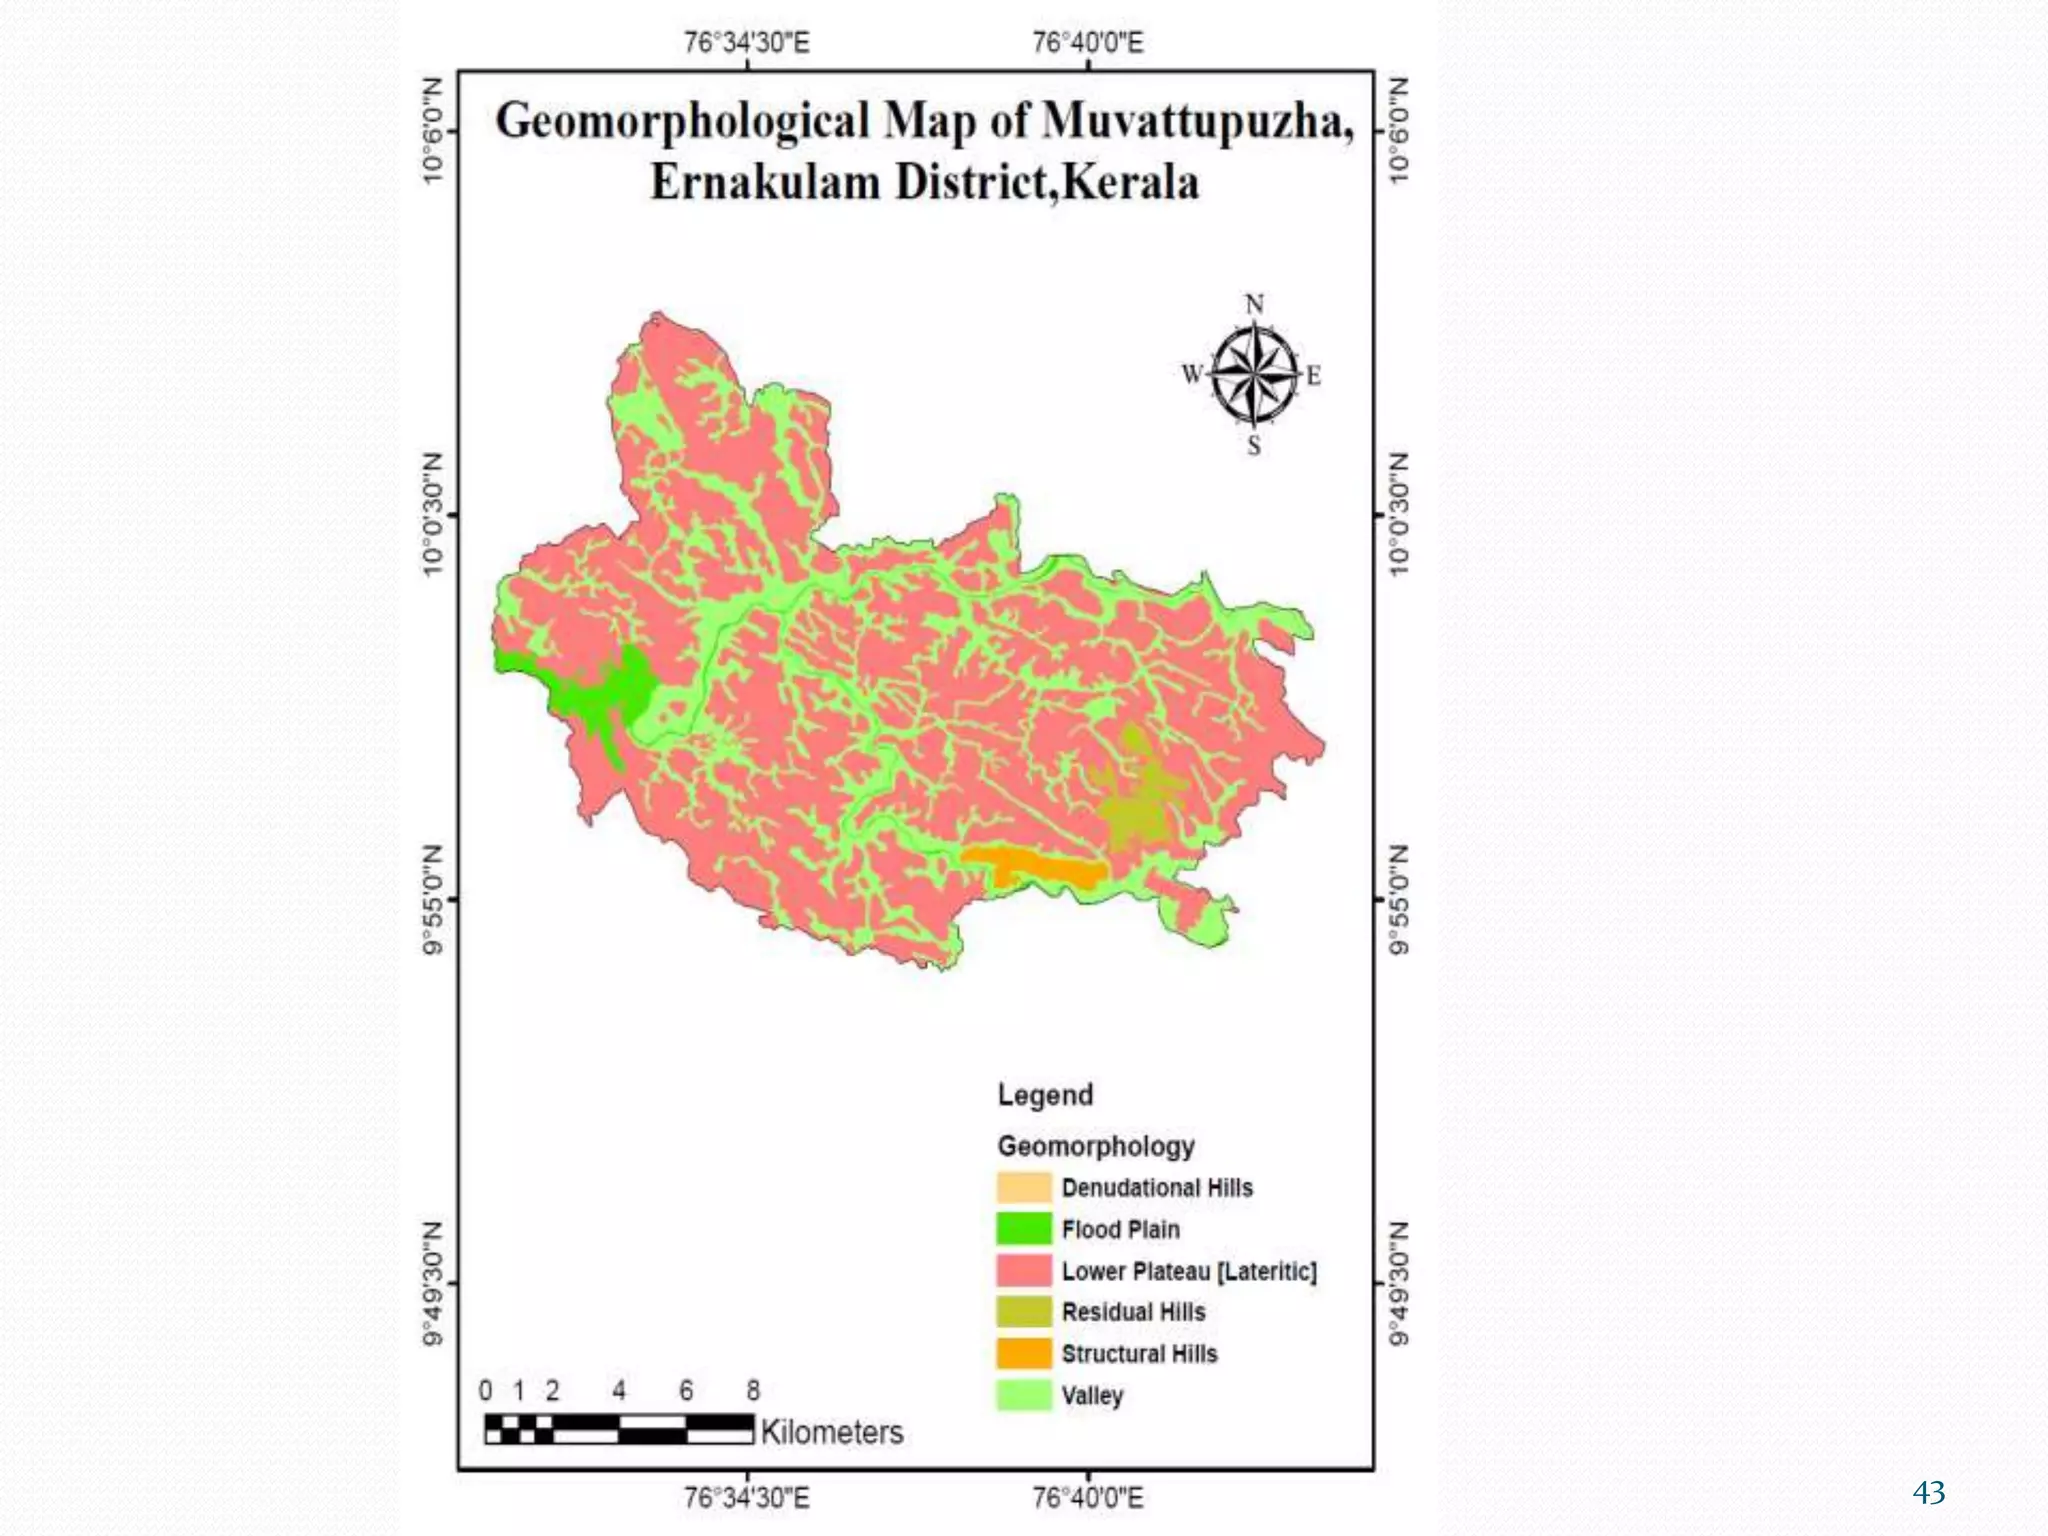
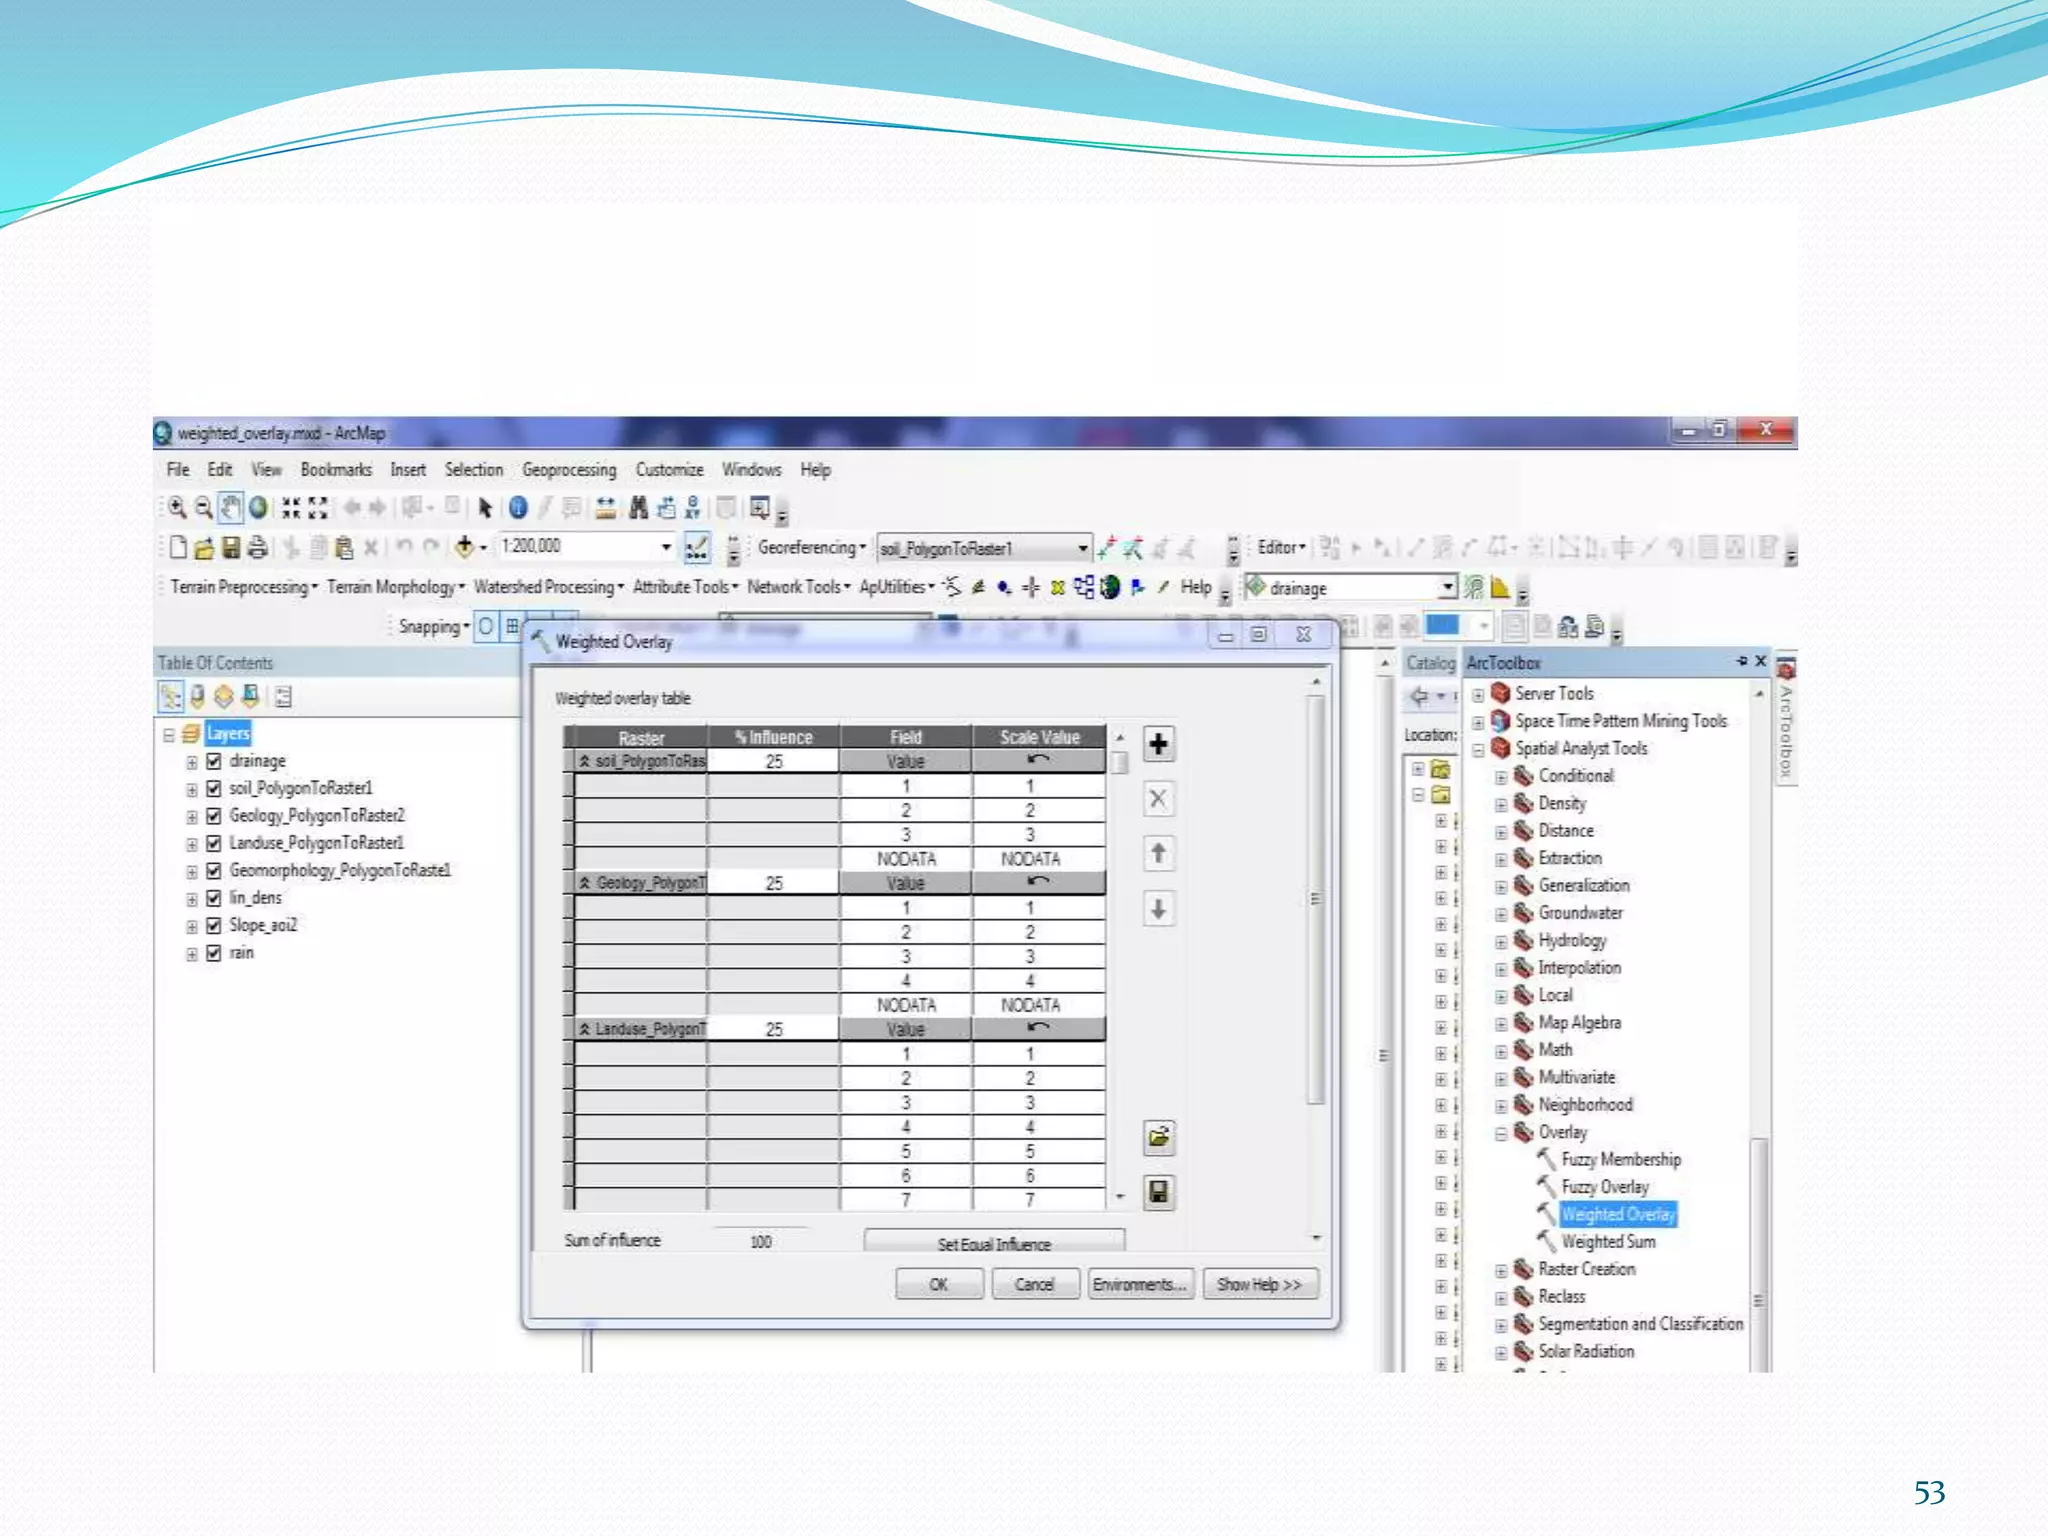
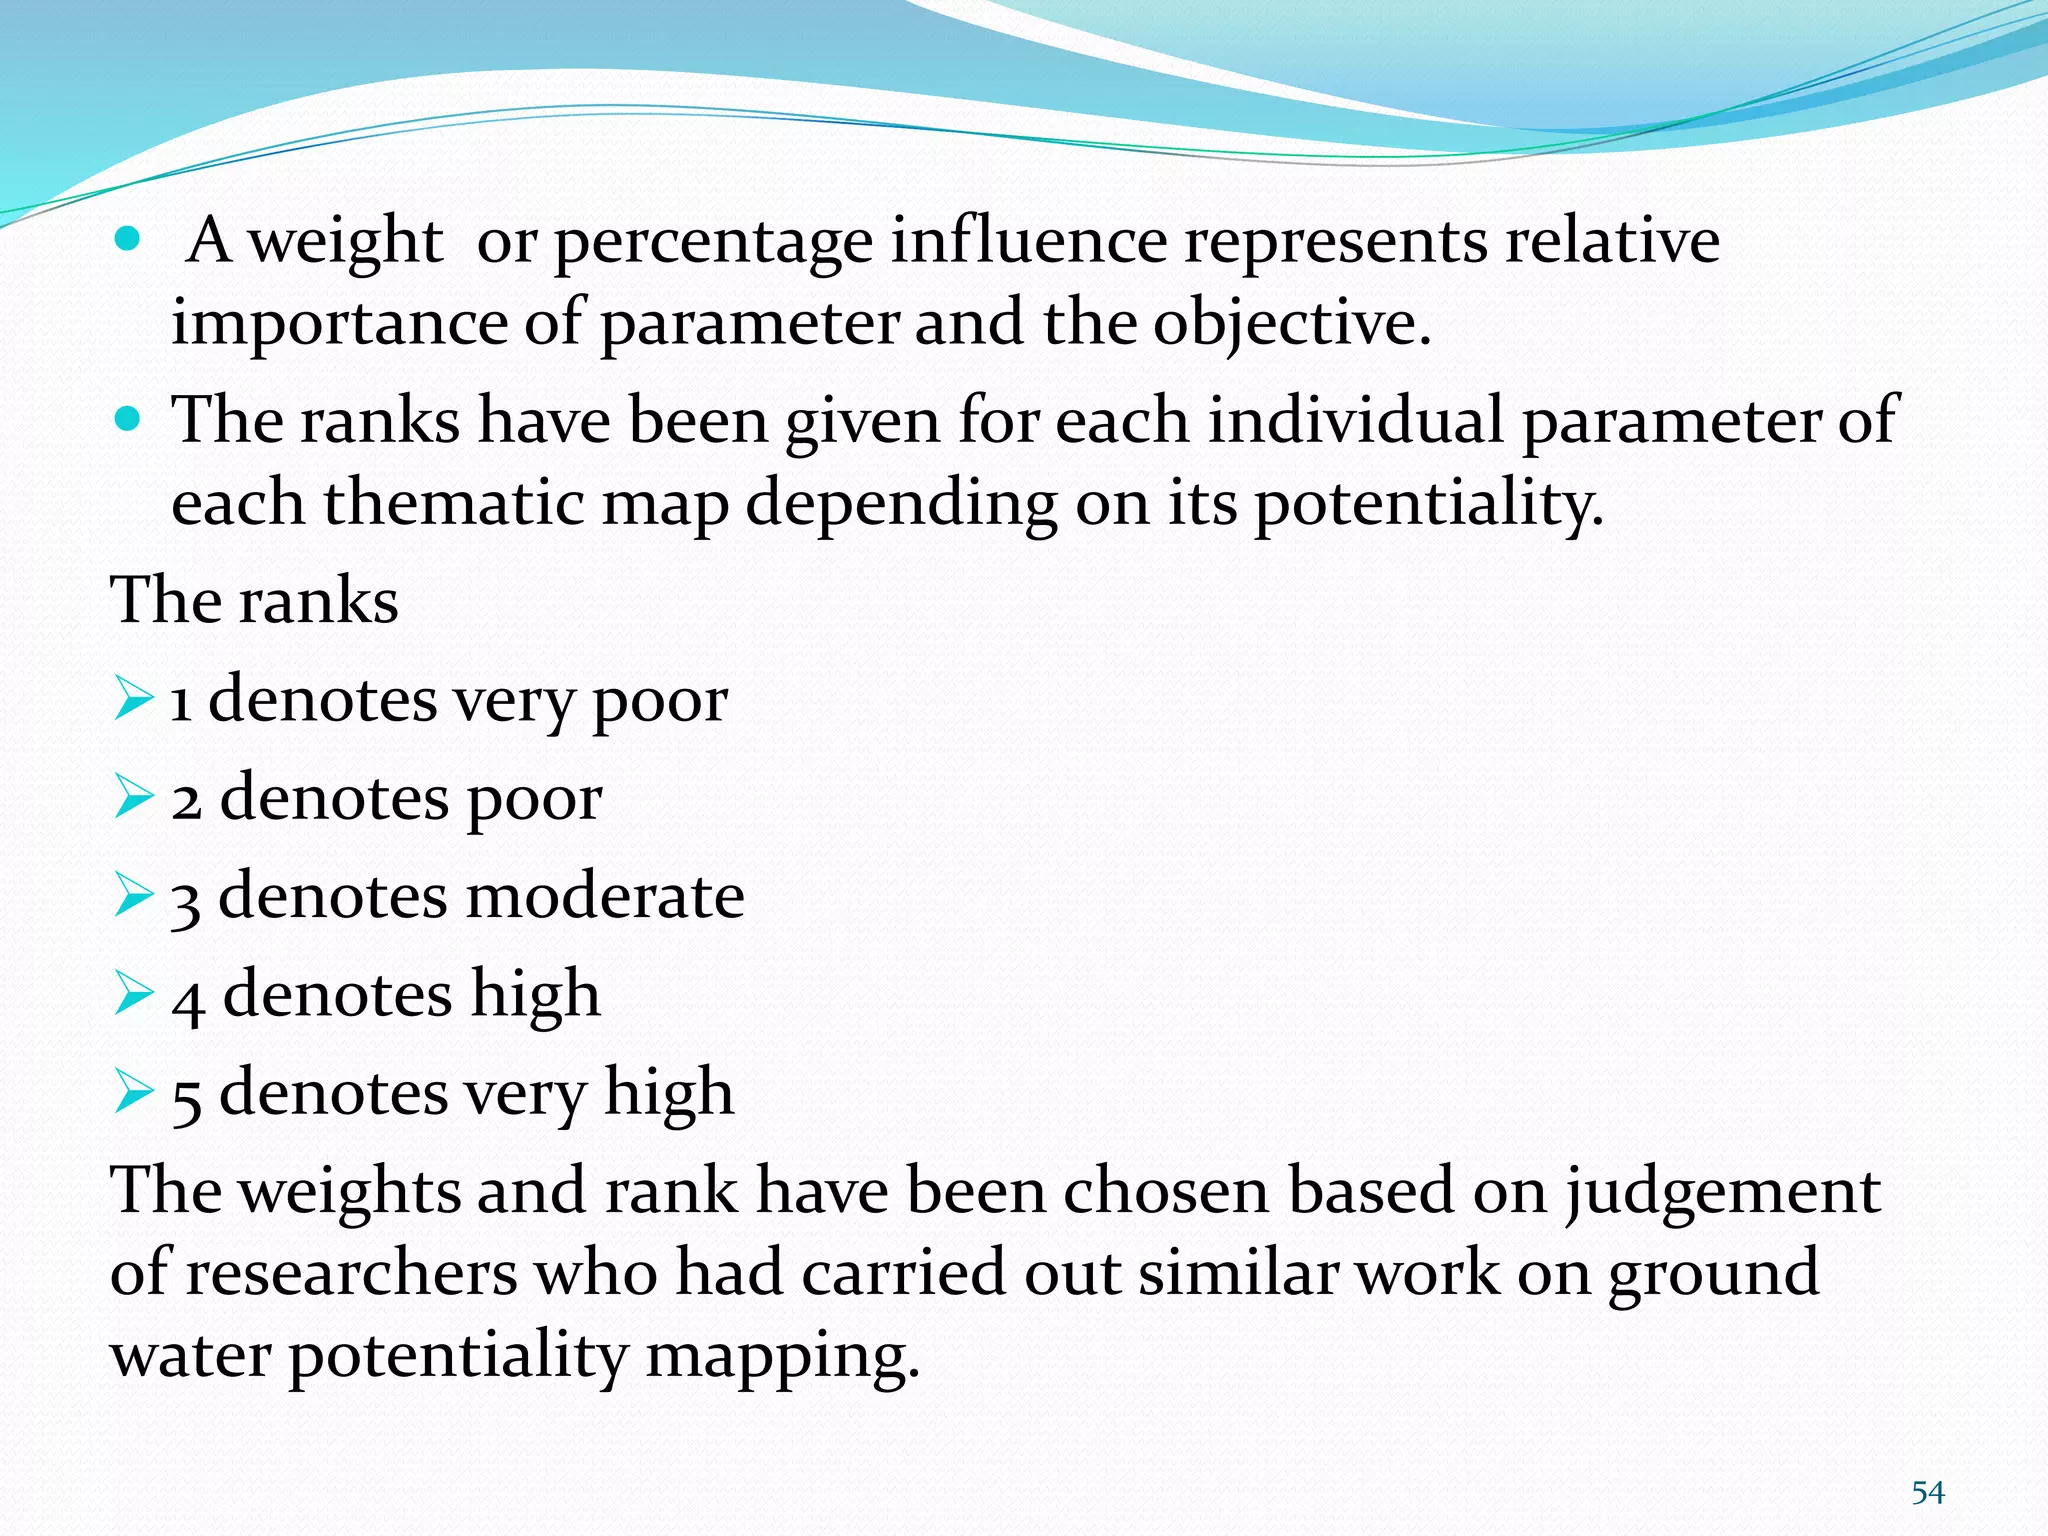
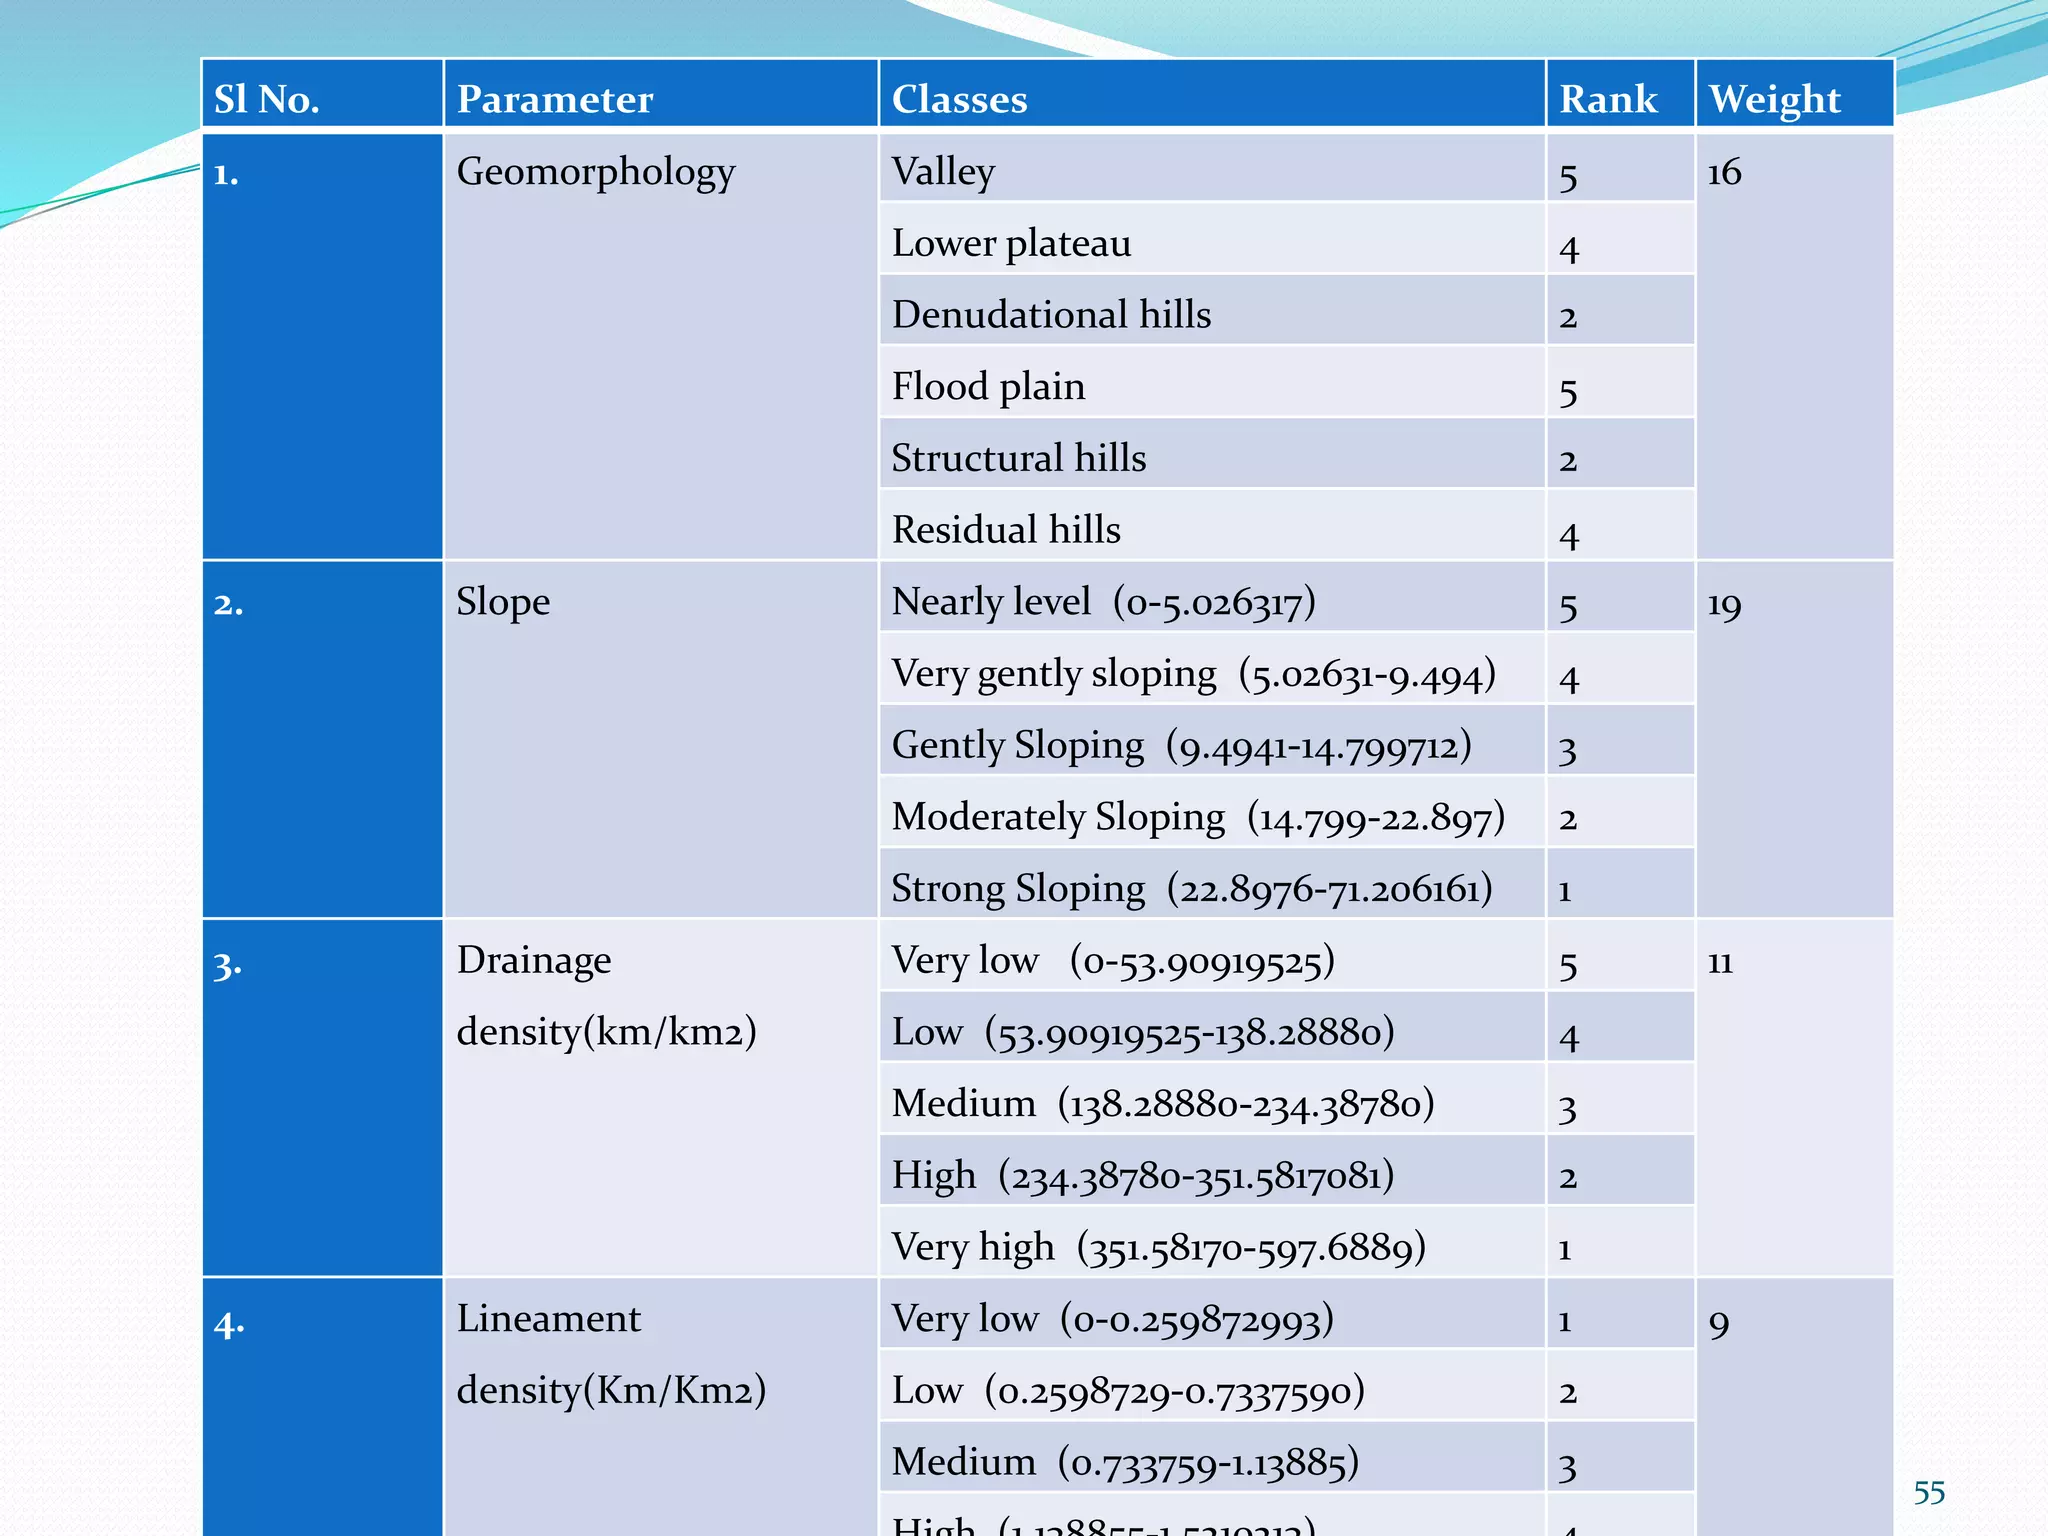
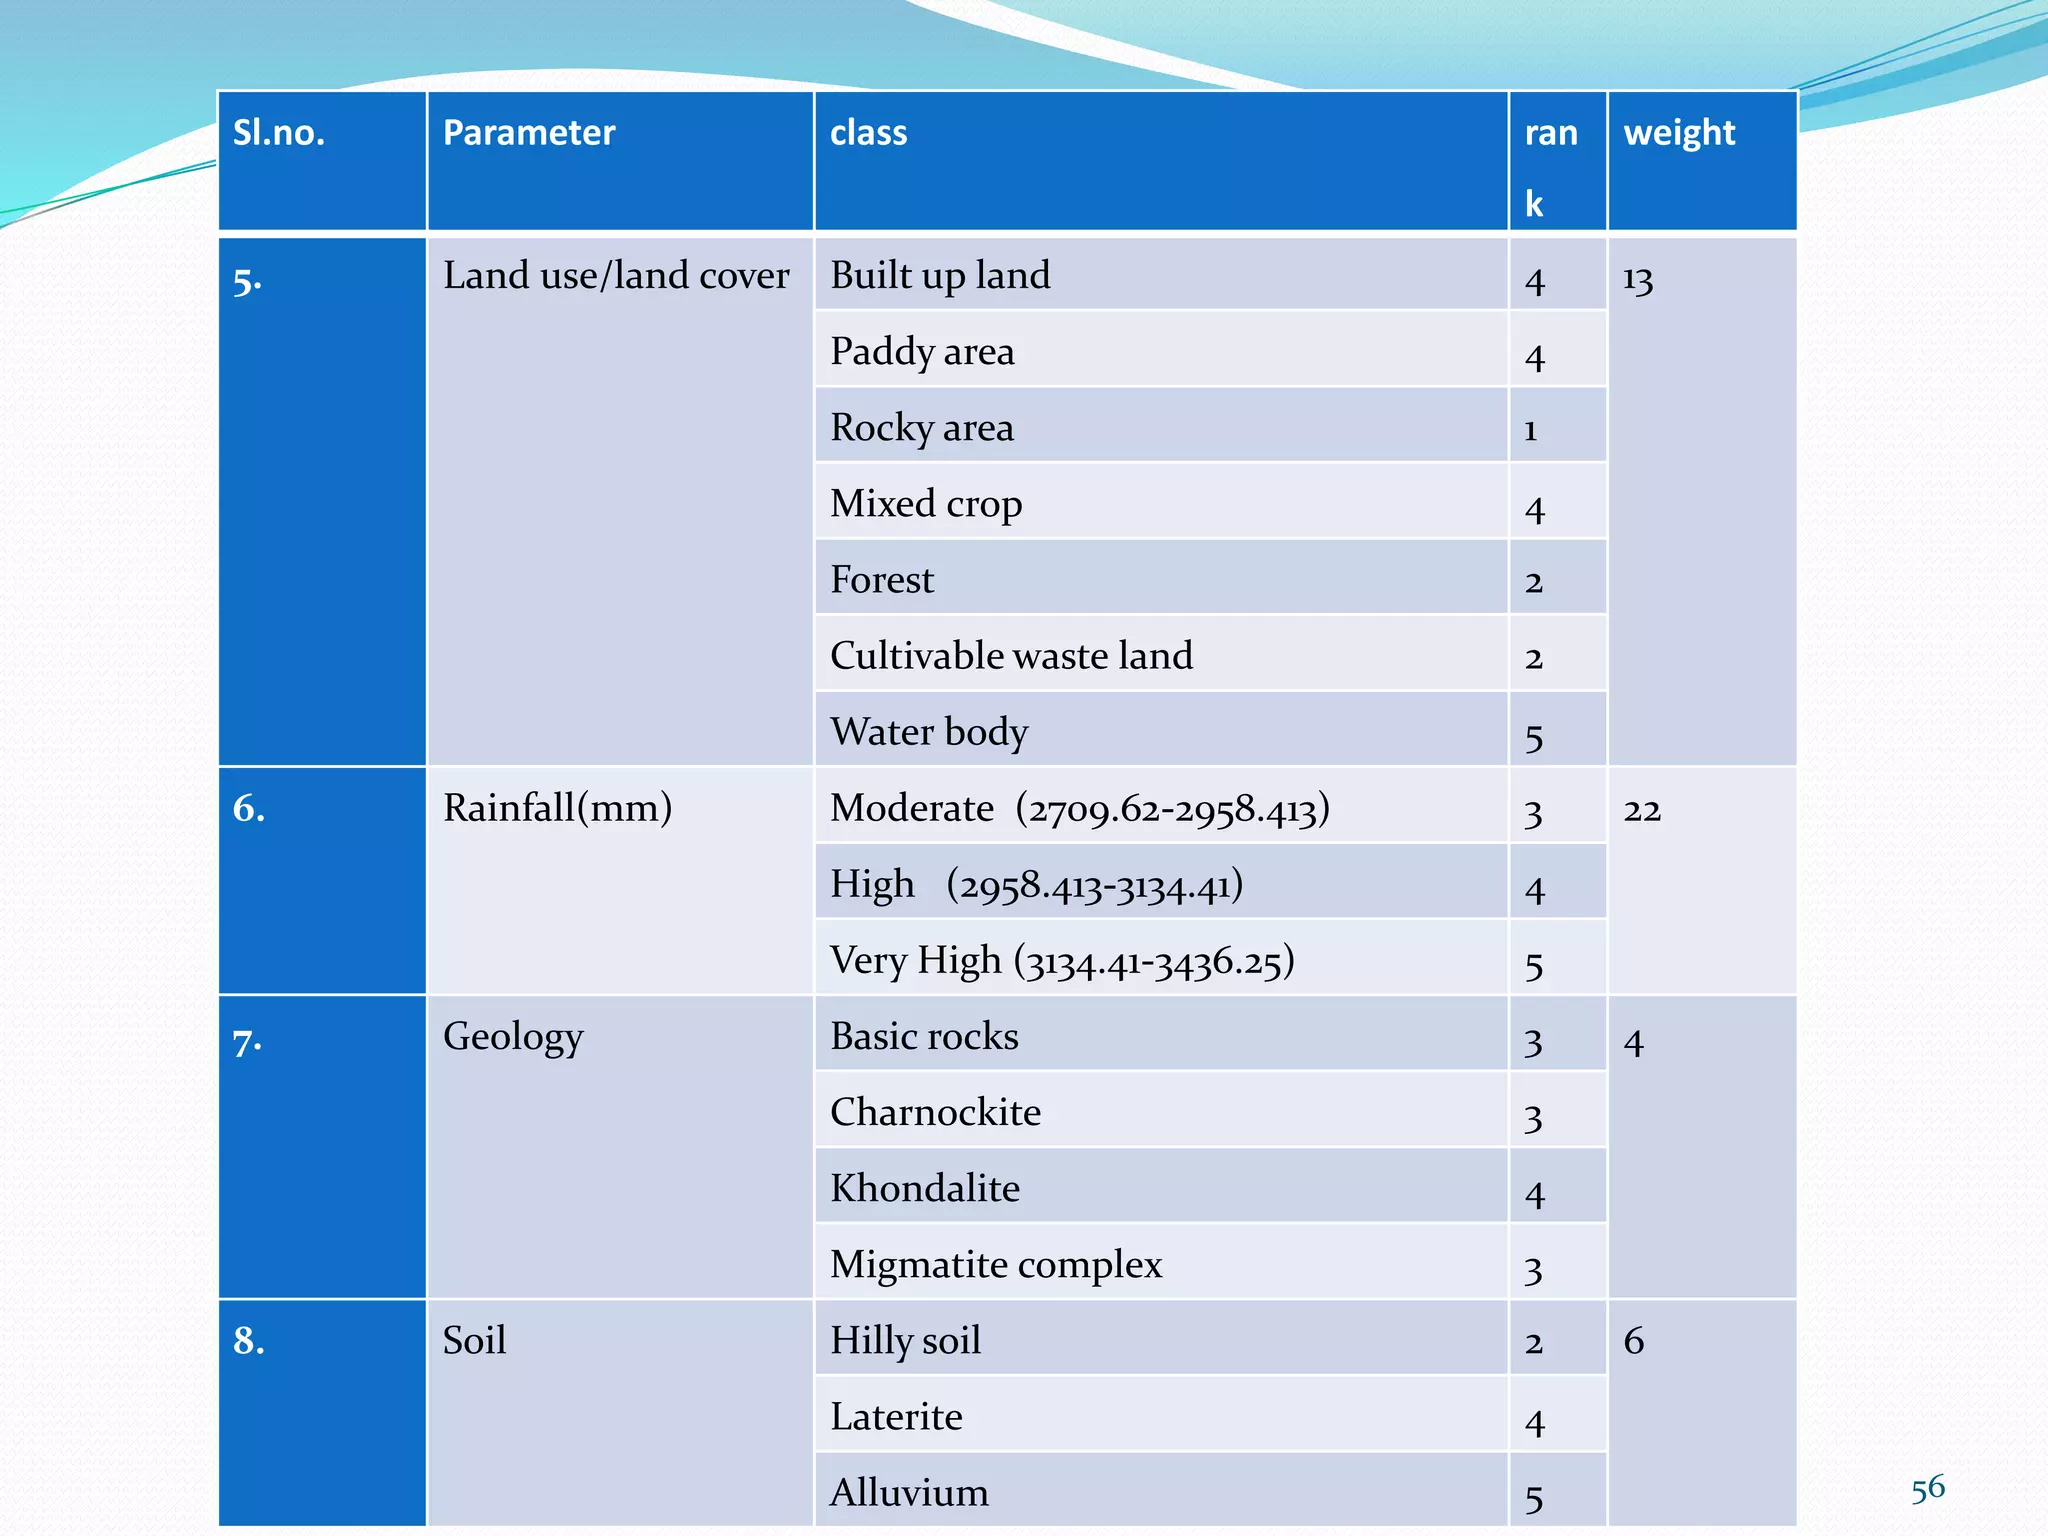
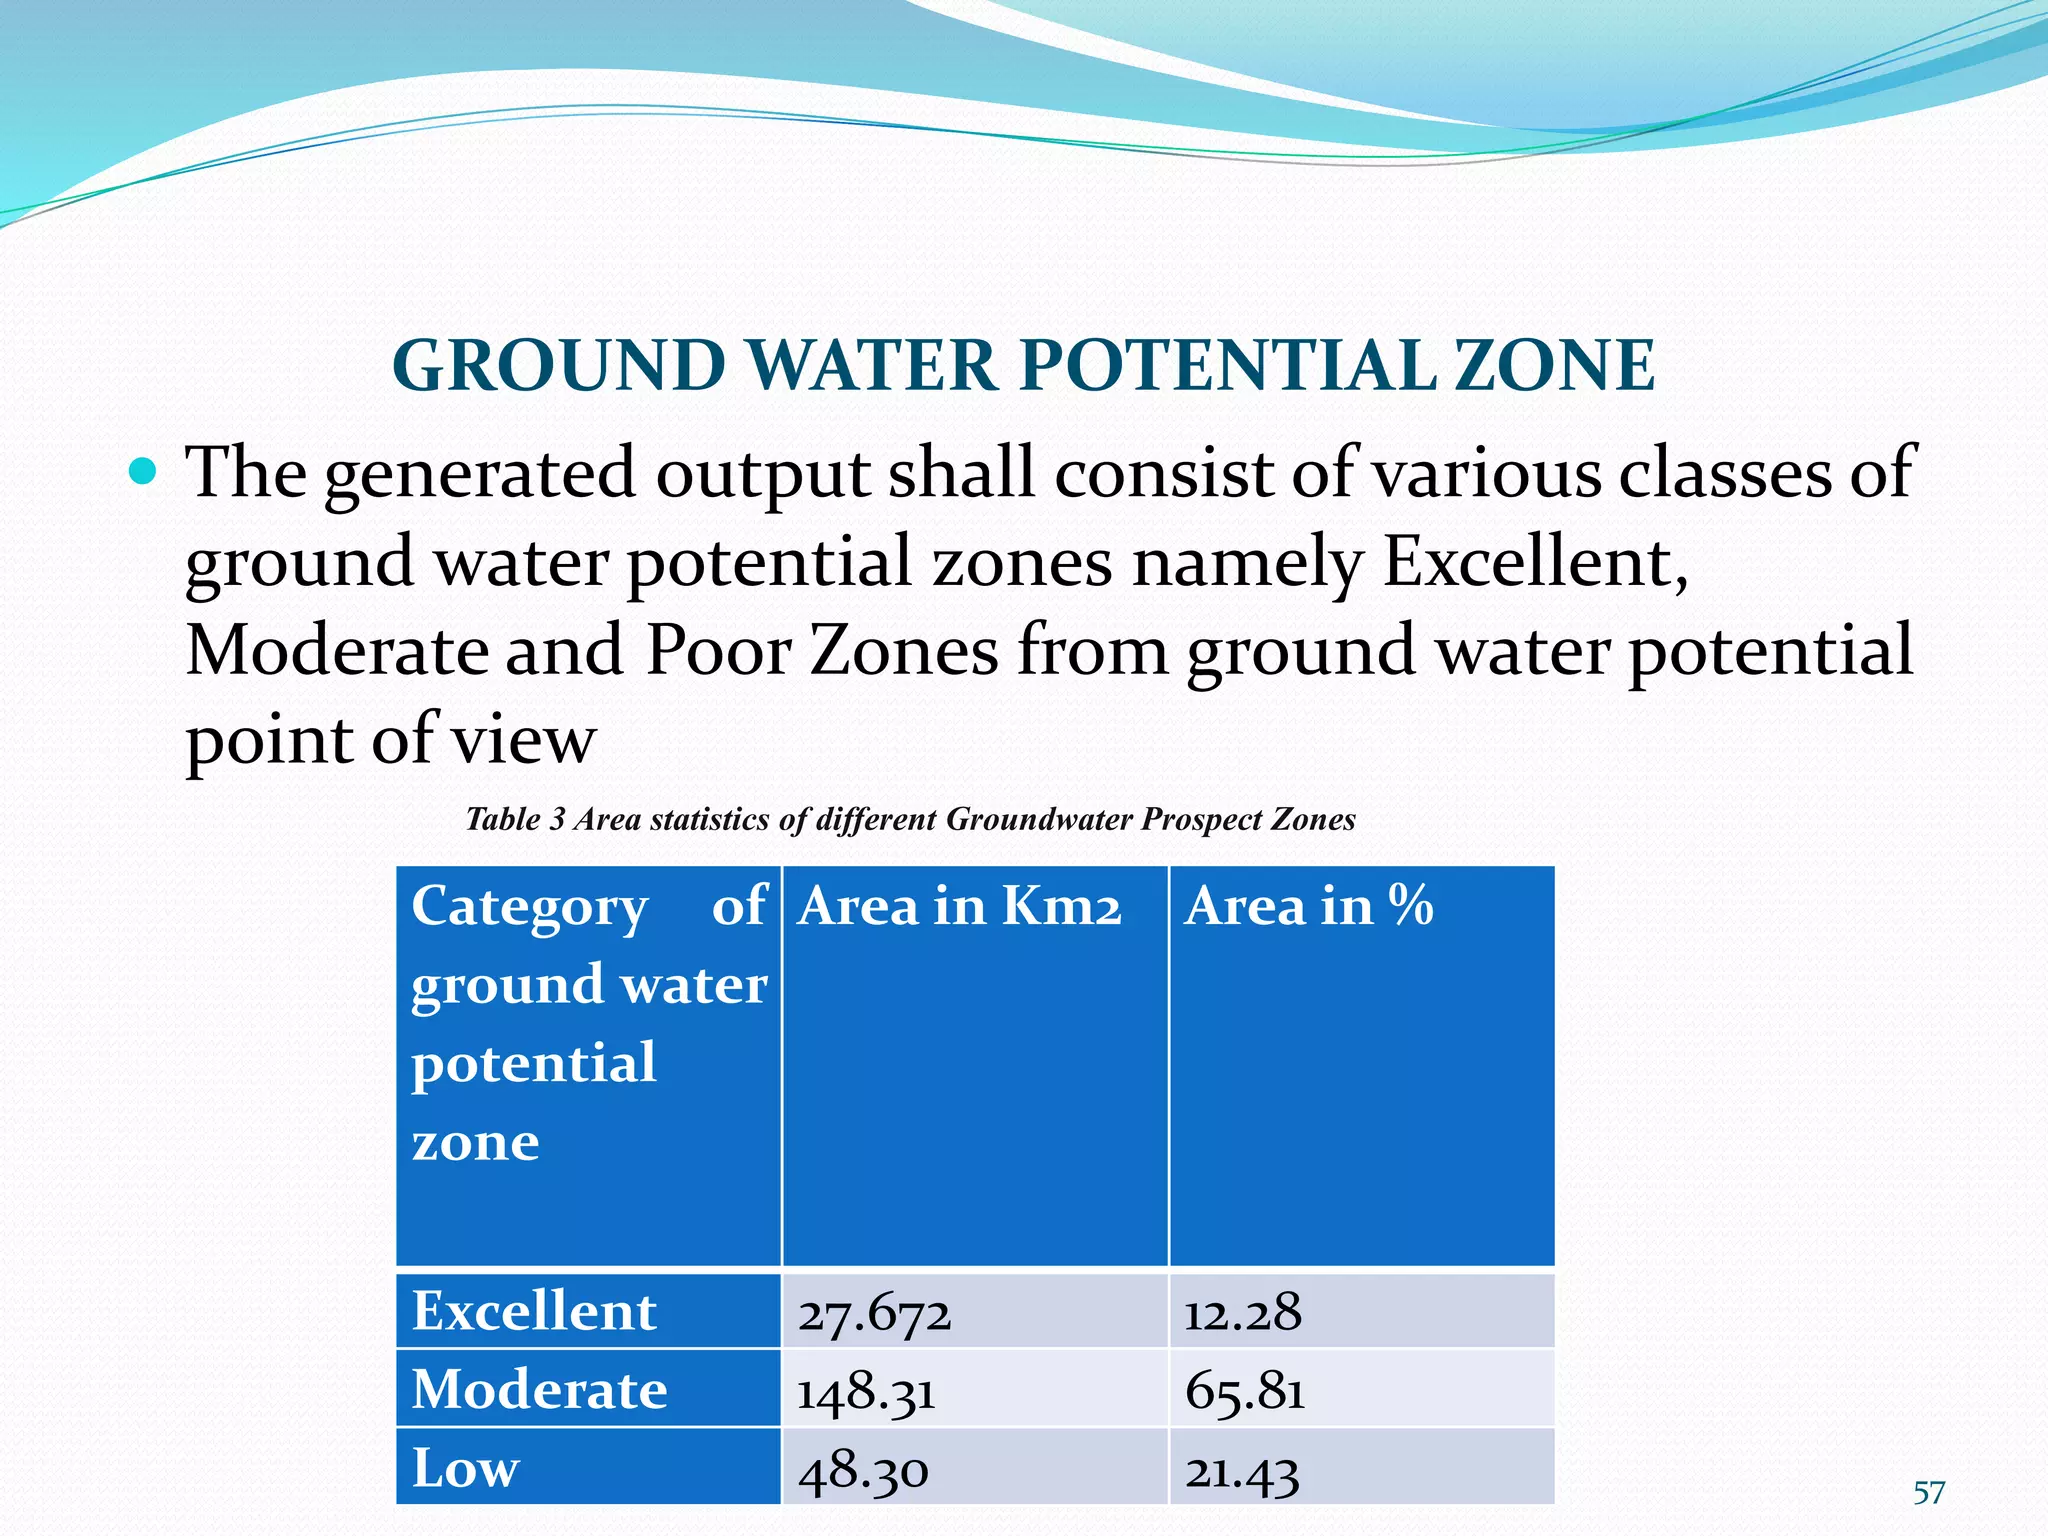
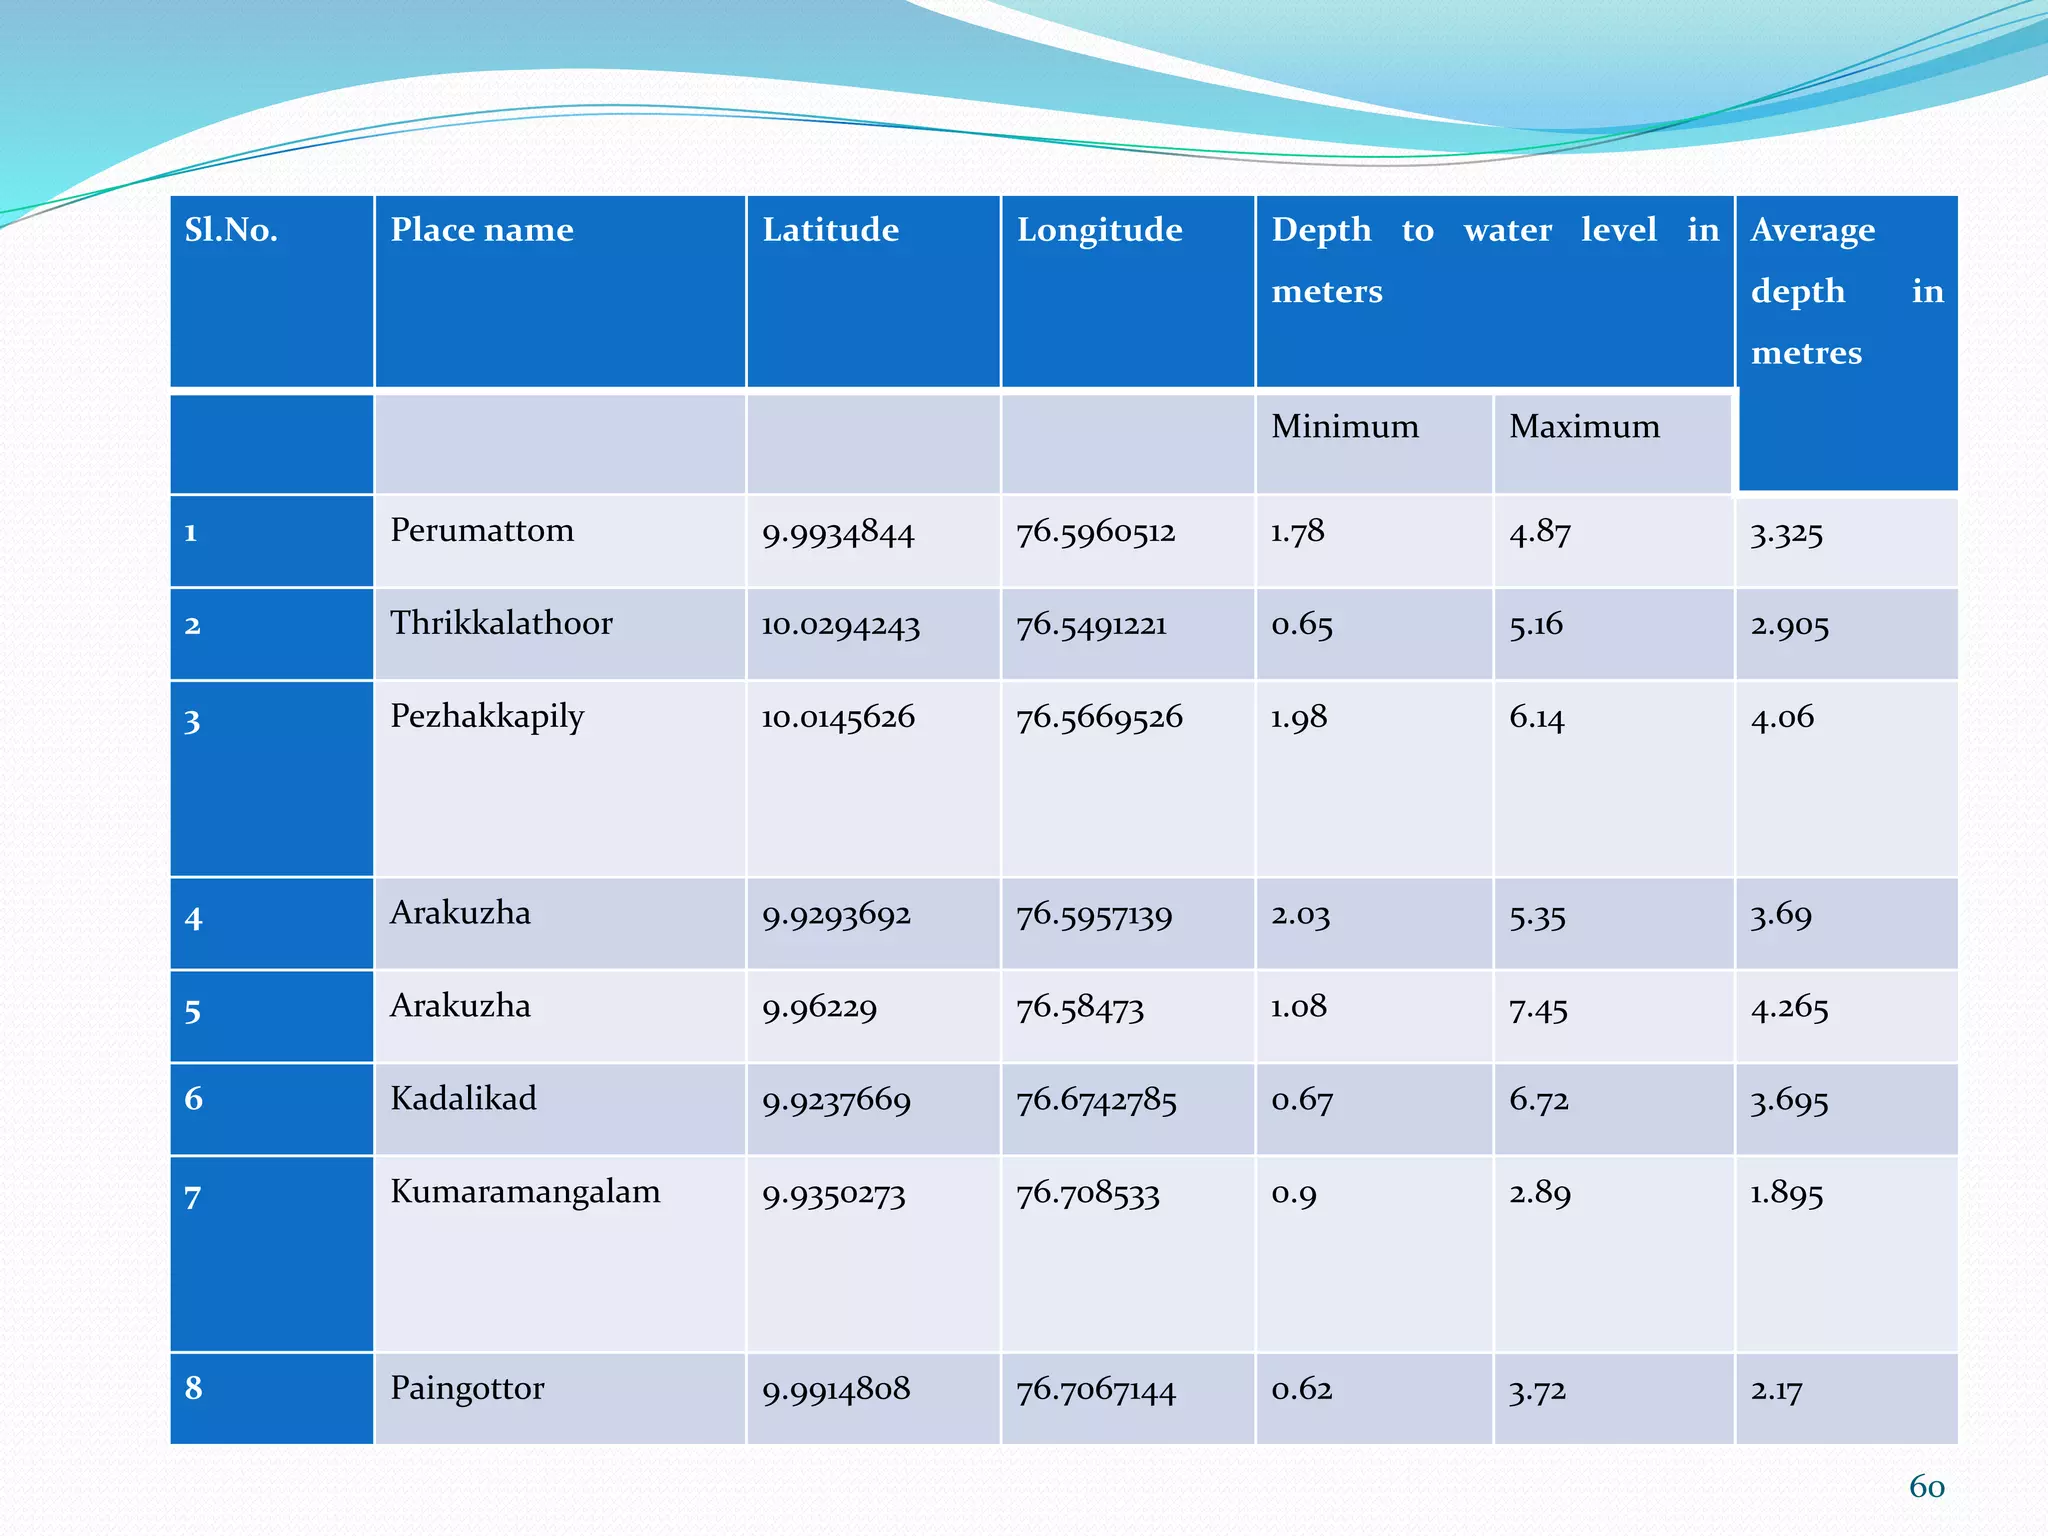
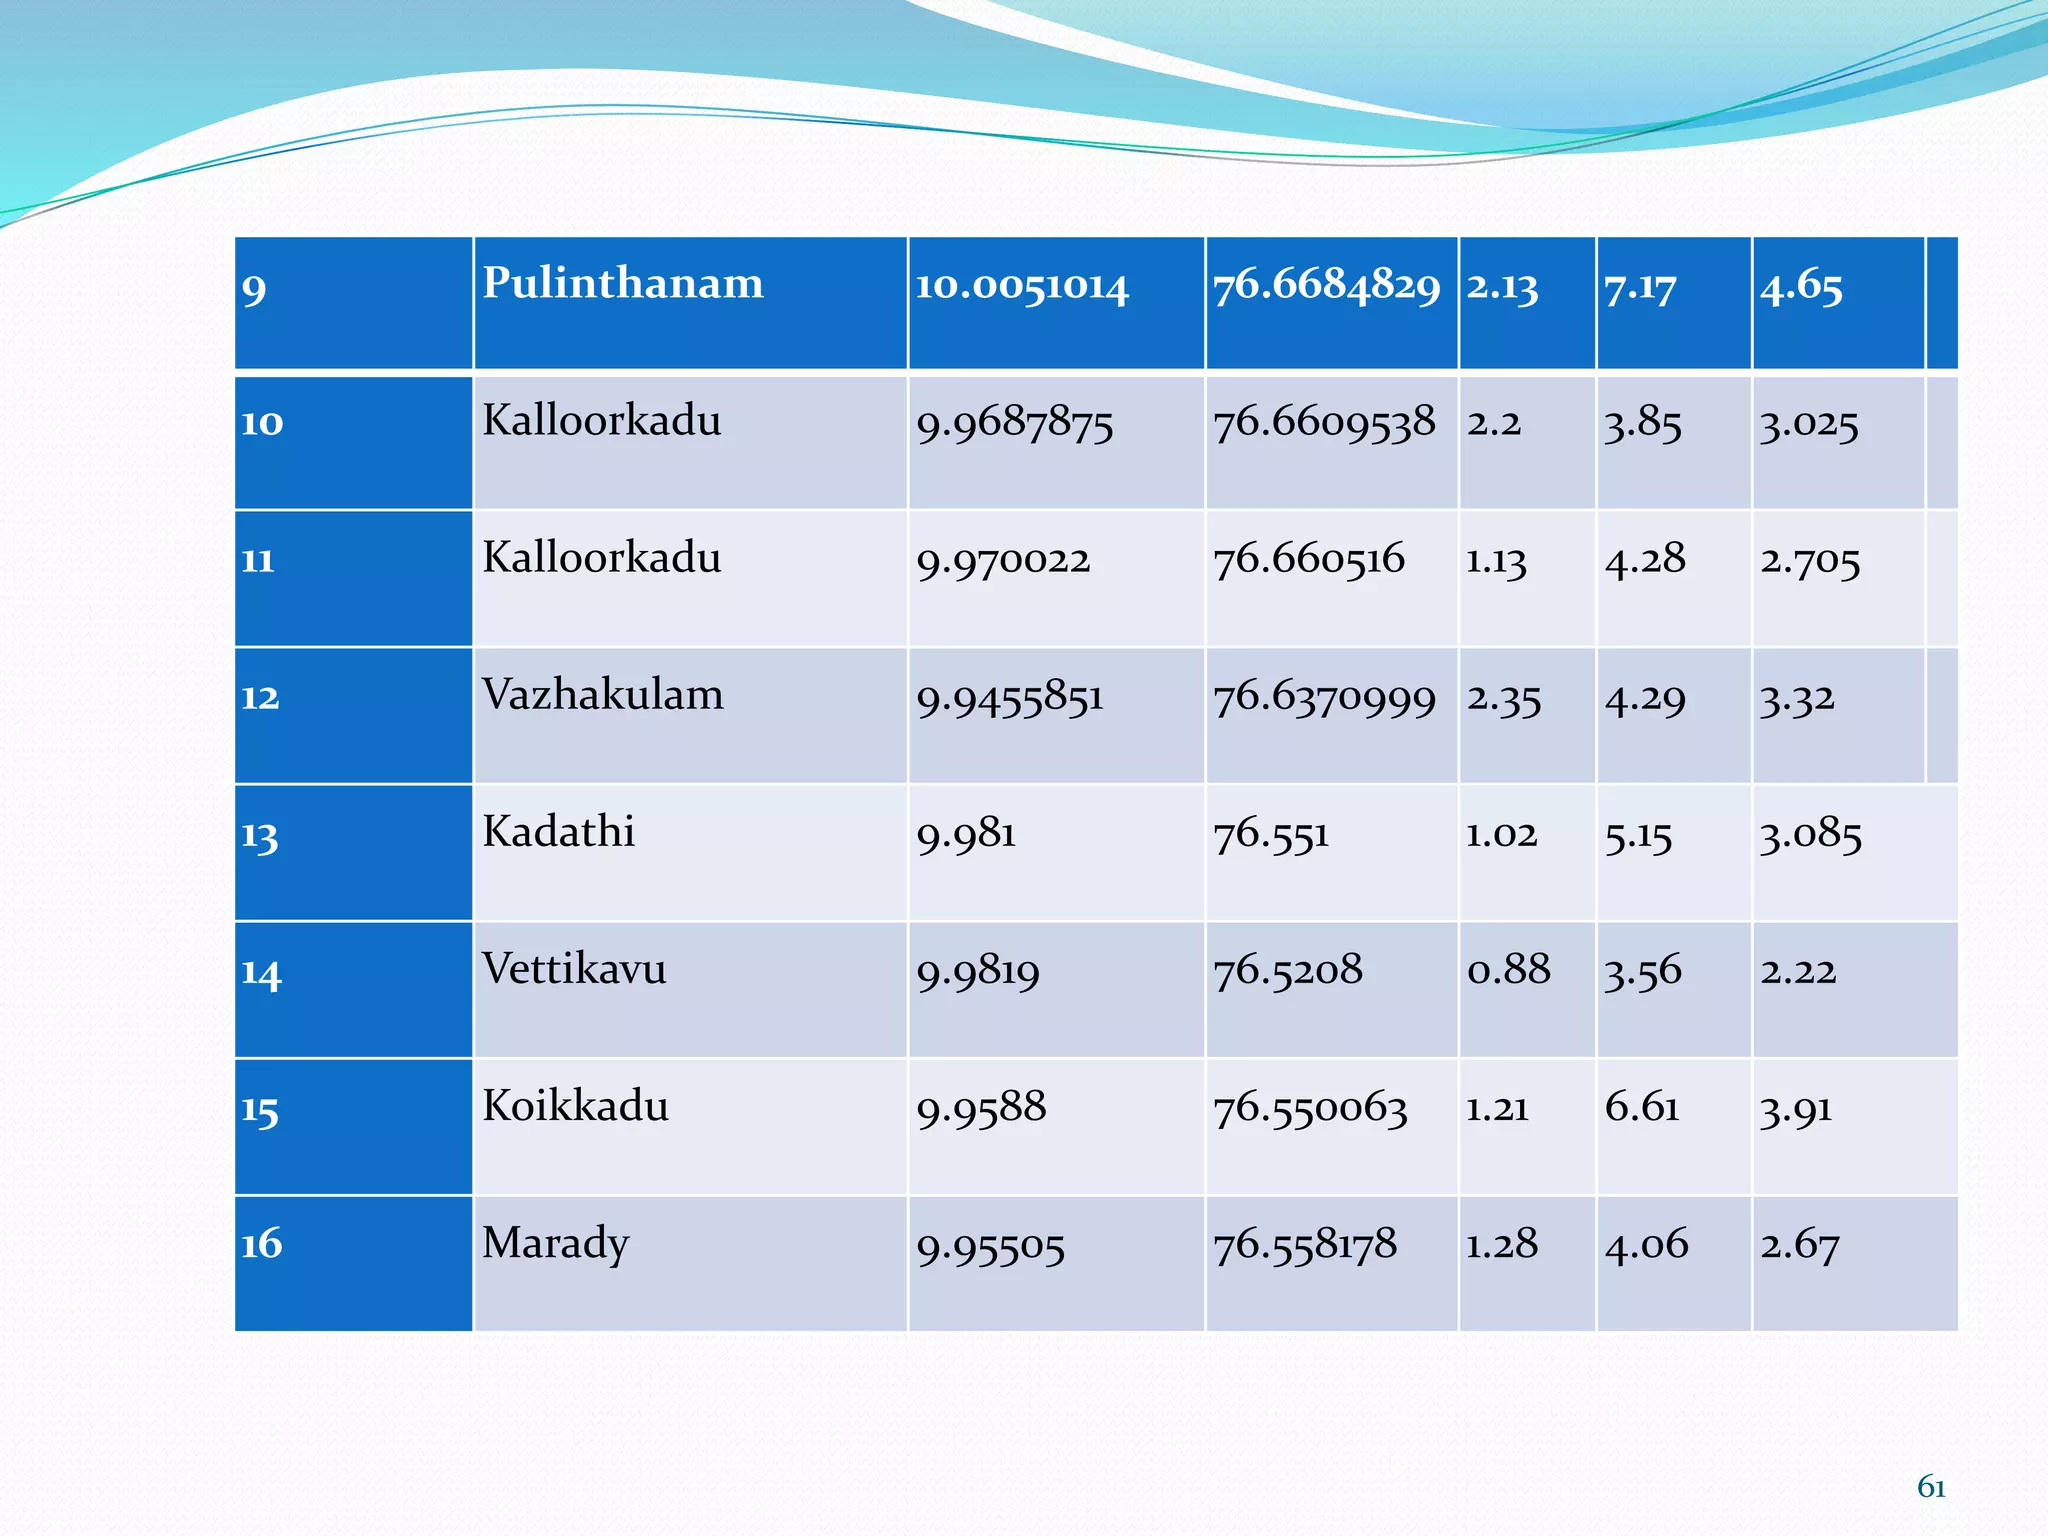
This document summarizes a study that mapped groundwater potential zones in the Muvattupuzha block of Kerala, India using GIS and remote sensing. Key factors like geology, geomorphology, lineaments, drainage density, rainfall, land use, slope and soils were analyzed as layers in GIS. Weighted overlay analysis was used to delineate excellent, moderate and poor groundwater potential zones. Validation with field data found good correlation. The study aims to aid groundwater development and management to address water scarcity in the region.
The Presentation gives the overview of the process necessary for accomplishing the task for the preparation of Ground water movements and identification carried out by Rajiv gandhi national drinking water mission project.
Iirs overview -Remote sensing and GIS application in Water Resources ManagementTushar Dholakia
Remote sensing and GIS application in Water Resources Management- By S.P. Aggarval spa@iirs.gov.in Indian Institute of Remote sensing ISRO, Department of space, Dehradun
Introduction
Water resources of India at a glance
Hydrogeological cycle
Exploration of groundwater
Groundwater potential zone
Indicators
Sensors
Rules for selection of imagery
Conclusion
Reference
Digital Elevation Model (DEM) is the digital representation of the land surface elevation with respect to any reference datum. DEM is frequently used to refer to any digital representation of a topographic surface. DEM is the simplest form of digital representation of topography. GIS applications depend mainly on DEMs, today.
Identification of Groundwater Potential Zones in Vaippar Basin, Tamil Nadu, I...SagarChougule11
Groundwater is prominent part of the earth’s fresh water as well as main source of drinking water and survival source for many lives on earth. Groundwater potential zone identification can be done using advanced as well as recently developed geospatial technology such as Remote Sensing and GIS. GIS technology is useful for capturing, storing, and analyzing spatial data with the help of computer programming techniques. Here in identification of groundwater potential zone using of spatial elements which are related for infiltration of water into ground. For the groundwater potential zone analysis using of spatial layers like geology, geomorphology, rainfall, lineament, land use/land cover, drainage density, soil texture, soil depth etc.
This document help you to prepare Triangulation Network (TIN), Hillshade Map, Slope map, interpolation and Digital Elevation Model (DEM) in a area and how to interpret them.
For a new better version of this tutorial see my Google Slides with embedded videos.
https://docs.google.com/presentation/d/1MftEOT3uvYpCVwUaLMhsesm5Que-Kr7GQRV4pKZ2SNQ/edit?usp=sharing
This is a 2019 tutorial on how to do watershed delineation using ArcMap 10. It is an open education resource. Please let me know if you find it useful or see something that could be improved. Feel free to use it for teaching Geographic Information Science.
Evaluation of morphometric parameters derived from Cartosat-1 DEM using remot...Dr Ramesh Dikpal
The quantitative analysis of drainage system is
an important aspect of characterization of watersheds.
Using watershed as a basin unit in morphometric analysis
is the most logical choice because all hydrological and
geomorphic processes occur within the watershed. The
Budigere Amanikere watershed a tributary of Dakshina
Pinakini River has been selected for case illustration.
Geoinformatics module consisting of ArcGIS 10.3v and
Cartosat-1 Digital Elevation Model (DEM) version 1 of
resolution 1 arc Sec (*32 m) data obtained from Bhuvan
is effectively used. Sheet and gully erosion are identified in
parts of the study area. Slope in the watershed indicating
moderate to least runoff and negligible soil loss condition.
Third and fourth-order sub-watershed analysis is carried
out. Mean bifurcation ratio (Rb) 3.6 specify there is no
dominant influence of geology and structures, low drainage
density (Dd) 1.12 and low stream frequency (Fs) 1.17
implies highly infiltration subsoil material and low runoff,
infiltration number (If)1.3 implies higher infiltration
capacity, coarse drainage texture (T) 3.40 shows high
permeable subsoil, length of overland flow (Lg) 0.45
indicates under very less structural disturbances, less runoff
conditions, constant of channel maintenance (C) 0.9 indicates
higher permeability of subsoil, elongation ratio (Re)
0.58, circularity ratio (Rc) 0.75 and form factor (Rf) 0.26
signifies sub-circular to more elongated basin with high
infiltration with low runoff. It was observed from the
hypsometric curves and hypsometric integral values of the
watershed along with their sub basins that the drainage
system is attaining a mature stage of geomorphic development.
Additionally, Hypsometric curve and hypsometric
integral value proves that the infiltration capacity is high as
well as runoff is low in the watershed. Thus, these mormometric
analyses can be used as an estimator of erosion
status of watersheds leading to prioritization for taking up
soil and water conservation measures.
Watershed delineation and LULC mappingKapil Thakur
Watershed Delineation - a watershed as an enormous bowl. As water falls onto the bowl’s rim, it either flows down the inside of the bowl or down the outside of the bowl. The rim of the bowl or the watershed boundary is sometimes referred to as the ridgeline or watershed divide. This ridge line separates one watershed from
another.
Topographic maps created by the United States Geological Survey can help you to determine a watershed’s boundaries.
Land use and land cover map (LULC Mapping) -
Land cover indicates the physical land type such as forest or open water whereas land use documents how people are using the land. … Land cover maps provide information to help managers best understand the current landscape. To see change over time, land cover maps for several different years are needed.
Delineation of potential groundwater recharge zones plays a vital role in sustainable management of groundwater resources. The present study is carried out to identify the groundwater potential recharge zones in Multan, Pakistan by using Remote Sensing (RS) & Geographical Information System (GIS) for augmenting groundwater resources. In Multan district (Punjab, Pakistan), the increasing population and expansion of land use for agriculture have severely exploited the regional ground water resources. Land Use Land Cover (LULC) change is an accelerating phenomenon on the surface of earth driven by anthropogenic activities including urban expansion, deforestation, and climatic variations. Intensive pumping has resulted in a rapid decline in the level of water table as well as its quality. Better management practices and artificial recharge are needed for the development of sustainable groundwater resources. In order to address these issues Geographic information system (GIS) and Remote sensing (RS) are the most efficient methods for the identification and detection of Land Use patterns. All of these techniques are used for mapping and identification of groundwater potential analysis. This groundwater potential information will be useful for the effective identification of appropriate locations for extraction of water. This study should be done to delineate groundwater potential recharge zones by using different thematic layers that were overlaid in ArcGIS. In the overlay analysis, the weights (for various thematic layers) are allocated based on a review of published literature or by expert opinion. The assigned weights are then normalized and modified using the analytical hierarchical process (AHP). The potential recharge map thus obtained and divided into four zones (poor, moderate, good, and very good) based on their influence to groundwater recharge.
Watershed management: Role of Geospatial Technologyamritpaldigra30
Watershed management is the study of the relevant characteristics of a watershed which is done to enhance watershed functions that affect the plant, animal and human or other living communities within the watershed boundary.
This PPT dscribes the Role of Geospatial Technology in Watershed Management
In developing accurate hydro geomorphological analysis, monitoring, ability to generate information in spatial and temporal domain and delineation of land features are crucial for successful analysis and prediction of groundwater resources. However, the use of RS and GIS in handling large amount of spatial data provides to gain accurate information for delineating the geological and geomorphological characteristics and allied significance, which are considered as a controlling factor for the occurrence and movement of groundwater used IRS LISS II data on 1: 50000 scale along with topographic maps in various parts of India to develop integrated groundwater potential zone
Runoff is one of the most significant hydrological variables used in most of the water resources applications. Physiographically the area is characterized by undulating topography with plains and valleys. The Soil Conservation Service Curve Numbers also known as hydrologic soil group method were used in this study. This method is adaptable and suitable approach for quick runoff estimation and is approximately easy to use with minimum data and it gives good result. From the study yearly rainfall and runoff were estimated easily. The study area covers an area of 466.02 km2, having maximum length of 36.5 km. The maximum and minimum elevation of the basin is 569 m and 341 m above MSL, respectively.
Scale-dependency and Sensitivity of Hydrological Estimations to Land Use and ...Beniamino Murgante
Scale-dependency and Sensitivity of Hydrological Estimations to Land Use and Topography for a Coastal Watershed in Mississippi - Vladimir J. Alarcon and Charles G. O’Hara
Mapping the Wind Power Density and Weibull Parameters for Some Libyan Citiesinventionjournals
In order to introduce a well-informed decision regarding positioning of wind farm projects, prior intensive data collection, processing, and analysis are required. In this paper, wind data of twenty-five Libyan cities has been collected, processed, and analyzed to determine Weibull distribution parameters and the wind energy density for each of the twenty-five cities. The study is based on a recorded historical data from NASA of air temperature, barometric pressure, and wind speed for ten years along the period from January 1 st, 2005 to December 31st, 2014. The data used are the daily average values for each of the three parameters. Three methods have been used to estimate Weibull parameters namely: 1) the power density method, 2) the maximum likelihood method, and 3) the moment method. The goodness-of-fit for each method is, then, compared using the mean absolute error and the root mean square error methods. Lack of information regarding wind energy surveys for this particular region was one of the key factors in conducting such a comprehensive analysis.
William John Macquorn Rankine, (born July 5, 1820, Edinburgh, Scot.—died Dec. 24, 1872, Glasgow), Scottish engineer and physicist and one of the founders of the science of thermodynamics, particularly in reference to steam-engine theory.
Trained as a civil engineer under Sir John Benjamin MacNeill, Rankine was appointed to the Queen Victoria chair of civil engineering and mechanics at the University of Glasgow (1855). One of Rankine’s first scientific works, a paper on fatigue in metals of railway axles (1843), led to new methods of construction. His Manual of Applied Mechanics (1858) was of considerable help to designing engineers and architects. His classic Manual of the Steam Engine and Other Prime Movers (1859) was the first attempt at a systematic treatment of steam-engine theory. Rankine worked out a thermodynamic cycle of events (the so-called Rankine cycle) used as a standard for the performance of steam-power installations in which a condensable vapour provides the working fluid.
Utilization of jarosite generated from leadtp jayamohan
Large quantities of industrial waste by-products are produced in India by different type of industries viz. Jarosite, Jarofix, Copper slag, Zinc slag, Red mud, Steel slag and Coal ash. For many years these materials were considered as waste and were dumped haphazardly near the producing plants. Efforts are being carried out by research studies to utilize these materials in embankment, sub base and base layers of road construction. Experimental studies have been also carried out to investigate their feasibility as an additive in cement concrete. Jarosite material is produced during extraction of zinc ore concentrate by hydrometallurgy operation. When zinc ore concentrate is roasted at 9000 C and subjected to leaching, Jarosite is formed as a waste material. The Jarosite material is mixed with 2 % lime and 10 % cement and transported to the disposal area as a Jarofix material.
Tall structures are ;
Flexible, low in damping, slender and light in weight.
Sensitive to dynamic wind loads.
Adversely affect the serviceability and occupant comfort.
Oscillations are observed in the along-wind and crosswind directions and in torsional mode.
Behaviour of wind response is largely determined by building shapes.
Aerodynamic optimization of building shapes is the most efficient way to achieve wind resistant design.
In ancient China, tall buildings appear to be those of traditional pagodas.
Abrasive jet micro-machining (AJM), in which abrasive parti-cles are accelerated by air and directed toward a target, has beenused to make components for micro-electromechanical (MEMS) and micro-fluidic capillary electrophoresis devices . One ofthe disadvantages of AJM is that the compressed air jet used topropel the erodent particles diverges significantly after the noz-zle exit, increasing the size of the blast zone and the width of thesmallest channel or hole that can be machined without the use of a patterned erosion-resistant mask that defines the micro-featureedges . Abrasive slurry jet micro-machining (ASJM) is similar to AJM except that pressurized water, instead of air, is used to accel-erate the suspended abrasive particles such as garnet or alumina(Al2O3). In both AJM and ASJM, the material removal occurs by ero-sion. However, for the same jet dimension and flow speed, slurryjets have a much lower divergence angle than air jets , allow-ing for the micro-machining of small features without the use ofpatterned masks.
Dynamic analysis is the primary component in all types of construction, usually in areas of high earthquake activity.
Dam is the structure which is designed in such a way that its own weight resist the external forces.
The behaviour of the dam is greatly influenced by the foundation conditions.
• Considering soil-structure interaction makes a structure more flexible and thus, increasing the natural period of the structure compared to the corresponding rigidly supported structure
Hybrid optimization of pumped hydro system and solar- Engr. Abdul-Azeez.pdffxintegritypublishin
Advancements in technology unveil a myriad of electrical and electronic breakthroughs geared towards efficiently harnessing limited resources to meet human energy demands. The optimization of hybrid solar PV panels and pumped hydro energy supply systems plays a pivotal role in utilizing natural resources effectively. This initiative not only benefits humanity but also fosters environmental sustainability. The study investigated the design optimization of these hybrid systems, focusing on understanding solar radiation patterns, identifying geographical influences on solar radiation, formulating a mathematical model for system optimization, and determining the optimal configuration of PV panels and pumped hydro storage. Through a comparative analysis approach and eight weeks of data collection, the study addressed key research questions related to solar radiation patterns and optimal system design. The findings highlighted regions with heightened solar radiation levels, showcasing substantial potential for power generation and emphasizing the system's efficiency. Optimizing system design significantly boosted power generation, promoted renewable energy utilization, and enhanced energy storage capacity. The study underscored the benefits of optimizing hybrid solar PV panels and pumped hydro energy supply systems for sustainable energy usage. Optimizing the design of solar PV panels and pumped hydro energy supply systems as examined across diverse climatic conditions in a developing country, not only enhances power generation but also improves the integration of renewable energy sources and boosts energy storage capacities, particularly beneficial for less economically prosperous regions. Additionally, the study provides valuable insights for advancing energy research in economically viable areas. Recommendations included conducting site-specific assessments, utilizing advanced modeling tools, implementing regular maintenance protocols, and enhancing communication among system components.
Hierarchical Digital Twin of a Naval Power SystemKerry Sado
A hierarchical digital twin of a Naval DC power system has been developed and experimentally verified. Similar to other state-of-the-art digital twins, this technology creates a digital replica of the physical system executed in real-time or faster, which can modify hardware controls. However, its advantage stems from distributing computational efforts by utilizing a hierarchical structure composed of lower-level digital twin blocks and a higher-level system digital twin. Each digital twin block is associated with a physical subsystem of the hardware and communicates with a singular system digital twin, which creates a system-level response. By extracting information from each level of the hierarchy, power system controls of the hardware were reconfigured autonomously. This hierarchical digital twin development offers several advantages over other digital twins, particularly in the field of naval power systems. The hierarchical structure allows for greater computational efficiency and scalability while the ability to autonomously reconfigure hardware controls offers increased flexibility and responsiveness. The hierarchical decomposition and models utilized were well aligned with the physical twin, as indicated by the maximum deviations between the developed digital twin hierarchy and the hardware.
Student information management system project report ii.pdfKamal Acharya
Our project explains about the student management. This project mainly explains the various actions related to student details. This project shows some ease in adding, editing and deleting the student details. It also provides a less time consuming process for viewing, adding, editing and deleting the marks of the students.
Immunizing Image Classifiers Against Localized Adversary Attacksgerogepatton
This paper addresses the vulnerability of deep learning models, particularly convolutional neural networks
(CNN)s, to adversarial attacks and presents a proactive training technique designed to counter them. We
introduce a novel volumization algorithm, which transforms 2D images into 3D volumetric representations.
When combined with 3D convolution and deep curriculum learning optimization (CLO), itsignificantly improves
the immunity of models against localized universal attacks by up to 40%. We evaluate our proposed approach
using contemporary CNN architectures and the modified Canadian Institute for Advanced Research (CIFAR-10
and CIFAR-100) and ImageNet Large Scale Visual Recognition Challenge (ILSVRC12) datasets, showcasing
accuracy improvements over previous techniques. The results indicate that the combination of the volumetric
input and curriculum learning holds significant promise for mitigating adversarial attacks without necessitating
adversary training.
Welcome to WIPAC Monthly the magazine brought to you by the LinkedIn Group Water Industry Process Automation & Control.
In this month's edition, along with this month's industry news to celebrate the 13 years since the group was created we have articles including
A case study of the used of Advanced Process Control at the Wastewater Treatment works at Lleida in Spain
A look back on an article on smart wastewater networks in order to see how the industry has measured up in the interim around the adoption of Digital Transformation in the Water Industry.
3. Groundwater is the water located beneath the earth’s
surface in soil pore spaces & fractures of rock formation
Ground water prospect zonation means identifying and
mapping the prospective ground water zones in an area by
qualitative assessment of controlling factors.
INTRODUCTION
3
4. Mapping of
Ground
Water
Potential
zones
Identification
of GPZ aid in
development &
utilization of
groundwater &
surface water
resources
Eliminates
water scarcity
& improve
the irrigation
practices
Increase
agricultural
income &
standard of
living
4
5. GIS is a very powerful tool for processing, analyzing &
integrating spatial data sets.
Remote sensing serves as the preliminary inventory
method to understand the groundwater
prospects/conditions.
GIS & Remote
Sensing
5
6. GIS gives
valuable data on
geology,
geomorphology,
lineaments &
slope
Help in
systematic
integration of
data for
exploration &
delineation of
potential zones
With the
advent of RS &
GIS
technologies,
the mappings
of potential
zones is easier
6
8. STUDY AREA
Study area selected in this study is Muvattupuzha block
which is situated near Muvattupuzha river basin.
It is having an area of 225.36 sq.km.
Muvattupuzha river is one of the major perennial rivers in
central Kerala.
8
10. Why Muvattupuzha?
Muvattupuzha has got varied topography.
Muvattupuzha receives ample rainfall, still it faces water scarcity,
at times.
So far, according to our concern, it is one the best blocks with
varied topography and also,the one which is located nearer to our
residing points. Hence it is convinient for us in every ways.
10
12. Authors Year Review
Surajith Murasingh,
Ramakar jha
2013 Various groundwater
potential zones in Tensa
valley, India have been
delineated using RS sensing
and GIS techniques.The
layers such as base, DEM,
drainage density, contour,
land use, lineament density
etc were used and finally the
GIS weighted overlay
analysis was done.
Y. Yaswanth Kumar, D.V.
Satyanarayana Moorthy, G.
Shanmuka Srinivas
2017 The Digital Elevation Model
(DEM) has been generated
from the 20 m contour
interval contour lines
derived from SOI
toposheets. The layers used
were the same as above.
12
13. Baswadraj D.B. et.al 2016 Conducted a case study to
find out the groundwater
potential zones in
Dodahalla Watershed,
Belagavi
andKarnataka.The layers
used were the same and
the final GIS weighted
overlay analysis was done.
Preeja K. R et al 2011 The same layers were
gathered from Landsat ETM
+ data and Survey of India
(SOI)toposheets of scale
1:50,000 .
N.S. Magesh et al 2011 Various ground water
potential zones has been
delineated in the Theni
district of Tamil Nadu .The
layers used were the same
and the final GIS weighted
overlay analysis was done.13
14. SOFTWARE USED
ArcGIS 10.3 of Esri was used as the spatial platform for
integrating various maps.
ArcGIS deals with information on location patterns of
features and their attributes.
14
16. Collateral Data
GIS Weighted Overlay Analysis
Ground Water Potential Map
Validation
Geology
Geology
Lineament
density
Drainage
Drainage
Density
Slope
Rainfall
Soil
Satellite
16
DEM
Geomorphology
LULC
Water Depth
Field
Data
GWD
Data
Interpolation
17. 17
Details of data Collected:
• Digital Elevation Model (DEM) was obtained from ASTER
and updated using Toposheet of 1:25000 scale.
• Map of Muvattupuzha block was obtained from Kerala State
land use board.
• Drainage, drainage density and slope maps were obtained
from DEM map.
• Geology, Geomorphology, land use land cover(LULC) and
lineament density maps were obtained from Kerala State
Land use board.
• Annual rainfall data for the period 2016-17 was got from
metrological Department , Thiruvananthapuram.
• Soil map was got from the Dept. Of soil survey & soil
conservation.
• Ground water level data was collected from Groundwater
Department, Kakkanad.
18. IDENTIFICATION OF CAUSATIVE
FACTORS
1. Drainage density
2. Slope
3. Geology
4. Geomorphology
5. Soil
6. Lineament density
7. Rainfall
8. Land use land cover
18
19. Digital Elevation Model (DEM)
• A digital elevation model is a digital model or 3-D representation
of a terrain's surface created from terrain elevation data
• In this study, DEM was downloaded from ASTER.
• It was used to analyse drainage, drainage density and slope of the
study area.
• Using extract tools the DEM of study area was extracted.
19
22. In catalog select new shape file.In feature
type select polygon
In editor toolbox select start editing and click on
the required template
Begin digitizing the Feature you want to create
and click on stop editing and save edits.
select Spatial analyst toolset. Click on extract by
mask
Input raster data (DEM) & shape file of the
boundary to get DEM map
22
PREPARATION OF DEM
23. Digitizing:It is the process of converting any feature of a paper
map into digital format.
23
26. 1.Drainage
and
drainage
density map
This map
consists of water
bodies, rivers,
tributaries,
streams,
ponds.The
Hydrology tools
are used to
extract
hydrologic
information
from a DEM.
Drainage
density is
defined as the
closeness of
spacing of
stream channels
It is an inverse
function of
permeability.
26
27. In spatial analyst extension of hydrology
toolset, select fill tool
Click on flow direction .Select flow
accumulation
To get the streams, click on map algebra.
Select raster calculator. Give accumulation
>1000
click on stream order & input the map to
obtain drainage map
In conversion tools, select raster to
polyline.From spatial analyst extension,
select line density. 27
28. Fill tool:Fills sinks in a surface raster to remove small
imperfections in the data.
28
37. 2. Slope
map
Slope is the rate
of change of
elevation. It
determines the
gravity effect on
the water
movement.
Slope map is
obtained from
DEM using surface
toolset of spatial
analyst.
37
40. 3.Geology
Map
The water-
bearing
properties vary
from one rock
type to another
rock type.It
depends on
compactness of
the
rocks(porosity&
permeability)
The study area
consists of basic
rocks,Charnokite,K
hondalite,and
Migmatite
complex.
40
42. 4.Geomorphology
Map
Geomorphologi
cal maps portray
important
geomorphic
units, landforms
and underlying
geology .
A systematic study
of these maps are
helpful for
selecting ground
water potential
zones and artificial
recharge sites. This
information
provides a reliable
base for effective
planning,
development and
management of
groundwater
resources of an
area. 42
46. 6.Lineament
density Map
Lineaments
represent zones
of faulting and
fracturing
resulting in
increased
permeability.
They act as path
ways for ground
water
movement.
Area with high
lineament density
are good for ground
water potential
zones.
46
48. 7.Land Use
And Land
Cover map
Land use refers
to man’s
activities in
land, various
uses which are
carried out on
land.Land cover
denotes the
natural
vegetation,
water bodies,
rocks.
LULC affects
evapotranspiration
volume, timing and
recharge of ground
water system.
48
50. 8.Rainfall
map
It determines
the amount of
water that
would be
available to
percolate into
the groundwater
system.
The data obtained
from IMD was
spatially
interpolated using
Inverse Distance
Weighted (IDW)
method to obtain
the rainfall
distribution map.
50
52. Assessment of ground water
potential zones
WEIGHTED OVERLAY ANALYSIS
All the thematic maps are overlaid in terms of
weighted overlay Analysis (WOA) using the spatial
analysis tool in ArcGIS 10.3.
The advantage of WOA is that human judgement can
be integrated with analysis.
52
54. A weight or percentage influence represents relative
importance of parameter and the objective.
The ranks have been given for each individual parameter of
each thematic map depending on its potentiality.
The ranks
1 denotes very poor
2 denotes poor
3 denotes moderate
4 denotes high
5 denotes very high
The weights and rank have been chosen based on judgement
of researchers who had carried out similar work on ground
water potentiality mapping.
54
55. 55
Sl No. Parameter Classes Rank Weight
1. Geomorphology Valley 5 16
Lower plateau 4
Denudational hills 2
Flood plain 5
Structural hills 2
Residual hills 4
2. Slope Nearly level (0-5.026317) 5 19
Very gently sloping (5.02631-9.494) 4
Gently Sloping (9.4941-14.799712) 3
Moderately Sloping (14.799-22.897) 2
Strong Sloping (22.8976-71.206161) 1
3. Drainage
density(km/km2)
Very low (0-53.90919525) 5 11
Low (53.90919525-138.28880) 4
Medium (138.28880-234.38780) 3
High (234.38780-351.5817081) 2
Very high (351.58170-597.6889) 1
4. Lineament
density(Km/Km2)
Very low (0-0.259872993) 1 9
Low (0.2598729-0.7337590) 2
Medium (0.733759-1.13885) 3
56. 56
Sl.no. Parameter class ran
k
weight
5. Land use/land cover Built up land 4 13
Paddy area 4
Rocky area 1
Mixed crop 4
Forest 2
Cultivable waste land 2
Water body 5
6. Rainfall(mm) Moderate (2709.62-2958.413) 3 22
High (2958.413-3134.41) 4
Very High (3134.41-3436.25) 5
7. Geology Basic rocks 3 4
Charnockite 3
Khondalite 4
Migmatite complex 3
8. Soil Hilly soil 2 6
Laterite 4
Alluvium 5
57. GROUND WATER POTENTIAL ZONE
The generated output shall consist of various classes of
ground water potential zones namely Excellent,
Moderate and Poor Zones from ground water potential
point of view
57
Table 3 Area statistics of different Groundwater Prospect Zones
Category of
ground water
potential
zone
Area in Km2 Area in %
Excellent 27.672 12.28
Moderate 148.31 65.81
Low 48.30 21.43
59. Validation
In order to validate the classification of ground water
potential zones obtained by remote sensing and GIS
based ground water potential map,data on existing
well were collected by field investigations and enqiury.
This data was cross-checked by using data obtained
from ground water department for the year 2016-17.
59
60. 60
Sl.No. Place name Latitude Longitude Depth to water level in
meters
Average
depth in
metres
Minimum Maximum
1 Perumattom 9.9934844 76.5960512 1.78 4.87 3.325
2 Thrikkalathoor 10.0294243 76.5491221 0.65 5.16 2.905
3 Pezhakkapily 10.0145626 76.5669526 1.98 6.14 4.06
4 Arakuzha 9.9293692 76.5957139 2.03 5.35 3.69
5 Arakuzha 9.96229 76.58473 1.08 7.45 4.265
6 Kadalikad 9.9237669 76.6742785 0.67 6.72 3.695
7 Kumaramangalam 9.9350273 76.708533 0.9 2.89 1.895
8 Paingottor 9.9914808 76.7067144 0.62 3.72 2.17
63. Conclusions
Remote sensing and GIS techniques has helped in:
efficient use of cost, time, and labour.
integration of eight thematic maps such as drainage
density, rainfall, LULC, slope, geology, geomorphology,
lineament density and soil which gives information to
local authorities and planners about the areas suitable for
groundwater exploration.
Generation of ground water potential map of the area.
To extract useful information from satellite images.
63
64. Conclusions
The excellent zones are distributed along the
lineaments
The area around the alluvial plain, low slope, flat
topography near river plain is good in groundwater
prospects.
Areas with high slope, high-drainage density, low
lineament density are poor to very poor in
groundwater prospects.
64
65. Conclusions
Geological characteristics,lineament, drainage and
slope shows direct influence on ground water
conditions in the study area.
Drainage density is an inverse function of
permeability. The less permeable a rock is, the less
infiltration of rainfall.
Subsequent validation with boreholes/well yield data
revealed a good correlation with respect to the
observed groundwater potential zonation.
65
66. FUTURE SCOPE
Aid in proper development and utilization of groundwater
resources for eliminating water scarcity and thereby
improving the irrigation practices and agricultural income
for standard living conditions of the society
The study can be further extended to identify the sites and
suitable artificial recharge methods for augmentation of
groundwater resources in moderate and poor potential
zones.
Gives information to local authorities and planners about
the areas suitable for groundwater exploration in order to
ensure sustainability of well yields and counter the
problem of water table depletion.
66
67. FUTURE SCOPE
Provide sufficient support in groundwater studies
where the region lacks previous hydrogeological
investigations and data.
Useful for various purposes such as sustainable
development of groundwater as well as
implementation of water conservation projects and
programmes in the area.
67
68. REFERENCES
Y Yashwanthkumar, D V Sathyanaryana
Moorthy,GShanmukhaSrinivas,“identification of ground water potential zones
using GIS ”The international journal of civil engineering and technology ,march
2017,pp. 01-10.
Basavaraj DB ,CG Hiremth, J Davithuraj, B K Purandara “Identification of
ground water potential zones using ARC GIS 10.1” International Journal of
Advances in mechanical and civil engineering, September 2016.
Preeja KR, SabhuJoseph,Jobin T homas , Vijith H “identification of groundwater
potential zones of a tropical river basin(Kerala, India) using GIS and remote
sensing techniques” Journal of the Indian society of Remote sensing, February
2011.
ML Waikar and Adithya P Nilawar, “identification of ground water potential
zones using GIS techniques” International Journal of Innovative Research in
Science ,Engineering and Technology, May 2014.
KamalKUBarik,DalaiPC,GoudoS.P,PandaSR,Nandi D, “Delineation of
Groundwater Potential Zone in Baliguda Block of Kandhamal District, Odisha
using Geospatial Technology Approach” ,International Journal of Advanced
Remote Sensing and GIS,pp. 2068-2079.
68
69. GirishGopinath,“IntegratedHydro geological survey of the
muvattupuzha river basin ,Kerala ,India.”, August 2003.
M. Nagarajan and Sujith Singh “Assessment of Ground water potential
zones using GIS”, Journal of the Indian society of Remote sensing, March
2009.
PankajKumar,SrikanthaHerath,RamAvtar,Kazuhiko Takeuchi, “
Mapping of groundwater potential zones in Killinochi area, Sri Lanka,
using GIS and remote sensing techniques” Sustainable Water Resource
Management, September 2016.
N.S. Magesh, N. Chandrasekar, John Prince Soundranayagam,
“Delineation of groundwater potential zones in Theni district, Tamil
Nadu, using remote sensing, GIS and MIF techniques.” ,February 2012.
Surajith Murasingh,Ramkar Jha“Identification of Groundwater
Potential Zones Using Remote Sensing and GIS in a mine area of
odhisha”,July 2015.
69
70. S.Anirudhan,M.Sundararajan,R.G.Rejith,”Nature of Groundwater
Occurrence in hardrock terrain:Kerala,India.”,March 2017.
Abdul Azeiz Hussain,Vanum Govindu,Amare Gebre Medhin
Nigguse,”Ground water Potential Using Geospatial
Techniques”December 2015.
Jesiya N.P,Girish Gopinath,”Delineation of Groundwater Potential
Zones in Selected Urban and Peri-Urban Clusters of Kozhikode
District,Kerala,India”,April 2015.
RamuMahalingam B,Vinay M,”Identification of Groundwater
Potential Zones Using GIS and RS : A case study of Mysore
Taluk:Karnataka”,March 2014.
70
72. LITERATURE REVIEW
1.Surajit Murasingh, Ramakar Jha (2013)
Various groundwater potential zones in Tensa valley,
India have been delineated using remote sensing and
GIS techniques.
Various maps (i.e., base, DEM, drainage density, contour,
land use, lineament density and groundwater prospect
zones) were prepared using the remote sensing data
along with the existing maps.
Base map and DEM were transformed to raster data
using feature to raster converter tool in ArcGIS 9.3
version. 72
73. 2.Y. Yaswanth Kumar, D.V. Satyanarayana Moorthy, G.
Shanmuka Srinivas(2017)
The various thematic maps are Boundary, Drainage,
DEM,Drainage Density, Slope, Soil, Lineaments, Land Use/ Land
Cover, Rainfall maps.
The Digital Elevation Model (DEM) has been generated from the
20 m contour interval contour lines derived from SOI toposheets.
The Slope map has been prepared from DEM. These maps have
been overlaid in terms of weighed overlay method using Spatial
Analysis tool in Arc GIS 9.3.
During weighed overlay analysis, the ranking has been given for
each individual parameter of each thematic map and weights were
assigned according to their influence.
73
74. 3.BASAVARAJ D.B et al.(2016)
conducted a case study to find out the groundwater potential
zones in Dodahalla Watershed, Belagavi andKarnataka, India with
an aerial of 320.20 km2.
The thematic maps such as geomorphology, land use / land cover,
slope, soil,lithology and drainage map were generated for the
study area.
The groundwater potential zones are generated by overlaying all
the thematic maps in terms of weighted overlay method using the
spatial analysis tool in ArcGIS 10.1.
74
75. 4.Preeja K. R et al.(2011)
The information on geology, geomorphology,lineaments,
slope and land use/land cover was gathered from
Landsat ETM + data and Survey of India
(SOI)toposheets of scale 1:50,000 in addition,
GIS platform was used for the integration of various
themes.
75
76. 5.N.S. Magesh et al(2011)
Various Groundwater potential zones for the assessment of
groundwater availability in Theni district have been
delineated using remote sensing and GIS techniques.
Survey of India toposheets and IRS-1C satellite imageries are
used to prepare various thematic layers viz. lithology, slope,
land-use, lineament,drainage, soil, and rainfall were
transformed to raster data using feature to raster converter
tool in ArcGIS.
76
77. 6.Thilagavathi N et al(2011)
RS & GIS techniques have been used to map the groundwater
potential zones in Salem Chalk Hills, Tamil Nadu, India.
Satellite imageries were also used to extract lineaments,
hydrogeomorphic landforms, drainage patterns, and land
use, which are the major controlling factors for the
occurrence of groundwater.
Various thematic layers pertaining to groundwater existence
such as geology, geomorphology, land use/land cover,
lineament, lineament density, drainage, drainage density,
slope, and soil were generated using GIS tools.
By integrating all the above thematic layers based on the
ranks and weightages, eventually groundwater potential
zones were demarcated.
77
78. 7.Ramu et al(2014)
Conducted a study to analyse the ground water potential
zones in Mysore Taluk.
Totally nine parameters have been consider for the study
such as drainage density, elevation, geology, geomorphology,
land use and land cover, lineaments, rainfall pattern, slope
gradient and soil texture.
The selected parameters have been prepared and classified
in GIS environment, then weightage for each parameters and
its classes have been assigned using Analytical Hierarchical
Process, then weighted overlay analysis inArcGIS used to find
out the result.
78
79. 8.M.L.Waikar and Aditya P. Nilawar (2014)
The accurate information to obtain the parameters that can
be considered for identifying the groundwater potential zone
such as geology, slope, drainage density, geomorphic units
and lineament density are generated using the satellite data
and survey of India (SOI) toposheets of scale 1:50000.
It is then integrated with weighted overlay in ArcGIS.
Suitable ranks are assigned for each category of these
parameters.
79
80. 9.Kamal Ku. Barik et al (2017)
GPZ are demarcated with the help of geospatial techniques.
The parameters, considered for identifying the GPZ such as
geology, geomorphology, slope, drainage density, lineament
density, rainfall, soil and landuse and land cover (LULC) are
generated using satellite data and toposheet.
Later, they are integrated with each other applying weighted
overlay in ArcGIS. Suitable ranks are assigned for each
category of these parameters.
80
81. 10.Girish Gopinath(2003)
Demarcated the groundwater potential zones in the
Muvattupuzha river basin different thematic maps were
prepared in 1 :50,000 scale from conventional data and
remotely sensed data.
The thematic maps on resistivity , lithology ,drainage map
and contour map were prepared using the data obtained
through field investigation, from secondary sources and
Survey of India topographical sheets in 1 :50,000 scale
hydrogeomorphology , lineament map and , landuse were
prepared using Indian Remote Sensing Satellite
81
82. 11.M.Nagarajan(2009)
The thematic maps such as geology,geomorphology,soil
hydrological group,land use,land cover and drainage map
were prepared for study area.
The ground water potential zones were obtained by
overlaying all the thematic maps in terms of weighted overlay
method using the spatial analylis tool in ArcGIS 9.2.
82
83. 12.Pankaj Kumar et al(2016)
GPZ maps are generated using remote sensing and
geographic information system (GIS) for Killinochi area,
Northern Sri Lanka.
Five different themes of information such as
geomorphology, geology,soil type (extracted from
existing topo sheet)
slope [generated from shuttle radar topography mission
(SRTM) digital elevation model (DEM)]
land use/land cover (extracted from digital processing of
AVNIR satellite data) were integrated with weighted overlay
in GIS to generate groundwater potential zonation map of
the area.
83
84. 13.JESIYA N P AND GIRISH GOPINATH(2015)
An integrated approach has been made in the study to
identify groundwater potential zones in the urban
and Peri-Urban Clusters of Kozhikode district, Kerala.
Interpretation of remotely sensed data is carried in
conjunction with the existing information and groundwater
level data from the fieldwork to map the controlling and
indicative parameters, and integrated these parameter layers
in the GIS environment using Weighted Index Overlay
Analysis (WIOA) method.
84
85. 14.Vanum Govindu et al
eight major biophysical and environmental factors like
geomorphology, lithology, slope, rainfall, landuse land cover
(LULC), soil, lineament density and drainage density were
considered
weighted valuedetermination for each factor and its field
value was computed using IDRSI software. At last, all the
factors were integrated together and computed the model
using theweighted overlay so that potential groundwater
areas weremapped.
85