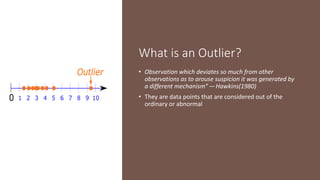
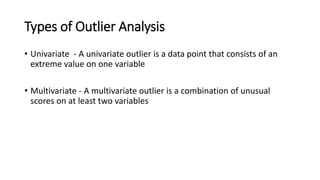
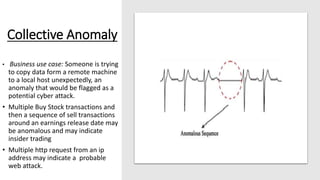
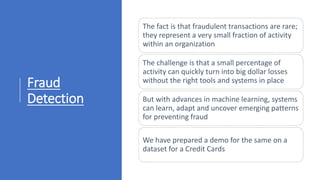
SlideShare a Scribd company logo
1 of 26
Outlier Analysis and
Anomaly Detection
Presented By:
Birwa Galia
Milony Mehta
Shantanu Deosthale
What is an Outlier?
• Observation which deviates so much from other
observations as to arouse suspicion it was generated by
a different mechanism” — Hawkins(1980)
• They are data points that are considered out of the
ordinary or abnormal
Types of Outlier Analysis
• Univariate - A univariate outlier is a data point that consists of an
extreme value on one variable
• Multivariate - A multivariate outlier is a combination of unusual
scores on at least two variables
What Is Anomaly?
• Something that
deviates from what is
standard, normal, or
expected.
Can You
Guess What
Is the
Anomaly?
What Is Anomaly Detection?
• It is the process of finding patterns in data, that do not conform to a
prior expected behavior.
• Anomaly detection is an important tool for detecting fraud, network
intrusion, and other rare events that may have great significance but
are hard to find.
Types Of Anomalies
• Point Anomaly
In an instance is anomalous compared
with the rest of instances, the anomaly
is considered as point anomaly.
• Contextual Anomaly
It is specific-context based anomaly.
Observation that is unusual in a
certain context but not in entire
context as a whole
• Collective anomalies
If a Collection of related data instances
is anomalous with respect to the
entire data set.
Point Anomaly
• Business use case: Detecting
credit card fraud based on
"amount spent.“
• Purchase with large
transaction value, Transaction
of $50000 with no previous
record of transactions more
that $1000
Contextual Anomaly
• Business use case: Spending
$100 on food every day
during the holiday season is
normal, but may be odd
otherwise.
Collective Anomaly
• Business use case: Someone is trying
to copy data form a remote machine
to a local host unexpectedly, an
anomaly that would be flagged as a
potential cyber attack.
• Multiple Buy Stock transactions and
then a sequence of sell transactions
around an earnings release date may
be anomalous and may indicate
insider trading
• Multiple http request from an ip
address may indicate a probable
web attack.
Applications of
Anomaly
Detection
• Intrusion Detection
• Fraud Detection
• Fault Detection
• System Health Monitoring
• Event Detection in Sensor Networks
• Detecting Ecosystem Disturbances
Methodologies
to Anomaly
Detection
Graphical Approach
Statistical Approach
Machine Learning
Approach
Graphical Approach
• Graphical methods utilize extreme value analysis, by which outliers
correspond to the statistical tails of probability distributions.
• Statistical tails are most commonly used for one dimensional
distributions, although the same concept can be applied to
multidimensional case.
• It is important to understand that all extreme values are outliers but
the reverse may not be true
• For instance in one dimensional dataset of {1,3,3,3,50,97,97,97,100},
observation 50 equals to mean and isn’t considered as an extreme
value, but since this observation is the most isolated point, it should
be considered as an outlier.
Box Plot:
• A standardized way of displaying the variation of data based on the
five number summary, which includes minimum, first quartile,
median, third quartile, and maximum
• This plot does not make any assumptions of the underlying statistical
distribution
• Any data not included between the minimum and maximum are
considered as an outlier
Scatter Plot:
• A mathematical diagram, which uses Cartesian coordinates for
plotting ordered pairs to show the correlation between typically two
random variables.
• An outlier is defined as a data point that doesn't seem to fit with the
rest of the data points.
• In scatterplots, outliers of either intersection or union sets of two
variables can be shown.
Symbol Plot:
• This plot plots two dimensional data, using robust Mahalanobis
distances based on the minimum covariance determinant(mcd)
estimator with adjustment
• Minimum Covariance Determinant (MCD) estimator looks for the
subset of h data points whose covariance matrix has the smallest
determinant
• Four drawn ellipsoids in the plot show the Mahalanobis distances
correspond to 25%, 50%, 75% and adjusted quantiles of the chi-
square distribution.
Statistical Approach:
• Hypothesis Test(Chi-Square test, Grubb’s test)
• Scores
Hypothesis Testing
• This method draws conclusions about a sample point by testing
whether it comes from the same distribution as the training data.
• Statistical tests, such as the t-test and the ANOVA table, can be used
on multiple subsets of the data
• Here, the level of significance, i.e, the probability of incorrectly
rejecting the true null hypothesis, needs to be chosen
• To apply this method in R, “outliers” package, which utilizes statistical
tests, is used
Chi-Square Test
• Chi-square test performs a simple test for detecting outliers of
univariate data based on Chi-square distribution of squared
difference between data and sample mean
• In this test, sample variance counts as the estimator of the population
variance
• Chi-square test helps us identify the lowest and highest values, since
outliers can exist in both tails of the data.
The Grubbs' test statistic is defined as:
• Test for outliers for univariate data sets assumed to come from a
normally distributed population
• Grubbs' test detects one outlier at a time. This outlier is expunged
from the dataset and the test is iterated until no outliers are detected
• This test is defined for the following hypotheses: H0: There are no
outliers in the data set H1: There is exactly one outlier in the data set
Scores:
• Scores quantifies the tendency of a data point being an outlier by
assigning it a score or probability
• The most commonly used scores are:
▫ Normal score: 𝑥 𝑖 −𝑀𝑒𝑎𝑛 𝑠𝑡𝑎𝑛𝑑𝑎𝑟𝑑 𝑑𝑒𝑣𝑖𝑎𝑡𝑖𝑜𝑛
▫ T-student score: (𝑧−𝑠𝑞𝑟𝑡 𝑛−2 ) 𝑠𝑞𝑟𝑡(𝑧−1−𝑡2)
▫ Chi-square score: 𝑥 𝑖 −𝑀𝑒𝑎𝑛 𝑠𝑑 2
▫ IQR score: 𝑄3-𝑄1
• By using “score” function in R, p-values can be returned instead of
scores.
Machine Learning Approach:
• Linear Regression
• Piecewise /segmented regression
• Clustering-based approaches
Linear Regression:
• Linear regression investigates the linear relationships between
variables and predict one variable based on one or more other
variables and it can be formulated as:
𝑌 = 𝛽0 + ෍ 𝑖=1 𝑝 𝛽𝑖 𝑋𝑖
where Y and 𝑋𝑖 are random variables, 𝛽𝑖 is regression coefficient and 𝛽0 is a
constant
• In this model, ordinary least squares estimator is usually used to
minimize the difference between the dependent variable and
independent variables.
Piecewise/segmented regression
• A method in regression analysis, in which the independent variable is
partitioned into intervals to allow multiple linear models to be fitted
to data for different ranges
• This model can be applied when there are ‘breakpoints’ and clearly
two different linear relationships in the data with a sudden, sharp
change in directionality. Below is a simple segmented regression for
data with two breakpoints:
𝑌 = 𝐶0 + 𝜑1 𝑋 𝑋 < 𝑋1 𝑌 = 𝐶1 + 𝜑2 𝑋 𝑋 > 𝑋1
where Y is a predicted value, X is an independent variable, 𝐶0 and 𝐶1
are constant values, 𝜑1 and 𝜑2 are regression coefficients, and 𝑋1 and
𝑋2 are breakpoints.
Fraud
Detection
The fact is that fraudulent transactions are rare;
they represent a very small fraction of activity
within an organization
The challenge is that a small percentage of
activity can quickly turn into big dollar losses
without the right tools and systems in place
But with advances in machine learning, systems
can learn, adapt and uncover emerging patterns
for preventing fraud
We have prepared a demo for the same on a
dataset for a Credit Cards
Questions?

More Related Content

What's hot

3.7 outlier analysis
3.7 outlier analysis3.7 outlier analysis
3.7 outlier analysisKrish_ver2
 
Chapter - 6 Data Mining Concepts and Techniques 2nd Ed slides Han &amp; Kamber
Chapter - 6 Data Mining Concepts and Techniques 2nd Ed slides Han &amp; KamberChapter - 6 Data Mining Concepts and Techniques 2nd Ed slides Han &amp; Kamber
Chapter - 6 Data Mining Concepts and Techniques 2nd Ed slides Han &amp; Kambererror007
 
Classification Based Machine Learning Algorithms
Classification Based Machine Learning AlgorithmsClassification Based Machine Learning Algorithms
Classification Based Machine Learning AlgorithmsMd. Main Uddin Rony
 
CART – Classification & Regression Trees
CART – Classification & Regression TreesCART – Classification & Regression Trees
CART – Classification & Regression TreesHemant Chetwani
 
Classification Algorithm.
Classification Algorithm.Classification Algorithm.
Classification Algorithm.Megha Sharma
 
Anomaly detection Workshop slides
Anomaly detection Workshop slidesAnomaly detection Workshop slides
Anomaly detection Workshop slidesQuantUniversity
 
Data Exploration, Validation and Sanitization
Data Exploration, Validation and SanitizationData Exploration, Validation and Sanitization
Data Exploration, Validation and SanitizationVenkata Reddy Konasani
 
Principal component analysis and lda
Principal component analysis and ldaPrincipal component analysis and lda
Principal component analysis and ldaSuresh Pokharel
 
Data mining concepts and work
Data mining concepts and workData mining concepts and work
Data mining concepts and workAmr Abd El Latief
 
Introduction to Machine Learning Classifiers
Introduction to Machine Learning ClassifiersIntroduction to Machine Learning Classifiers
Introduction to Machine Learning ClassifiersFunctional Imperative
 
Data Mining: clustering and analysis
Data Mining: clustering and analysisData Mining: clustering and analysis
Data Mining: clustering and analysisDataminingTools Inc
 
Data Mining: Outlier analysis
Data Mining: Outlier analysisData Mining: Outlier analysis
Data Mining: Outlier analysisDatamining Tools
 
Introduction to Maximum Likelihood Estimator
Introduction to Maximum Likelihood EstimatorIntroduction to Maximum Likelihood Estimator
Introduction to Maximum Likelihood EstimatorAmir Al-Ansary
 
Data mining: Concepts and Techniques, Chapter12 outlier Analysis
Data mining: Concepts and Techniques, Chapter12 outlier Analysis Data mining: Concepts and Techniques, Chapter12 outlier Analysis
Data mining: Concepts and Techniques, Chapter12 outlier Analysis Salah Amean
 

What's hot (20)

3.7 outlier analysis
3.7 outlier analysis3.7 outlier analysis
3.7 outlier analysis
 
Chapter - 6 Data Mining Concepts and Techniques 2nd Ed slides Han &amp; Kamber
Chapter - 6 Data Mining Concepts and Techniques 2nd Ed slides Han &amp; KamberChapter - 6 Data Mining Concepts and Techniques 2nd Ed slides Han &amp; Kamber
Chapter - 6 Data Mining Concepts and Techniques 2nd Ed slides Han &amp; Kamber
 
Classification Based Machine Learning Algorithms
Classification Based Machine Learning AlgorithmsClassification Based Machine Learning Algorithms
Classification Based Machine Learning Algorithms
 
Anomaly detection
Anomaly detectionAnomaly detection
Anomaly detection
 
Pca ppt
Pca pptPca ppt
Pca ppt
 
CART – Classification & Regression Trees
CART – Classification & Regression TreesCART – Classification & Regression Trees
CART – Classification & Regression Trees
 
Classification Algorithm.
Classification Algorithm.Classification Algorithm.
Classification Algorithm.
 
Anomaly detection Workshop slides
Anomaly detection Workshop slidesAnomaly detection Workshop slides
Anomaly detection Workshop slides
 
Data Mining: Outlier analysis
Data Mining: Outlier analysisData Mining: Outlier analysis
Data Mining: Outlier analysis
 
Data Exploration, Validation and Sanitization
Data Exploration, Validation and SanitizationData Exploration, Validation and Sanitization
Data Exploration, Validation and Sanitization
 
Principal component analysis and lda
Principal component analysis and ldaPrincipal component analysis and lda
Principal component analysis and lda
 
Data mining concepts and work
Data mining concepts and workData mining concepts and work
Data mining concepts and work
 
Introduction to Machine Learning Classifiers
Introduction to Machine Learning ClassifiersIntroduction to Machine Learning Classifiers
Introduction to Machine Learning Classifiers
 
Data Mining: clustering and analysis
Data Mining: clustering and analysisData Mining: clustering and analysis
Data Mining: clustering and analysis
 
Data Mining: Outlier analysis
Data Mining: Outlier analysisData Mining: Outlier analysis
Data Mining: Outlier analysis
 
Introduction to Maximum Likelihood Estimator
Introduction to Maximum Likelihood EstimatorIntroduction to Maximum Likelihood Estimator
Introduction to Maximum Likelihood Estimator
 
KNN
KNN KNN
KNN
 
Resampling methods
Resampling methodsResampling methods
Resampling methods
 
Data mining: Concepts and Techniques, Chapter12 outlier Analysis
Data mining: Concepts and Techniques, Chapter12 outlier Analysis Data mining: Concepts and Techniques, Chapter12 outlier Analysis
Data mining: Concepts and Techniques, Chapter12 outlier Analysis
 
Chapter 12 outlier
Chapter 12 outlierChapter 12 outlier
Chapter 12 outlier
 

Similar to Outlier analysis and anomaly detection

Anomaly detection : QuantUniversity Workshop
Anomaly detection : QuantUniversity Workshop Anomaly detection : QuantUniversity Workshop
Anomaly detection : QuantUniversity Workshop QuantUniversity
 
Anomaly detection Meetup Slides
Anomaly detection Meetup SlidesAnomaly detection Meetup Slides
Anomaly detection Meetup SlidesQuantUniversity
 
computer application in pharmaceutical research
computer application in pharmaceutical researchcomputer application in pharmaceutical research
computer application in pharmaceutical researchSUJITHA MARY
 
Anomaly detection: Core Techniques and Advances in Big Data and Deep Learning
Anomaly detection: Core Techniques and Advances in Big Data and Deep LearningAnomaly detection: Core Techniques and Advances in Big Data and Deep Learning
Anomaly detection: Core Techniques and Advances in Big Data and Deep LearningQuantUniversity
 
ststs nw.pptx
ststs nw.pptxststs nw.pptx
ststs nw.pptxMrymNb
 
Basic knowledge on statistics
Basic knowledge on statisticsBasic knowledge on statistics
Basic knowledge on statisticsSubodh Khanal
 
R - what do the numbers mean? #RStats
R - what do the numbers mean? #RStatsR - what do the numbers mean? #RStats
R - what do the numbers mean? #RStatsJen Stirrup
 
Standard deviation
Standard deviationStandard deviation
Standard deviationM K
 
statistical inference.pptx
statistical inference.pptxstatistical inference.pptx
statistical inference.pptxsuerie2
 
Outlier analysis,Chapter-12, Data Mining: Concepts and Techniques
Outlier analysis,Chapter-12, Data Mining: Concepts and TechniquesOutlier analysis,Chapter-12, Data Mining: Concepts and Techniques
Outlier analysis,Chapter-12, Data Mining: Concepts and TechniquesAshikur Rahman
 
Data Wrangling_1.pptx
Data Wrangling_1.pptxData Wrangling_1.pptx
Data Wrangling_1.pptxPallabiSahoo5
 
Basic stat analysis using excel
Basic stat analysis using excelBasic stat analysis using excel
Basic stat analysis using excelParag Shah
 

Similar to Outlier analysis and anomaly detection (20)

Anomaly detection
Anomaly detectionAnomaly detection
Anomaly detection
 
Anomaly detection : QuantUniversity Workshop
Anomaly detection : QuantUniversity Workshop Anomaly detection : QuantUniversity Workshop
Anomaly detection : QuantUniversity Workshop
 
Anomaly detection Meetup Slides
Anomaly detection Meetup SlidesAnomaly detection Meetup Slides
Anomaly detection Meetup Slides
 
Environmental statistics
Environmental statisticsEnvironmental statistics
Environmental statistics
 
Descriptive Analysis.pptx
Descriptive Analysis.pptxDescriptive Analysis.pptx
Descriptive Analysis.pptx
 
computer application in pharmaceutical research
computer application in pharmaceutical researchcomputer application in pharmaceutical research
computer application in pharmaceutical research
 
Res701 research methodology lecture 7 8-devaprakasam
Res701 research methodology lecture 7 8-devaprakasamRes701 research methodology lecture 7 8-devaprakasam
Res701 research methodology lecture 7 8-devaprakasam
 
Anomaly detection: Core Techniques and Advances in Big Data and Deep Learning
Anomaly detection: Core Techniques and Advances in Big Data and Deep LearningAnomaly detection: Core Techniques and Advances in Big Data and Deep Learning
Anomaly detection: Core Techniques and Advances in Big Data and Deep Learning
 
ststs nw.pptx
ststs nw.pptxststs nw.pptx
ststs nw.pptx
 
poster_Reza
poster_Rezaposter_Reza
poster_Reza
 
Descriptive Analytics: Data Reduction
 Descriptive Analytics: Data Reduction Descriptive Analytics: Data Reduction
Descriptive Analytics: Data Reduction
 
Basic knowledge on statistics
Basic knowledge on statisticsBasic knowledge on statistics
Basic knowledge on statistics
 
Statistics
StatisticsStatistics
Statistics
 
R - what do the numbers mean? #RStats
R - what do the numbers mean? #RStatsR - what do the numbers mean? #RStats
R - what do the numbers mean? #RStats
 
Kevin Swingler: Introduction to Data Mining
Kevin Swingler: Introduction to Data MiningKevin Swingler: Introduction to Data Mining
Kevin Swingler: Introduction to Data Mining
 
Standard deviation
Standard deviationStandard deviation
Standard deviation
 
statistical inference.pptx
statistical inference.pptxstatistical inference.pptx
statistical inference.pptx
 
Outlier analysis,Chapter-12, Data Mining: Concepts and Techniques
Outlier analysis,Chapter-12, Data Mining: Concepts and TechniquesOutlier analysis,Chapter-12, Data Mining: Concepts and Techniques
Outlier analysis,Chapter-12, Data Mining: Concepts and Techniques
 
Data Wrangling_1.pptx
Data Wrangling_1.pptxData Wrangling_1.pptx
Data Wrangling_1.pptx
 
Basic stat analysis using excel
Basic stat analysis using excelBasic stat analysis using excel
Basic stat analysis using excel
 

Recently uploaded

#StandardsGoals for 2024: What’s new for BISAC - Tech Forum 2024
#StandardsGoals for 2024: What’s new for BISAC - Tech Forum 2024#StandardsGoals for 2024: What’s new for BISAC - Tech Forum 2024
#StandardsGoals for 2024: What’s new for BISAC - Tech Forum 2024BookNet Canada
 
New from BookNet Canada for 2024: BNC BiblioShare - Tech Forum 2024
New from BookNet Canada for 2024: BNC BiblioShare - Tech Forum 2024New from BookNet Canada for 2024: BNC BiblioShare - Tech Forum 2024
New from BookNet Canada for 2024: BNC BiblioShare - Tech Forum 2024BookNet Canada
 
Enhancing Worker Digital Experience: A Hands-on Workshop for Partners
Enhancing Worker Digital Experience: A Hands-on Workshop for PartnersEnhancing Worker Digital Experience: A Hands-on Workshop for Partners
Enhancing Worker Digital Experience: A Hands-on Workshop for PartnersThousandEyes
 
08448380779 Call Girls In Diplomatic Enclave Women Seeking Men
08448380779 Call Girls In Diplomatic Enclave Women Seeking Men08448380779 Call Girls In Diplomatic Enclave Women Seeking Men
08448380779 Call Girls In Diplomatic Enclave Women Seeking MenDelhi Call girls
 
Scanning the Internet for External Cloud Exposures via SSL Certs
Scanning the Internet for External Cloud Exposures via SSL CertsScanning the Internet for External Cloud Exposures via SSL Certs
Scanning the Internet for External Cloud Exposures via SSL CertsRizwan Syed
 
Integration and Automation in Practice: CI/CD in Mule Integration and Automat...
Integration and Automation in Practice: CI/CD in Mule Integration and Automat...Integration and Automation in Practice: CI/CD in Mule Integration and Automat...
Integration and Automation in Practice: CI/CD in Mule Integration and Automat...Patryk Bandurski
 
APIForce Zurich 5 April Automation LPDG
APIForce Zurich 5 April  Automation LPDGAPIForce Zurich 5 April  Automation LPDG
APIForce Zurich 5 April Automation LPDGMarianaLemus7
 
Swan(sea) Song – personal research during my six years at Swansea ... and bey...
Swan(sea) Song – personal research during my six years at Swansea ... and bey...Swan(sea) Song – personal research during my six years at Swansea ... and bey...
Swan(sea) Song – personal research during my six years at Swansea ... and bey...Alan Dix
 
Presentation on how to chat with PDF using ChatGPT code interpreter
Presentation on how to chat with PDF using ChatGPT code interpreterPresentation on how to chat with PDF using ChatGPT code interpreter
Presentation on how to chat with PDF using ChatGPT code interpreternaman860154
 
Automating Business Process via MuleSoft Composer | Bangalore MuleSoft Meetup...
Automating Business Process via MuleSoft Composer | Bangalore MuleSoft Meetup...Automating Business Process via MuleSoft Composer | Bangalore MuleSoft Meetup...
Automating Business Process via MuleSoft Composer | Bangalore MuleSoft Meetup...shyamraj55
 
Unleash Your Potential - Namagunga Girls Coding Club
Unleash Your Potential - Namagunga Girls Coding ClubUnleash Your Potential - Namagunga Girls Coding Club
Unleash Your Potential - Namagunga Girls Coding ClubKalema Edgar
 
AI as an Interface for Commercial Buildings
AI as an Interface for Commercial BuildingsAI as an Interface for Commercial Buildings
AI as an Interface for Commercial BuildingsMemoori
 
08448380779 Call Girls In Friends Colony Women Seeking Men
08448380779 Call Girls In Friends Colony Women Seeking Men08448380779 Call Girls In Friends Colony Women Seeking Men
08448380779 Call Girls In Friends Colony Women Seeking MenDelhi Call girls
 
"Federated learning: out of reach no matter how close",Oleksandr Lapshyn
"Federated learning: out of reach no matter how close",Oleksandr Lapshyn"Federated learning: out of reach no matter how close",Oleksandr Lapshyn
"Federated learning: out of reach no matter how close",Oleksandr LapshynFwdays
 
SIEMENS: RAPUNZEL – A Tale About Knowledge Graph
SIEMENS: RAPUNZEL – A Tale About Knowledge GraphSIEMENS: RAPUNZEL – A Tale About Knowledge Graph
SIEMENS: RAPUNZEL – A Tale About Knowledge GraphNeo4j
 
Artificial intelligence in the post-deep learning era
Artificial intelligence in the post-deep learning eraArtificial intelligence in the post-deep learning era
Artificial intelligence in the post-deep learning eraDeakin University
 
Breaking the Kubernetes Kill Chain: Host Path Mount
Breaking the Kubernetes Kill Chain: Host Path MountBreaking the Kubernetes Kill Chain: Host Path Mount
Breaking the Kubernetes Kill Chain: Host Path MountPuma Security, LLC
 
Kotlin Multiplatform & Compose Multiplatform - Starter kit for pragmatics
Kotlin Multiplatform & Compose Multiplatform - Starter kit for pragmaticsKotlin Multiplatform & Compose Multiplatform - Starter kit for pragmatics
Kotlin Multiplatform & Compose Multiplatform - Starter kit for pragmaticscarlostorres15106
 
Making_way_through_DLL_hollowing_inspite_of_CFG_by_Debjeet Banerjee.pptx
Making_way_through_DLL_hollowing_inspite_of_CFG_by_Debjeet Banerjee.pptxMaking_way_through_DLL_hollowing_inspite_of_CFG_by_Debjeet Banerjee.pptx
Making_way_through_DLL_hollowing_inspite_of_CFG_by_Debjeet Banerjee.pptxnull - The Open Security Community
 

Recently uploaded (20)

#StandardsGoals for 2024: What’s new for BISAC - Tech Forum 2024
#StandardsGoals for 2024: What’s new for BISAC - Tech Forum 2024#StandardsGoals for 2024: What’s new for BISAC - Tech Forum 2024
#StandardsGoals for 2024: What’s new for BISAC - Tech Forum 2024
 
New from BookNet Canada for 2024: BNC BiblioShare - Tech Forum 2024
New from BookNet Canada for 2024: BNC BiblioShare - Tech Forum 2024New from BookNet Canada for 2024: BNC BiblioShare - Tech Forum 2024
New from BookNet Canada for 2024: BNC BiblioShare - Tech Forum 2024
 
Enhancing Worker Digital Experience: A Hands-on Workshop for Partners
Enhancing Worker Digital Experience: A Hands-on Workshop for PartnersEnhancing Worker Digital Experience: A Hands-on Workshop for Partners
Enhancing Worker Digital Experience: A Hands-on Workshop for Partners
 
08448380779 Call Girls In Diplomatic Enclave Women Seeking Men
08448380779 Call Girls In Diplomatic Enclave Women Seeking Men08448380779 Call Girls In Diplomatic Enclave Women Seeking Men
08448380779 Call Girls In Diplomatic Enclave Women Seeking Men
 
Scanning the Internet for External Cloud Exposures via SSL Certs
Scanning the Internet for External Cloud Exposures via SSL CertsScanning the Internet for External Cloud Exposures via SSL Certs
Scanning the Internet for External Cloud Exposures via SSL Certs
 
Integration and Automation in Practice: CI/CD in Mule Integration and Automat...
Integration and Automation in Practice: CI/CD in Mule Integration and Automat...Integration and Automation in Practice: CI/CD in Mule Integration and Automat...
Integration and Automation in Practice: CI/CD in Mule Integration and Automat...
 
APIForce Zurich 5 April Automation LPDG
APIForce Zurich 5 April  Automation LPDGAPIForce Zurich 5 April  Automation LPDG
APIForce Zurich 5 April Automation LPDG
 
Swan(sea) Song – personal research during my six years at Swansea ... and bey...
Swan(sea) Song – personal research during my six years at Swansea ... and bey...Swan(sea) Song – personal research during my six years at Swansea ... and bey...
Swan(sea) Song – personal research during my six years at Swansea ... and bey...
 
Presentation on how to chat with PDF using ChatGPT code interpreter
Presentation on how to chat with PDF using ChatGPT code interpreterPresentation on how to chat with PDF using ChatGPT code interpreter
Presentation on how to chat with PDF using ChatGPT code interpreter
 
DMCC Future of Trade Web3 - Special Edition
DMCC Future of Trade Web3 - Special EditionDMCC Future of Trade Web3 - Special Edition
DMCC Future of Trade Web3 - Special Edition
 
Automating Business Process via MuleSoft Composer | Bangalore MuleSoft Meetup...
Automating Business Process via MuleSoft Composer | Bangalore MuleSoft Meetup...Automating Business Process via MuleSoft Composer | Bangalore MuleSoft Meetup...
Automating Business Process via MuleSoft Composer | Bangalore MuleSoft Meetup...
 
Unleash Your Potential - Namagunga Girls Coding Club
Unleash Your Potential - Namagunga Girls Coding ClubUnleash Your Potential - Namagunga Girls Coding Club
Unleash Your Potential - Namagunga Girls Coding Club
 
AI as an Interface for Commercial Buildings
AI as an Interface for Commercial BuildingsAI as an Interface for Commercial Buildings
AI as an Interface for Commercial Buildings
 
08448380779 Call Girls In Friends Colony Women Seeking Men
08448380779 Call Girls In Friends Colony Women Seeking Men08448380779 Call Girls In Friends Colony Women Seeking Men
08448380779 Call Girls In Friends Colony Women Seeking Men
 
"Federated learning: out of reach no matter how close",Oleksandr Lapshyn
"Federated learning: out of reach no matter how close",Oleksandr Lapshyn"Federated learning: out of reach no matter how close",Oleksandr Lapshyn
"Federated learning: out of reach no matter how close",Oleksandr Lapshyn
 
SIEMENS: RAPUNZEL – A Tale About Knowledge Graph
SIEMENS: RAPUNZEL – A Tale About Knowledge GraphSIEMENS: RAPUNZEL – A Tale About Knowledge Graph
SIEMENS: RAPUNZEL – A Tale About Knowledge Graph
 
Artificial intelligence in the post-deep learning era
Artificial intelligence in the post-deep learning eraArtificial intelligence in the post-deep learning era
Artificial intelligence in the post-deep learning era
 
Breaking the Kubernetes Kill Chain: Host Path Mount
Breaking the Kubernetes Kill Chain: Host Path MountBreaking the Kubernetes Kill Chain: Host Path Mount
Breaking the Kubernetes Kill Chain: Host Path Mount
 
Kotlin Multiplatform & Compose Multiplatform - Starter kit for pragmatics
Kotlin Multiplatform & Compose Multiplatform - Starter kit for pragmaticsKotlin Multiplatform & Compose Multiplatform - Starter kit for pragmatics
Kotlin Multiplatform & Compose Multiplatform - Starter kit for pragmatics
 
Making_way_through_DLL_hollowing_inspite_of_CFG_by_Debjeet Banerjee.pptx
Making_way_through_DLL_hollowing_inspite_of_CFG_by_Debjeet Banerjee.pptxMaking_way_through_DLL_hollowing_inspite_of_CFG_by_Debjeet Banerjee.pptx
Making_way_through_DLL_hollowing_inspite_of_CFG_by_Debjeet Banerjee.pptx
 

Outlier analysis and anomaly detection

  • 1. Outlier Analysis and Anomaly Detection Presented By: Birwa Galia Milony Mehta Shantanu Deosthale
  • 2. What is an Outlier? • Observation which deviates so much from other observations as to arouse suspicion it was generated by a different mechanism” — Hawkins(1980) • They are data points that are considered out of the ordinary or abnormal
  • 3. Types of Outlier Analysis • Univariate - A univariate outlier is a data point that consists of an extreme value on one variable • Multivariate - A multivariate outlier is a combination of unusual scores on at least two variables
  • 4. What Is Anomaly? • Something that deviates from what is standard, normal, or expected.
  • 5. Can You Guess What Is the Anomaly?
  • 6. What Is Anomaly Detection? • It is the process of finding patterns in data, that do not conform to a prior expected behavior. • Anomaly detection is an important tool for detecting fraud, network intrusion, and other rare events that may have great significance but are hard to find.
  • 7. Types Of Anomalies • Point Anomaly In an instance is anomalous compared with the rest of instances, the anomaly is considered as point anomaly. • Contextual Anomaly It is specific-context based anomaly. Observation that is unusual in a certain context but not in entire context as a whole • Collective anomalies If a Collection of related data instances is anomalous with respect to the entire data set.
  • 8. Point Anomaly • Business use case: Detecting credit card fraud based on "amount spent.“ • Purchase with large transaction value, Transaction of $50000 with no previous record of transactions more that $1000
  • 9. Contextual Anomaly • Business use case: Spending $100 on food every day during the holiday season is normal, but may be odd otherwise.
  • 10. Collective Anomaly • Business use case: Someone is trying to copy data form a remote machine to a local host unexpectedly, an anomaly that would be flagged as a potential cyber attack. • Multiple Buy Stock transactions and then a sequence of sell transactions around an earnings release date may be anomalous and may indicate insider trading • Multiple http request from an ip address may indicate a probable web attack.
  • 11. Applications of Anomaly Detection • Intrusion Detection • Fraud Detection • Fault Detection • System Health Monitoring • Event Detection in Sensor Networks • Detecting Ecosystem Disturbances
  • 13. Graphical Approach • Graphical methods utilize extreme value analysis, by which outliers correspond to the statistical tails of probability distributions. • Statistical tails are most commonly used for one dimensional distributions, although the same concept can be applied to multidimensional case. • It is important to understand that all extreme values are outliers but the reverse may not be true • For instance in one dimensional dataset of {1,3,3,3,50,97,97,97,100}, observation 50 equals to mean and isn’t considered as an extreme value, but since this observation is the most isolated point, it should be considered as an outlier.
  • 14. Box Plot: • A standardized way of displaying the variation of data based on the five number summary, which includes minimum, first quartile, median, third quartile, and maximum • This plot does not make any assumptions of the underlying statistical distribution • Any data not included between the minimum and maximum are considered as an outlier
  • 15. Scatter Plot: • A mathematical diagram, which uses Cartesian coordinates for plotting ordered pairs to show the correlation between typically two random variables. • An outlier is defined as a data point that doesn't seem to fit with the rest of the data points. • In scatterplots, outliers of either intersection or union sets of two variables can be shown.
  • 16. Symbol Plot: • This plot plots two dimensional data, using robust Mahalanobis distances based on the minimum covariance determinant(mcd) estimator with adjustment • Minimum Covariance Determinant (MCD) estimator looks for the subset of h data points whose covariance matrix has the smallest determinant • Four drawn ellipsoids in the plot show the Mahalanobis distances correspond to 25%, 50%, 75% and adjusted quantiles of the chi- square distribution.
  • 17. Statistical Approach: • Hypothesis Test(Chi-Square test, Grubb’s test) • Scores
  • 18. Hypothesis Testing • This method draws conclusions about a sample point by testing whether it comes from the same distribution as the training data. • Statistical tests, such as the t-test and the ANOVA table, can be used on multiple subsets of the data • Here, the level of significance, i.e, the probability of incorrectly rejecting the true null hypothesis, needs to be chosen • To apply this method in R, “outliers” package, which utilizes statistical tests, is used
  • 19. Chi-Square Test • Chi-square test performs a simple test for detecting outliers of univariate data based on Chi-square distribution of squared difference between data and sample mean • In this test, sample variance counts as the estimator of the population variance • Chi-square test helps us identify the lowest and highest values, since outliers can exist in both tails of the data.
  • 20. The Grubbs' test statistic is defined as: • Test for outliers for univariate data sets assumed to come from a normally distributed population • Grubbs' test detects one outlier at a time. This outlier is expunged from the dataset and the test is iterated until no outliers are detected • This test is defined for the following hypotheses: H0: There are no outliers in the data set H1: There is exactly one outlier in the data set
  • 21. Scores: • Scores quantifies the tendency of a data point being an outlier by assigning it a score or probability • The most commonly used scores are: ▫ Normal score: 𝑥 𝑖 −𝑀𝑒𝑎𝑛 𝑠𝑡𝑎𝑛𝑑𝑎𝑟𝑑 𝑑𝑒𝑣𝑖𝑎𝑡𝑖𝑜𝑛 ▫ T-student score: (𝑧−𝑠𝑞𝑟𝑡 𝑛−2 ) 𝑠𝑞𝑟𝑡(𝑧−1−𝑡2) ▫ Chi-square score: 𝑥 𝑖 −𝑀𝑒𝑎𝑛 𝑠𝑑 2 ▫ IQR score: 𝑄3-𝑄1 • By using “score” function in R, p-values can be returned instead of scores.
  • 22. Machine Learning Approach: • Linear Regression • Piecewise /segmented regression • Clustering-based approaches
  • 23. Linear Regression: • Linear regression investigates the linear relationships between variables and predict one variable based on one or more other variables and it can be formulated as: 𝑌 = 𝛽0 + ෍ 𝑖=1 𝑝 𝛽𝑖 𝑋𝑖 where Y and 𝑋𝑖 are random variables, 𝛽𝑖 is regression coefficient and 𝛽0 is a constant • In this model, ordinary least squares estimator is usually used to minimize the difference between the dependent variable and independent variables.
  • 24. Piecewise/segmented regression • A method in regression analysis, in which the independent variable is partitioned into intervals to allow multiple linear models to be fitted to data for different ranges • This model can be applied when there are ‘breakpoints’ and clearly two different linear relationships in the data with a sudden, sharp change in directionality. Below is a simple segmented regression for data with two breakpoints: 𝑌 = 𝐶0 + 𝜑1 𝑋 𝑋 < 𝑋1 𝑌 = 𝐶1 + 𝜑2 𝑋 𝑋 > 𝑋1 where Y is a predicted value, X is an independent variable, 𝐶0 and 𝐶1 are constant values, 𝜑1 and 𝜑2 are regression coefficients, and 𝑋1 and 𝑋2 are breakpoints.
  • 25. Fraud Detection The fact is that fraudulent transactions are rare; they represent a very small fraction of activity within an organization The challenge is that a small percentage of activity can quickly turn into big dollar losses without the right tools and systems in place But with advances in machine learning, systems can learn, adapt and uncover emerging patterns for preventing fraud We have prepared a demo for the same on a dataset for a Credit Cards