SlideShare a Scribd company logo
1 of 6
Sachin Mehta
University of Nevada, Reno
Point Interpolation
Overview
The general purpose of this report is to discuss the interpolation a set of points to create four
predicted surfaces. The points that were used represent pollution samples taken along the Maas
River measured in parts per million (ppm). The four surfaces will be created in Arc Map using
the tools found in the Geo-statistical Analyst. The created surfaces will then be used to predict
the occurrence of a specified pollutant along the flood plain of the Maas River. For this exercise I
chose to look at the spatial variation of Mercury along the flood plain of the Maas River.
The tools I chose to use prior to the interpolation were the histogram (Fig. 1) to represent the
distribution of the chosen data and the semi-variogram cloud (Fig. 2) to look at the spatial
autocorrelation of the data. For the histogram a logarithmic transformation was used to normalize
the data, which was skewed to the left. The semi-variogram for Mercury indicated that the
samples only varied slightly in relation to distance. For the actual interpolation I chose to use an
Inverse Distance Weighted (IDW), two different Local Polynomial Interpolations (LPI), and one
Kriged surface. Each tool brings with it some advantages and some disadvantages…the created
surfaces and subsequent results would then be compared to determine the best fit.
Fig. 1: Histogram for Mercury
Sachin Mehta
University of Nevada, Reno
Point Interpolation
Fig. 2: Semi-variogram for Mercury.
Methodology
The first method chosen was the Inverse Distance Weighted (IDW) because it is known to be an
exact interpolator. The idea behind the IDW is loosely based on Tobler’s law that states: “that
things closer together are more closely related than those that are farther apart.” The IDW has a
limited number of variables that can be changed, such as the power function and the
neighborhood type. So with that in mind I chose to leave the power function at 2 and the
neighborhood type to smooth. The smooth feature creates multiple ellipses to be used in the
interpolation, while the power function is used to justify the best fit.
The second method that was used was the Local Polynomial Interpolation (LPI). The idea behind
LPI is the use of varying orders of polynomials to interpolate short-range variation within a
search area or neighborhood to produce an output surface. In the first LPI there was only one
variable that was changed was the kernel function which was changed from a polynomial
function to Gaussian. The Gaussian function is a bell-shaped function it seems to normalize the
data slightly. For the second LPI everything remained the same as the first LPI except for the use
of the optimize button, which minimizes the mean square error.
The last method used in this analysis was a spatial analysis tool named kriging. Kriging uses the
concept of auto-correlation which tend to provide a better measure of certainty or accuracy than
the other method which use deterministic interpolation. The first option that was change for the
analysis was the kriging type, it was changed from a simple to an ordinary. The ordinary kriging
is an examination of the trend, if it is unknown and is composed of a linear function it will fit, if
it varies or is known one of the other types of kriging will be used. The next step was to use a
first order trend removal, this was done to provide a normality or stationarity (special
Sachin Mehta
University of Nevada, Reno
Point Interpolation
homogeneity). There were two steps that followed first was to change that kernel function to
Gaussian, then use the optimize button. The Gaussian again normalizes the data and the optimize
button minimizes the mean square error. The neighborhood type was left as standard.
Results
The results varied widely with some of the created surfaces over-predicting while others under-
predicted these can be found in (Table 1). Analyzing the IDW created surface found in (Fig. 3) it
is noticeable that it created small concentric circles around some points, but not around all the
points. This could be attributed to the fact that the IDW is an exact interpolator and the values of
the surrounding points weren’t the same. The predicted values didn’t show much change from
the actual values which could be a good indicator that is this surface might be really close to
what might actually be occurring along the Maas River.
Fig. 3: Inverse Distance Weighting created surface of Mercury
Sachin Mehta
University of Nevada, Reno
Point Interpolation
The IDW had a Root Mean Squared (RMS) value of 18.69326 which is relatively high. This
could indicate that the IDW created surface is grossly over-estimating, though is doesn’t actually
seem like it after a visual comparison. The next method used was the LPI, the results can be
found in (Fig. 4) and (Fig. 5). The first surface that was created had two portions that were
completely blank, one on the bottom and the other in the right hand corner. This could be
attributed to the fact that nearest points were too far away for the LPI to create a predicted
surface. The RMS value for this surface was 14.36267 which is relatively high. This could be
found in the surface values, which slightly under-estimate at the low end and grossly over-
estimate on the high end when compared to the actual sample values.
The other surface that was created didn’t have such large portions that were left blank, but they
were still there. This is because there were no points close enough for the LPI to predict what
values should cover that particular surface. This surface had a slightly higher RMS value of
16.1452, but a low Root Mean-Square Standardized (RMSS) value of 0.97938. This would
indicate that the surface created is an underestimate, this noticeable when comparing the created
values with the actual values. The lower values of the predicted surface were far too low and the
higher values were also lower than they should have been.
Fig. 4: Mercury LPI Analysis Fig. 5: Mercury LPI (Optimized) Analysis
Sachin Mehta
University of Nevada, Reno
Point Interpolation
The last surface that was created was the Kriged surface which is found in (Fig. 6). The first
noticeable difference is the large portion in the
lower right that is blank. This is a result of the
neighborhood search area being too small, so
the resulting surface tends to exclude some
areas. In this case the area which has no almost
no data points, which is very similar to the
non-optimized LPI created surface. Something
else that stands out is how jagged the surface is
compared to the other surfaces which look
relatively smooth in comparison. This could be
because the Kriged surface tends to create a
better measure of certainty or accuracy.
Fig. 6: Kriged Surface for Mercury
The Kriged surface produced a RMS of 15.32313 and a RMSS of 1.18722, which are good
indicators of slight over-estimating. This can be found when comparing the Mercury samples to
the values produced by the Kriged surface. The lower end seems to be only slightly over
estimated, while the upper-end results are just a little higher only at the extreme. This would
conclude the results portion of the analysis.
Table 1: Results of Analyses for Mercury
Method
Min_value
(ppm)
Max_value
(ppm)
Percent area
>20 ppm
Percent area
>60 ppm
Percent area
>160 ppm
IDW 14.02470303 127.5209198 3 89.9 7.1
LPI 10.49144936 158.2221069 12.2 76.9 10.9
LPI (optimized) -0.534780145 116.6180954 0 0 0
Kriging 9.593212128 152.0141754 13.7 76.2 10.1
Sachin Mehta
University of Nevada, Reno
Point Interpolation
Conclusion
This analysis produced some interesting results and not being able to get percent area for the LPI
(optimized) through off the comparison a bit. In my opinion the kriged surface produced the
optimal results. Though the IDW seemed to be the most accurate, they did not appear to be
realistic. Then again none of these results seemed very realistic because other variables such as
elevation, course of the river, distance to river, and other heavy metals were not compared. If
elevation was considered it could be used to determine if there were any hills or sinks where the
presence of the Mercury might be higher or lower. The course of the river and distance to river
play an important part because it could take a turn at the top or the bottom which could indicate
why some Mercury sample are found in certain areas. The last uncertainty would be to compare
the other heavy metals that were taken and determine if they accumulated in the same areas.
Without comparing these other variables the analysis seems to come up a little short of
expectations.

More Related Content

What's hot

Are 3D surface standard parameters discriminant for paper ?
Are 3D surface standard parameters discriminant for paper ?Are 3D surface standard parameters discriminant for paper ?
Are 3D surface standard parameters discriminant for paper ?Christophe Mercier
 
A statistical assessment of GDEM using LiDAR data
A statistical assessment of GDEM using LiDAR dataA statistical assessment of GDEM using LiDAR data
A statistical assessment of GDEM using LiDAR dataTomislav Hengl
 
Using Kriging Combined with Categorical Information of Soil Maps for Interpol...
Using Kriging Combined with Categorical Information of Soil Maps for Interpol...Using Kriging Combined with Categorical Information of Soil Maps for Interpol...
Using Kriging Combined with Categorical Information of Soil Maps for Interpol...FAO
 
study and analysis of hy si data in 400 to 500
study and analysis of hy si data in 400 to 500study and analysis of hy si data in 400 to 500
study and analysis of hy si data in 400 to 500IJAEMSJORNAL
 
FR3.TO5.2.pptx
FR3.TO5.2.pptxFR3.TO5.2.pptx
FR3.TO5.2.pptxgrssieee
 
A Simplified and Robust Surface Reflectance Estimation Method (SREM) for Use ...
A Simplified and Robust Surface Reflectance Estimation Method (SREM) for Use ...A Simplified and Robust Surface Reflectance Estimation Method (SREM) for Use ...
A Simplified and Robust Surface Reflectance Estimation Method (SREM) for Use ...Muhammad Bilal
 
Comparación de los métodos de corrección atmosférica basados ​​en imágenes y ...
Comparación de los métodos de corrección atmosférica basados ​​en imágenes y ...Comparación de los métodos de corrección atmosférica basados ​​en imágenes y ...
Comparación de los métodos de corrección atmosférica basados ​​en imágenes y ...Nino Bravo Morales
 
ASSESSING THE EFFECTS OF SPATIAL INTERPOLATION OF RAINFALL ON THE STREAMFLOW ...
ASSESSING THE EFFECTS OF SPATIAL INTERPOLATION OF RAINFALL ON THE STREAMFLOW ...ASSESSING THE EFFECTS OF SPATIAL INTERPOLATION OF RAINFALL ON THE STREAMFLOW ...
ASSESSING THE EFFECTS OF SPATIAL INTERPOLATION OF RAINFALL ON THE STREAMFLOW ...civej
 
Elsherbini_IGARSS.pptx
Elsherbini_IGARSS.pptxElsherbini_IGARSS.pptx
Elsherbini_IGARSS.pptxgrssieee
 
Report - Forschungszentrum Jülich
Report - Forschungszentrum JülichReport - Forschungszentrum Jülich
Report - Forschungszentrum JülichArjun Narayanan
 
LandsatOLI_Lake_Assessment _BakerJ
LandsatOLI_Lake_Assessment _BakerJLandsatOLI_Lake_Assessment _BakerJ
LandsatOLI_Lake_Assessment _BakerJJeffrey Baker
 
An Assessment of Pan-sharpening Algorithms for Mapping Mangrove Ecosystems: A...
An Assessment of Pan-sharpening Algorithms for Mapping Mangrove Ecosystems: A...An Assessment of Pan-sharpening Algorithms for Mapping Mangrove Ecosystems: A...
An Assessment of Pan-sharpening Algorithms for Mapping Mangrove Ecosystems: A...Anisa Aulia Sabilah
 
6. patriche c., vasiliniuc i. aspects regarding the usefulness of geographi...
6. patriche c., vasiliniuc i.   aspects regarding the usefulness of geographi...6. patriche c., vasiliniuc i.   aspects regarding the usefulness of geographi...
6. patriche c., vasiliniuc i. aspects regarding the usefulness of geographi...Vasiliniuc Ionut
 
Interpolation 2013
Interpolation 2013Interpolation 2013
Interpolation 2013Atiqa khan
 
Assessing 50 years of tropical Peruvian glacier volume change from multitempo...
Assessing 50 years of tropical Peruvian glacier volume change from multitempo...Assessing 50 years of tropical Peruvian glacier volume change from multitempo...
Assessing 50 years of tropical Peruvian glacier volume change from multitempo...InfoAndina CONDESAN
 
A Review of Change Detection Techniques of LandCover Using Remote Sensing Data
A Review of Change Detection Techniques of LandCover Using Remote Sensing DataA Review of Change Detection Techniques of LandCover Using Remote Sensing Data
A Review of Change Detection Techniques of LandCover Using Remote Sensing Dataiosrjce
 
Bidanset Lombard Cityscape
Bidanset Lombard CityscapeBidanset Lombard Cityscape
Bidanset Lombard CityscapePaul Bidanset
 

What's hot (20)

Are 3D surface standard parameters discriminant for paper ?
Are 3D surface standard parameters discriminant for paper ?Are 3D surface standard parameters discriminant for paper ?
Are 3D surface standard parameters discriminant for paper ?
 
A statistical assessment of GDEM using LiDAR data
A statistical assessment of GDEM using LiDAR dataA statistical assessment of GDEM using LiDAR data
A statistical assessment of GDEM using LiDAR data
 
Comparison of Spatial Interpolation Methods for Precipitation in Ningxia, China
Comparison of Spatial Interpolation Methods for Precipitation in Ningxia, ChinaComparison of Spatial Interpolation Methods for Precipitation in Ningxia, China
Comparison of Spatial Interpolation Methods for Precipitation in Ningxia, China
 
Using Kriging Combined with Categorical Information of Soil Maps for Interpol...
Using Kriging Combined with Categorical Information of Soil Maps for Interpol...Using Kriging Combined with Categorical Information of Soil Maps for Interpol...
Using Kriging Combined with Categorical Information of Soil Maps for Interpol...
 
study and analysis of hy si data in 400 to 500
study and analysis of hy si data in 400 to 500study and analysis of hy si data in 400 to 500
study and analysis of hy si data in 400 to 500
 
FR3.TO5.2.pptx
FR3.TO5.2.pptxFR3.TO5.2.pptx
FR3.TO5.2.pptx
 
A Simplified and Robust Surface Reflectance Estimation Method (SREM) for Use ...
A Simplified and Robust Surface Reflectance Estimation Method (SREM) for Use ...A Simplified and Robust Surface Reflectance Estimation Method (SREM) for Use ...
A Simplified and Robust Surface Reflectance Estimation Method (SREM) for Use ...
 
Poster Roseanne Clement
Poster Roseanne ClementPoster Roseanne Clement
Poster Roseanne Clement
 
Comparación de los métodos de corrección atmosférica basados ​​en imágenes y ...
Comparación de los métodos de corrección atmosférica basados ​​en imágenes y ...Comparación de los métodos de corrección atmosférica basados ​​en imágenes y ...
Comparación de los métodos de corrección atmosférica basados ​​en imágenes y ...
 
ASSESSING THE EFFECTS OF SPATIAL INTERPOLATION OF RAINFALL ON THE STREAMFLOW ...
ASSESSING THE EFFECTS OF SPATIAL INTERPOLATION OF RAINFALL ON THE STREAMFLOW ...ASSESSING THE EFFECTS OF SPATIAL INTERPOLATION OF RAINFALL ON THE STREAMFLOW ...
ASSESSING THE EFFECTS OF SPATIAL INTERPOLATION OF RAINFALL ON THE STREAMFLOW ...
 
Elsherbini_IGARSS.pptx
Elsherbini_IGARSS.pptxElsherbini_IGARSS.pptx
Elsherbini_IGARSS.pptx
 
Report - Forschungszentrum Jülich
Report - Forschungszentrum JülichReport - Forschungszentrum Jülich
Report - Forschungszentrum Jülich
 
LandsatOLI_Lake_Assessment _BakerJ
LandsatOLI_Lake_Assessment _BakerJLandsatOLI_Lake_Assessment _BakerJ
LandsatOLI_Lake_Assessment _BakerJ
 
An Assessment of Pan-sharpening Algorithms for Mapping Mangrove Ecosystems: A...
An Assessment of Pan-sharpening Algorithms for Mapping Mangrove Ecosystems: A...An Assessment of Pan-sharpening Algorithms for Mapping Mangrove Ecosystems: A...
An Assessment of Pan-sharpening Algorithms for Mapping Mangrove Ecosystems: A...
 
6. patriche c., vasiliniuc i. aspects regarding the usefulness of geographi...
6. patriche c., vasiliniuc i.   aspects regarding the usefulness of geographi...6. patriche c., vasiliniuc i.   aspects regarding the usefulness of geographi...
6. patriche c., vasiliniuc i. aspects regarding the usefulness of geographi...
 
Interpolation 2013
Interpolation 2013Interpolation 2013
Interpolation 2013
 
Assessing 50 years of tropical Peruvian glacier volume change from multitempo...
Assessing 50 years of tropical Peruvian glacier volume change from multitempo...Assessing 50 years of tropical Peruvian glacier volume change from multitempo...
Assessing 50 years of tropical Peruvian glacier volume change from multitempo...
 
Melles
MellesMelles
Melles
 
A Review of Change Detection Techniques of LandCover Using Remote Sensing Data
A Review of Change Detection Techniques of LandCover Using Remote Sensing DataA Review of Change Detection Techniques of LandCover Using Remote Sensing Data
A Review of Change Detection Techniques of LandCover Using Remote Sensing Data
 
Bidanset Lombard Cityscape
Bidanset Lombard CityscapeBidanset Lombard Cityscape
Bidanset Lombard Cityscape
 

Viewers also liked

Inverse distance weighting
Inverse distance weightingInverse distance weighting
Inverse distance weightingPenchala Vineeth
 
Om problems facility layout
Om problems   facility layoutOm problems   facility layout
Om problems facility layoutvideoaakash15
 
Industrial Management : Facilities Location and Layout [MM Trisakti 2015]
Industrial Management : Facilities Location and Layout [MM Trisakti 2015]Industrial Management : Facilities Location and Layout [MM Trisakti 2015]
Industrial Management : Facilities Location and Layout [MM Trisakti 2015]Leonard Merari Situmeang
 
Case Study for Plant Layout :: A modern analysis
Case Study for Plant Layout :: A modern analysisCase Study for Plant Layout :: A modern analysis
Case Study for Plant Layout :: A modern analysisSarang Bhutada
 
Ergonomic design of the broom fibers
Ergonomic design of the broom fibersErgonomic design of the broom fibers
Ergonomic design of the broom fibersHashem Yahya Almahdi
 
Assembly Line Balancing -Example
Assembly Line Balancing -ExampleAssembly Line Balancing -Example
Assembly Line Balancing -ExampleJoseph Konnully
 
Beam Structures including sap2000
Beam Structures  including sap2000Beam Structures  including sap2000
Beam Structures including sap2000Wolfgang Schueller
 

Viewers also liked (11)

Inverse distance weighting
Inverse distance weightingInverse distance weighting
Inverse distance weighting
 
Om problems facility layout
Om problems   facility layoutOm problems   facility layout
Om problems facility layout
 
Industrial Management : Facilities Location and Layout [MM Trisakti 2015]
Industrial Management : Facilities Location and Layout [MM Trisakti 2015]Industrial Management : Facilities Location and Layout [MM Trisakti 2015]
Industrial Management : Facilities Location and Layout [MM Trisakti 2015]
 
Types ofproduct
Types ofproductTypes ofproduct
Types ofproduct
 
Location models
Location modelsLocation models
Location models
 
Case Study for Plant Layout :: A modern analysis
Case Study for Plant Layout :: A modern analysisCase Study for Plant Layout :: A modern analysis
Case Study for Plant Layout :: A modern analysis
 
253413062 heizer-om11-irm-ch07 s
253413062 heizer-om11-irm-ch07 s253413062 heizer-om11-irm-ch07 s
253413062 heizer-om11-irm-ch07 s
 
Ergonomic design of the broom fibers
Ergonomic design of the broom fibersErgonomic design of the broom fibers
Ergonomic design of the broom fibers
 
Assembly Line Balancing -Example
Assembly Line Balancing -ExampleAssembly Line Balancing -Example
Assembly Line Balancing -Example
 
Beam Structures including sap2000
Beam Structures  including sap2000Beam Structures  including sap2000
Beam Structures including sap2000
 
Assembly Line Balancing
Assembly Line BalancingAssembly Line Balancing
Assembly Line Balancing
 

Similar to Implentation of Inverse Distance Weighting, Local Polynomial Interpolation, and Kriging Methodology using ArcGIS

Machine learning for high-speed corner detection
Machine learning for high-speed corner detectionMachine learning for high-speed corner detection
Machine learning for high-speed corner detectionbutest
 
Interpolation 2013
Interpolation 2013Interpolation 2013
Interpolation 2013Atiqa Khan
 
A Method for Determining and Improving the Horizontal Accuracy of Geospatial ...
A Method for Determining and Improving the Horizontal Accuracy of Geospatial ...A Method for Determining and Improving the Horizontal Accuracy of Geospatial ...
A Method for Determining and Improving the Horizontal Accuracy of Geospatial ...Juan Tobar
 
Towards better performance: phase congruency based face recognition
Towards better performance: phase congruency based face recognitionTowards better performance: phase congruency based face recognition
Towards better performance: phase congruency based face recognitionTELKOMNIKA JOURNAL
 
urpl969-group2-paper-03May06
urpl969-group2-paper-03May06urpl969-group2-paper-03May06
urpl969-group2-paper-03May06Wintford Thornton
 
An efficient image segmentation approach through enhanced watershed algorithm
An efficient image segmentation approach through enhanced watershed algorithmAn efficient image segmentation approach through enhanced watershed algorithm
An efficient image segmentation approach through enhanced watershed algorithmAlexander Decker
 
IRJET-A Review on Implementation of High Dimension Colour Transform in Domain...
IRJET-A Review on Implementation of High Dimension Colour Transform in Domain...IRJET-A Review on Implementation of High Dimension Colour Transform in Domain...
IRJET-A Review on Implementation of High Dimension Colour Transform in Domain...IRJET Journal
 
CaoTupinThursday20110722.ppt
CaoTupinThursday20110722.pptCaoTupinThursday20110722.ppt
CaoTupinThursday20110722.pptgrssieee
 
Method of Fracture Surface Matching Based on Mathematical Statistics
Method of Fracture Surface Matching Based on Mathematical StatisticsMethod of Fracture Surface Matching Based on Mathematical Statistics
Method of Fracture Surface Matching Based on Mathematical StatisticsIJRESJOURNAL
 
Advanced Remote Sensing Project Report
Advanced Remote Sensing Project ReportAdvanced Remote Sensing Project Report
Advanced Remote Sensing Project ReportJeffrey Schorsch
 
A comparison of SIFT, PCA-SIFT and SURF
A comparison of SIFT, PCA-SIFT and SURFA comparison of SIFT, PCA-SIFT and SURF
A comparison of SIFT, PCA-SIFT and SURFCSCJournals
 
sedimaging for soil classification
sedimaging for soil classificationsedimaging for soil classification
sedimaging for soil classificationSudarshan Barole
 
Ijartes v1-i2-005
Ijartes v1-i2-005Ijartes v1-i2-005
Ijartes v1-i2-005IJARTES
 
IJERD (www.ijerd.com) International Journal of Engineering Research and Devel...
IJERD (www.ijerd.com) International Journal of Engineering Research and Devel...IJERD (www.ijerd.com) International Journal of Engineering Research and Devel...
IJERD (www.ijerd.com) International Journal of Engineering Research and Devel...IJERD Editor
 

Similar to Implentation of Inverse Distance Weighting, Local Polynomial Interpolation, and Kriging Methodology using ArcGIS (20)

Machine learning for high-speed corner detection
Machine learning for high-speed corner detectionMachine learning for high-speed corner detection
Machine learning for high-speed corner detection
 
Interpolation 2013
Interpolation 2013Interpolation 2013
Interpolation 2013
 
A Method for Determining and Improving the Horizontal Accuracy of Geospatial ...
A Method for Determining and Improving the Horizontal Accuracy of Geospatial ...A Method for Determining and Improving the Horizontal Accuracy of Geospatial ...
A Method for Determining and Improving the Horizontal Accuracy of Geospatial ...
 
FinalReport
FinalReportFinalReport
FinalReport
 
Towards better performance: phase congruency based face recognition
Towards better performance: phase congruency based face recognitionTowards better performance: phase congruency based face recognition
Towards better performance: phase congruency based face recognition
 
urpl969-group2-paper-03May06
urpl969-group2-paper-03May06urpl969-group2-paper-03May06
urpl969-group2-paper-03May06
 
An efficient image segmentation approach through enhanced watershed algorithm
An efficient image segmentation approach through enhanced watershed algorithmAn efficient image segmentation approach through enhanced watershed algorithm
An efficient image segmentation approach through enhanced watershed algorithm
 
Research Analysis and Design of Geometric Transformations using Affine Geometry
Research Analysis and Design of Geometric Transformations using Affine GeometryResearch Analysis and Design of Geometric Transformations using Affine Geometry
Research Analysis and Design of Geometric Transformations using Affine Geometry
 
IRJET-A Review on Implementation of High Dimension Colour Transform in Domain...
IRJET-A Review on Implementation of High Dimension Colour Transform in Domain...IRJET-A Review on Implementation of High Dimension Colour Transform in Domain...
IRJET-A Review on Implementation of High Dimension Colour Transform in Domain...
 
Repeatability Study
Repeatability StudyRepeatability Study
Repeatability Study
 
Ak03302260233
Ak03302260233Ak03302260233
Ak03302260233
 
Modified Multiphase Level Set Image Segmentation Search for Energy Formulatio...
Modified Multiphase Level Set Image Segmentation Search for Energy Formulatio...Modified Multiphase Level Set Image Segmentation Search for Energy Formulatio...
Modified Multiphase Level Set Image Segmentation Search for Energy Formulatio...
 
CaoTupinThursday20110722.ppt
CaoTupinThursday20110722.pptCaoTupinThursday20110722.ppt
CaoTupinThursday20110722.ppt
 
Method of Fracture Surface Matching Based on Mathematical Statistics
Method of Fracture Surface Matching Based on Mathematical StatisticsMethod of Fracture Surface Matching Based on Mathematical Statistics
Method of Fracture Surface Matching Based on Mathematical Statistics
 
Advanced Remote Sensing Project Report
Advanced Remote Sensing Project ReportAdvanced Remote Sensing Project Report
Advanced Remote Sensing Project Report
 
A comparison of SIFT, PCA-SIFT and SURF
A comparison of SIFT, PCA-SIFT and SURFA comparison of SIFT, PCA-SIFT and SURF
A comparison of SIFT, PCA-SIFT and SURF
 
sedimaging for soil classification
sedimaging for soil classificationsedimaging for soil classification
sedimaging for soil classification
 
Zhang weglein-2008
Zhang weglein-2008Zhang weglein-2008
Zhang weglein-2008
 
Ijartes v1-i2-005
Ijartes v1-i2-005Ijartes v1-i2-005
Ijartes v1-i2-005
 
IJERD (www.ijerd.com) International Journal of Engineering Research and Devel...
IJERD (www.ijerd.com) International Journal of Engineering Research and Devel...IJERD (www.ijerd.com) International Journal of Engineering Research and Devel...
IJERD (www.ijerd.com) International Journal of Engineering Research and Devel...
 

More from Sachin Mehta

Wire Routing System
Wire Routing SystemWire Routing System
Wire Routing SystemSachin Mehta
 
Color Filtering using Polystyrene Microspheres
Color Filtering using Polystyrene Microspheres Color Filtering using Polystyrene Microspheres
Color Filtering using Polystyrene Microspheres Sachin Mehta
 
Introduction to Electrical Circuits for K-12 in Reno, Nevada
Introduction to Electrical Circuits for K-12 in Reno, NevadaIntroduction to Electrical Circuits for K-12 in Reno, Nevada
Introduction to Electrical Circuits for K-12 in Reno, NevadaSachin Mehta
 
Sinusoidal Response of RC & RL Circuits
Sinusoidal Response of RC & RL CircuitsSinusoidal Response of RC & RL Circuits
Sinusoidal Response of RC & RL CircuitsSachin Mehta
 
Resonant Response of RLC Circuits
Resonant Response of RLC Circuits Resonant Response of RLC Circuits
Resonant Response of RLC Circuits Sachin Mehta
 
ATP Sensitive Potassium Channel Mediated Lactate Effect
ATP Sensitive Potassium Channel Mediated Lactate Effect ATP Sensitive Potassium Channel Mediated Lactate Effect
ATP Sensitive Potassium Channel Mediated Lactate Effect Sachin Mehta
 
Simple Circuit Design Draft
Simple Circuit Design DraftSimple Circuit Design Draft
Simple Circuit Design DraftSachin Mehta
 
Integration of Advanced Protocols for Detection and Communication
Integration of Advanced Protocols for Detection and CommunicationIntegration of Advanced Protocols for Detection and Communication
Integration of Advanced Protocols for Detection and CommunicationSachin Mehta
 
Brief Overview of Thermistor Sensors and their Applications in Engineering & ...
Brief Overview of Thermistor Sensors and their Applications in Engineering & ...Brief Overview of Thermistor Sensors and their Applications in Engineering & ...
Brief Overview of Thermistor Sensors and their Applications in Engineering & ...Sachin Mehta
 
Geological Investigation of the Mono Basing using ArcGIS
Geological Investigation of the Mono Basing using ArcGISGeological Investigation of the Mono Basing using ArcGIS
Geological Investigation of the Mono Basing using ArcGISSachin Mehta
 
Transfer Functions and Linear Active Networks Using Operational Amplifiers
Transfer Functions and Linear Active Networks Using Operational AmplifiersTransfer Functions and Linear Active Networks Using Operational Amplifiers
Transfer Functions and Linear Active Networks Using Operational AmplifiersSachin Mehta
 
Design & Construction of Switched Mode Power Supplies
Design & Construction of Switched Mode Power Supplies Design & Construction of Switched Mode Power Supplies
Design & Construction of Switched Mode Power Supplies Sachin Mehta
 
FPGA Implementation with Digital Devices
FPGA Implementation with Digital Devices FPGA Implementation with Digital Devices
FPGA Implementation with Digital Devices Sachin Mehta
 
Practical Active Filter Design
Practical Active Filter Design Practical Active Filter Design
Practical Active Filter Design Sachin Mehta
 
Collision Communication System
Collision Communication SystemCollision Communication System
Collision Communication SystemSachin Mehta
 
Novel Analysis of Mono Basin using ArcGIS
Novel Analysis of Mono Basin using ArcGISNovel Analysis of Mono Basin using ArcGIS
Novel Analysis of Mono Basin using ArcGISSachin Mehta
 

More from Sachin Mehta (17)

Wire Routing System
Wire Routing SystemWire Routing System
Wire Routing System
 
Color Filtering using Polystyrene Microspheres
Color Filtering using Polystyrene Microspheres Color Filtering using Polystyrene Microspheres
Color Filtering using Polystyrene Microspheres
 
Introduction to Electrical Circuits for K-12 in Reno, Nevada
Introduction to Electrical Circuits for K-12 in Reno, NevadaIntroduction to Electrical Circuits for K-12 in Reno, Nevada
Introduction to Electrical Circuits for K-12 in Reno, Nevada
 
Sinusoidal Response of RC & RL Circuits
Sinusoidal Response of RC & RL CircuitsSinusoidal Response of RC & RL Circuits
Sinusoidal Response of RC & RL Circuits
 
Resonant Response of RLC Circuits
Resonant Response of RLC Circuits Resonant Response of RLC Circuits
Resonant Response of RLC Circuits
 
ATP Sensitive Potassium Channel Mediated Lactate Effect
ATP Sensitive Potassium Channel Mediated Lactate Effect ATP Sensitive Potassium Channel Mediated Lactate Effect
ATP Sensitive Potassium Channel Mediated Lactate Effect
 
Simple Circuit Design Draft
Simple Circuit Design DraftSimple Circuit Design Draft
Simple Circuit Design Draft
 
Integration of Advanced Protocols for Detection and Communication
Integration of Advanced Protocols for Detection and CommunicationIntegration of Advanced Protocols for Detection and Communication
Integration of Advanced Protocols for Detection and Communication
 
Electroporation
ElectroporationElectroporation
Electroporation
 
Brief Overview of Thermistor Sensors and their Applications in Engineering & ...
Brief Overview of Thermistor Sensors and their Applications in Engineering & ...Brief Overview of Thermistor Sensors and their Applications in Engineering & ...
Brief Overview of Thermistor Sensors and their Applications in Engineering & ...
 
Geological Investigation of the Mono Basing using ArcGIS
Geological Investigation of the Mono Basing using ArcGISGeological Investigation of the Mono Basing using ArcGIS
Geological Investigation of the Mono Basing using ArcGIS
 
Transfer Functions and Linear Active Networks Using Operational Amplifiers
Transfer Functions and Linear Active Networks Using Operational AmplifiersTransfer Functions and Linear Active Networks Using Operational Amplifiers
Transfer Functions and Linear Active Networks Using Operational Amplifiers
 
Design & Construction of Switched Mode Power Supplies
Design & Construction of Switched Mode Power Supplies Design & Construction of Switched Mode Power Supplies
Design & Construction of Switched Mode Power Supplies
 
FPGA Implementation with Digital Devices
FPGA Implementation with Digital Devices FPGA Implementation with Digital Devices
FPGA Implementation with Digital Devices
 
Practical Active Filter Design
Practical Active Filter Design Practical Active Filter Design
Practical Active Filter Design
 
Collision Communication System
Collision Communication SystemCollision Communication System
Collision Communication System
 
Novel Analysis of Mono Basin using ArcGIS
Novel Analysis of Mono Basin using ArcGISNovel Analysis of Mono Basin using ArcGIS
Novel Analysis of Mono Basin using ArcGIS
 

Recently uploaded

Capstone Project on IBM Data Analytics Program
Capstone Project on IBM Data Analytics ProgramCapstone Project on IBM Data Analytics Program
Capstone Project on IBM Data Analytics ProgramMoniSankarHazra
 
Midocean dropshipping via API with DroFx
Midocean dropshipping via API with DroFxMidocean dropshipping via API with DroFx
Midocean dropshipping via API with DroFxolyaivanovalion
 
Halmar dropshipping via API with DroFx
Halmar  dropshipping  via API with DroFxHalmar  dropshipping  via API with DroFx
Halmar dropshipping via API with DroFxolyaivanovalion
 
Al Barsha Escorts $#$ O565212860 $#$ Escort Service In Al Barsha
Al Barsha Escorts $#$ O565212860 $#$ Escort Service In Al BarshaAl Barsha Escorts $#$ O565212860 $#$ Escort Service In Al Barsha
Al Barsha Escorts $#$ O565212860 $#$ Escort Service In Al BarshaAroojKhan71
 
ALSO dropshipping via API with DroFx.pptx
ALSO dropshipping via API with DroFx.pptxALSO dropshipping via API with DroFx.pptx
ALSO dropshipping via API with DroFx.pptxolyaivanovalion
 
Edukaciniai dropshipping via API with DroFx
Edukaciniai dropshipping via API with DroFxEdukaciniai dropshipping via API with DroFx
Edukaciniai dropshipping via API with DroFxolyaivanovalion
 
Week-01-2.ppt BBB human Computer interaction
Week-01-2.ppt BBB human Computer interactionWeek-01-2.ppt BBB human Computer interaction
Week-01-2.ppt BBB human Computer interactionfulawalesam
 
Cheap Rate Call girls Sarita Vihar Delhi 9205541914 shot 1500 night
Cheap Rate Call girls Sarita Vihar Delhi 9205541914 shot 1500 nightCheap Rate Call girls Sarita Vihar Delhi 9205541914 shot 1500 night
Cheap Rate Call girls Sarita Vihar Delhi 9205541914 shot 1500 nightDelhi Call girls
 
Accredited-Transport-Cooperatives-Jan-2021-Web.pdf
Accredited-Transport-Cooperatives-Jan-2021-Web.pdfAccredited-Transport-Cooperatives-Jan-2021-Web.pdf
Accredited-Transport-Cooperatives-Jan-2021-Web.pdfadriantubila
 
Schema on read is obsolete. Welcome metaprogramming..pdf
Schema on read is obsolete. Welcome metaprogramming..pdfSchema on read is obsolete. Welcome metaprogramming..pdf
Schema on read is obsolete. Welcome metaprogramming..pdfLars Albertsson
 
VidaXL dropshipping via API with DroFx.pptx
VidaXL dropshipping via API with DroFx.pptxVidaXL dropshipping via API with DroFx.pptx
VidaXL dropshipping via API with DroFx.pptxolyaivanovalion
 
Call Girls 🫤 Dwarka ➡️ 9711199171 ➡️ Delhi 🫦 Two shot with one girl
Call Girls 🫤 Dwarka ➡️ 9711199171 ➡️ Delhi 🫦 Two shot with one girlCall Girls 🫤 Dwarka ➡️ 9711199171 ➡️ Delhi 🫦 Two shot with one girl
Call Girls 🫤 Dwarka ➡️ 9711199171 ➡️ Delhi 🫦 Two shot with one girlkumarajju5765
 
Generative AI on Enterprise Cloud with NiFi and Milvus
Generative AI on Enterprise Cloud with NiFi and MilvusGenerative AI on Enterprise Cloud with NiFi and Milvus
Generative AI on Enterprise Cloud with NiFi and MilvusTimothy Spann
 
Best VIP Call Girls Noida Sector 39 Call Me: 8448380779
Best VIP Call Girls Noida Sector 39 Call Me: 8448380779Best VIP Call Girls Noida Sector 39 Call Me: 8448380779
Best VIP Call Girls Noida Sector 39 Call Me: 8448380779Delhi Call girls
 
Invezz.com - Grow your wealth with trading signals
Invezz.com - Grow your wealth with trading signalsInvezz.com - Grow your wealth with trading signals
Invezz.com - Grow your wealth with trading signalsInvezz1
 
Vip Model Call Girls (Delhi) Karol Bagh 9711199171✔️Body to body massage wit...
Vip Model  Call Girls (Delhi) Karol Bagh 9711199171✔️Body to body massage wit...Vip Model  Call Girls (Delhi) Karol Bagh 9711199171✔️Body to body massage wit...
Vip Model Call Girls (Delhi) Karol Bagh 9711199171✔️Body to body massage wit...shivangimorya083
 
BPAC WITH UFSBI GENERAL PRESENTATION 18_05_2017-1.pptx
BPAC WITH UFSBI GENERAL PRESENTATION 18_05_2017-1.pptxBPAC WITH UFSBI GENERAL PRESENTATION 18_05_2017-1.pptx
BPAC WITH UFSBI GENERAL PRESENTATION 18_05_2017-1.pptxMohammedJunaid861692
 

Recently uploaded (20)

Capstone Project on IBM Data Analytics Program
Capstone Project on IBM Data Analytics ProgramCapstone Project on IBM Data Analytics Program
Capstone Project on IBM Data Analytics Program
 
Midocean dropshipping via API with DroFx
Midocean dropshipping via API with DroFxMidocean dropshipping via API with DroFx
Midocean dropshipping via API with DroFx
 
Halmar dropshipping via API with DroFx
Halmar  dropshipping  via API with DroFxHalmar  dropshipping  via API with DroFx
Halmar dropshipping via API with DroFx
 
Al Barsha Escorts $#$ O565212860 $#$ Escort Service In Al Barsha
Al Barsha Escorts $#$ O565212860 $#$ Escort Service In Al BarshaAl Barsha Escorts $#$ O565212860 $#$ Escort Service In Al Barsha
Al Barsha Escorts $#$ O565212860 $#$ Escort Service In Al Barsha
 
ALSO dropshipping via API with DroFx.pptx
ALSO dropshipping via API with DroFx.pptxALSO dropshipping via API with DroFx.pptx
ALSO dropshipping via API with DroFx.pptx
 
Edukaciniai dropshipping via API with DroFx
Edukaciniai dropshipping via API with DroFxEdukaciniai dropshipping via API with DroFx
Edukaciniai dropshipping via API with DroFx
 
Week-01-2.ppt BBB human Computer interaction
Week-01-2.ppt BBB human Computer interactionWeek-01-2.ppt BBB human Computer interaction
Week-01-2.ppt BBB human Computer interaction
 
Cheap Rate Call girls Sarita Vihar Delhi 9205541914 shot 1500 night
Cheap Rate Call girls Sarita Vihar Delhi 9205541914 shot 1500 nightCheap Rate Call girls Sarita Vihar Delhi 9205541914 shot 1500 night
Cheap Rate Call girls Sarita Vihar Delhi 9205541914 shot 1500 night
 
Accredited-Transport-Cooperatives-Jan-2021-Web.pdf
Accredited-Transport-Cooperatives-Jan-2021-Web.pdfAccredited-Transport-Cooperatives-Jan-2021-Web.pdf
Accredited-Transport-Cooperatives-Jan-2021-Web.pdf
 
Schema on read is obsolete. Welcome metaprogramming..pdf
Schema on read is obsolete. Welcome metaprogramming..pdfSchema on read is obsolete. Welcome metaprogramming..pdf
Schema on read is obsolete. Welcome metaprogramming..pdf
 
VidaXL dropshipping via API with DroFx.pptx
VidaXL dropshipping via API with DroFx.pptxVidaXL dropshipping via API with DroFx.pptx
VidaXL dropshipping via API with DroFx.pptx
 
Call Girls 🫤 Dwarka ➡️ 9711199171 ➡️ Delhi 🫦 Two shot with one girl
Call Girls 🫤 Dwarka ➡️ 9711199171 ➡️ Delhi 🫦 Two shot with one girlCall Girls 🫤 Dwarka ➡️ 9711199171 ➡️ Delhi 🫦 Two shot with one girl
Call Girls 🫤 Dwarka ➡️ 9711199171 ➡️ Delhi 🫦 Two shot with one girl
 
Generative AI on Enterprise Cloud with NiFi and Milvus
Generative AI on Enterprise Cloud with NiFi and MilvusGenerative AI on Enterprise Cloud with NiFi and Milvus
Generative AI on Enterprise Cloud with NiFi and Milvus
 
Best VIP Call Girls Noida Sector 39 Call Me: 8448380779
Best VIP Call Girls Noida Sector 39 Call Me: 8448380779Best VIP Call Girls Noida Sector 39 Call Me: 8448380779
Best VIP Call Girls Noida Sector 39 Call Me: 8448380779
 
Sampling (random) method and Non random.ppt
Sampling (random) method and Non random.pptSampling (random) method and Non random.ppt
Sampling (random) method and Non random.ppt
 
Invezz.com - Grow your wealth with trading signals
Invezz.com - Grow your wealth with trading signalsInvezz.com - Grow your wealth with trading signals
Invezz.com - Grow your wealth with trading signals
 
Vip Model Call Girls (Delhi) Karol Bagh 9711199171✔️Body to body massage wit...
Vip Model  Call Girls (Delhi) Karol Bagh 9711199171✔️Body to body massage wit...Vip Model  Call Girls (Delhi) Karol Bagh 9711199171✔️Body to body massage wit...
Vip Model Call Girls (Delhi) Karol Bagh 9711199171✔️Body to body massage wit...
 
Delhi 99530 vip 56974 Genuine Escort Service Call Girls in Kishangarh
Delhi 99530 vip 56974 Genuine Escort Service Call Girls in  KishangarhDelhi 99530 vip 56974 Genuine Escort Service Call Girls in  Kishangarh
Delhi 99530 vip 56974 Genuine Escort Service Call Girls in Kishangarh
 
BPAC WITH UFSBI GENERAL PRESENTATION 18_05_2017-1.pptx
BPAC WITH UFSBI GENERAL PRESENTATION 18_05_2017-1.pptxBPAC WITH UFSBI GENERAL PRESENTATION 18_05_2017-1.pptx
BPAC WITH UFSBI GENERAL PRESENTATION 18_05_2017-1.pptx
 
꧁❤ Aerocity Call Girls Service Aerocity Delhi ❤꧂ 9999965857 ☎️ Hard And Sexy ...
꧁❤ Aerocity Call Girls Service Aerocity Delhi ❤꧂ 9999965857 ☎️ Hard And Sexy ...꧁❤ Aerocity Call Girls Service Aerocity Delhi ❤꧂ 9999965857 ☎️ Hard And Sexy ...
꧁❤ Aerocity Call Girls Service Aerocity Delhi ❤꧂ 9999965857 ☎️ Hard And Sexy ...
 

Implentation of Inverse Distance Weighting, Local Polynomial Interpolation, and Kriging Methodology using ArcGIS

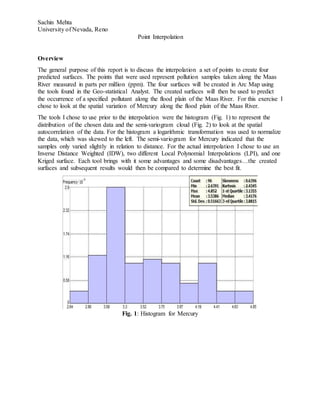
  • 1. Sachin Mehta University of Nevada, Reno Point Interpolation Overview The general purpose of this report is to discuss the interpolation a set of points to create four predicted surfaces. The points that were used represent pollution samples taken along the Maas River measured in parts per million (ppm). The four surfaces will be created in Arc Map using the tools found in the Geo-statistical Analyst. The created surfaces will then be used to predict the occurrence of a specified pollutant along the flood plain of the Maas River. For this exercise I chose to look at the spatial variation of Mercury along the flood plain of the Maas River. The tools I chose to use prior to the interpolation were the histogram (Fig. 1) to represent the distribution of the chosen data and the semi-variogram cloud (Fig. 2) to look at the spatial autocorrelation of the data. For the histogram a logarithmic transformation was used to normalize the data, which was skewed to the left. The semi-variogram for Mercury indicated that the samples only varied slightly in relation to distance. For the actual interpolation I chose to use an Inverse Distance Weighted (IDW), two different Local Polynomial Interpolations (LPI), and one Kriged surface. Each tool brings with it some advantages and some disadvantages…the created surfaces and subsequent results would then be compared to determine the best fit. Fig. 1: Histogram for Mercury
  • 2. Sachin Mehta University of Nevada, Reno Point Interpolation Fig. 2: Semi-variogram for Mercury. Methodology The first method chosen was the Inverse Distance Weighted (IDW) because it is known to be an exact interpolator. The idea behind the IDW is loosely based on Tobler’s law that states: “that things closer together are more closely related than those that are farther apart.” The IDW has a limited number of variables that can be changed, such as the power function and the neighborhood type. So with that in mind I chose to leave the power function at 2 and the neighborhood type to smooth. The smooth feature creates multiple ellipses to be used in the interpolation, while the power function is used to justify the best fit. The second method that was used was the Local Polynomial Interpolation (LPI). The idea behind LPI is the use of varying orders of polynomials to interpolate short-range variation within a search area or neighborhood to produce an output surface. In the first LPI there was only one variable that was changed was the kernel function which was changed from a polynomial function to Gaussian. The Gaussian function is a bell-shaped function it seems to normalize the data slightly. For the second LPI everything remained the same as the first LPI except for the use of the optimize button, which minimizes the mean square error. The last method used in this analysis was a spatial analysis tool named kriging. Kriging uses the concept of auto-correlation which tend to provide a better measure of certainty or accuracy than the other method which use deterministic interpolation. The first option that was change for the analysis was the kriging type, it was changed from a simple to an ordinary. The ordinary kriging is an examination of the trend, if it is unknown and is composed of a linear function it will fit, if it varies or is known one of the other types of kriging will be used. The next step was to use a first order trend removal, this was done to provide a normality or stationarity (special
  • 3. Sachin Mehta University of Nevada, Reno Point Interpolation homogeneity). There were two steps that followed first was to change that kernel function to Gaussian, then use the optimize button. The Gaussian again normalizes the data and the optimize button minimizes the mean square error. The neighborhood type was left as standard. Results The results varied widely with some of the created surfaces over-predicting while others under- predicted these can be found in (Table 1). Analyzing the IDW created surface found in (Fig. 3) it is noticeable that it created small concentric circles around some points, but not around all the points. This could be attributed to the fact that the IDW is an exact interpolator and the values of the surrounding points weren’t the same. The predicted values didn’t show much change from the actual values which could be a good indicator that is this surface might be really close to what might actually be occurring along the Maas River. Fig. 3: Inverse Distance Weighting created surface of Mercury
  • 4. Sachin Mehta University of Nevada, Reno Point Interpolation The IDW had a Root Mean Squared (RMS) value of 18.69326 which is relatively high. This could indicate that the IDW created surface is grossly over-estimating, though is doesn’t actually seem like it after a visual comparison. The next method used was the LPI, the results can be found in (Fig. 4) and (Fig. 5). The first surface that was created had two portions that were completely blank, one on the bottom and the other in the right hand corner. This could be attributed to the fact that nearest points were too far away for the LPI to create a predicted surface. The RMS value for this surface was 14.36267 which is relatively high. This could be found in the surface values, which slightly under-estimate at the low end and grossly over- estimate on the high end when compared to the actual sample values. The other surface that was created didn’t have such large portions that were left blank, but they were still there. This is because there were no points close enough for the LPI to predict what values should cover that particular surface. This surface had a slightly higher RMS value of 16.1452, but a low Root Mean-Square Standardized (RMSS) value of 0.97938. This would indicate that the surface created is an underestimate, this noticeable when comparing the created values with the actual values. The lower values of the predicted surface were far too low and the higher values were also lower than they should have been. Fig. 4: Mercury LPI Analysis Fig. 5: Mercury LPI (Optimized) Analysis
  • 5. Sachin Mehta University of Nevada, Reno Point Interpolation The last surface that was created was the Kriged surface which is found in (Fig. 6). The first noticeable difference is the large portion in the lower right that is blank. This is a result of the neighborhood search area being too small, so the resulting surface tends to exclude some areas. In this case the area which has no almost no data points, which is very similar to the non-optimized LPI created surface. Something else that stands out is how jagged the surface is compared to the other surfaces which look relatively smooth in comparison. This could be because the Kriged surface tends to create a better measure of certainty or accuracy. Fig. 6: Kriged Surface for Mercury The Kriged surface produced a RMS of 15.32313 and a RMSS of 1.18722, which are good indicators of slight over-estimating. This can be found when comparing the Mercury samples to the values produced by the Kriged surface. The lower end seems to be only slightly over estimated, while the upper-end results are just a little higher only at the extreme. This would conclude the results portion of the analysis. Table 1: Results of Analyses for Mercury Method Min_value (ppm) Max_value (ppm) Percent area >20 ppm Percent area >60 ppm Percent area >160 ppm IDW 14.02470303 127.5209198 3 89.9 7.1 LPI 10.49144936 158.2221069 12.2 76.9 10.9 LPI (optimized) -0.534780145 116.6180954 0 0 0 Kriging 9.593212128 152.0141754 13.7 76.2 10.1
  • 6. Sachin Mehta University of Nevada, Reno Point Interpolation Conclusion This analysis produced some interesting results and not being able to get percent area for the LPI (optimized) through off the comparison a bit. In my opinion the kriged surface produced the optimal results. Though the IDW seemed to be the most accurate, they did not appear to be realistic. Then again none of these results seemed very realistic because other variables such as elevation, course of the river, distance to river, and other heavy metals were not compared. If elevation was considered it could be used to determine if there were any hills or sinks where the presence of the Mercury might be higher or lower. The course of the river and distance to river play an important part because it could take a turn at the top or the bottom which could indicate why some Mercury sample are found in certain areas. The last uncertainty would be to compare the other heavy metals that were taken and determine if they accumulated in the same areas. Without comparing these other variables the analysis seems to come up a little short of expectations.